Multi-site federation
A Data Platform module for organizations with multiple independent installations: a single registry of sites, monitoring of site availability and data intake, summary metrics across the whole network, and access to any site without signing in again.
Federation is a Data Platform module for organizations with multiple independent installations. It combines sites — separate installations of the platform in regions, branches, and subsidiaries — into a single network. One screen shows the state of that network: which sites are running normally, whether data is arriving from metering devices, and how many metering units are being monitored in total.
The module is designed for federations of up to 100 sites, each with anywhere from hundreds of thousands to several million metering units.
Capabilities
- A single registry of sites, grouped by country, region, or owner
- Monitoring of each site’s availability and of data intake from its devices
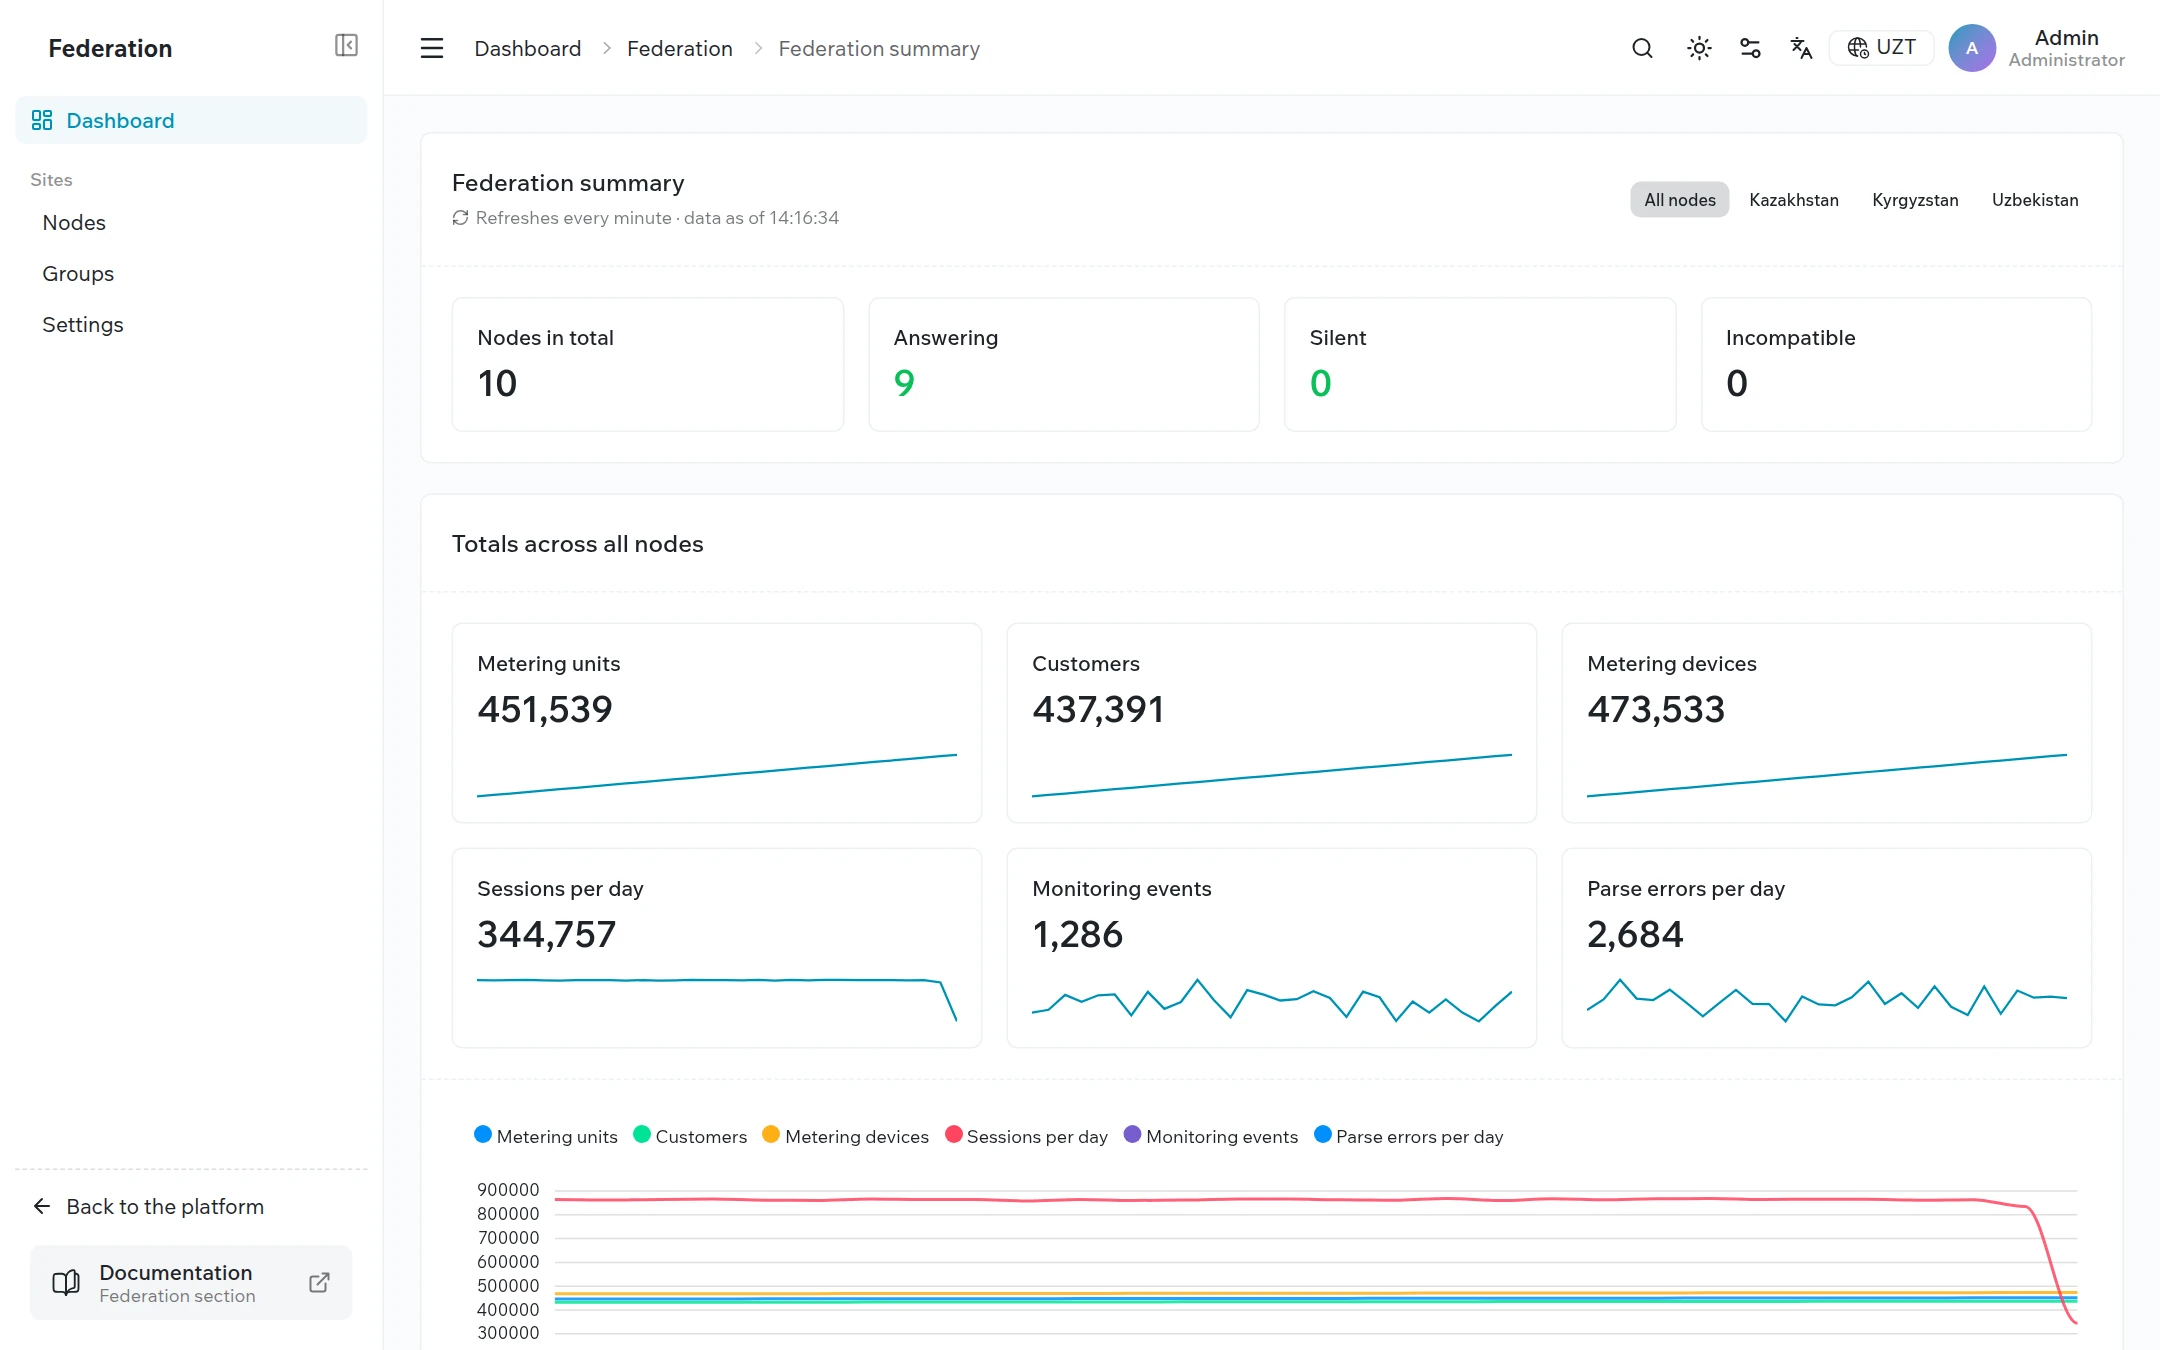
- Summary metrics across the whole network: metering units, customers, devices, communication sessions, monitoring events, and parse errors
- Metric trends over 30 days — for the federation, for a group, and for an individual site
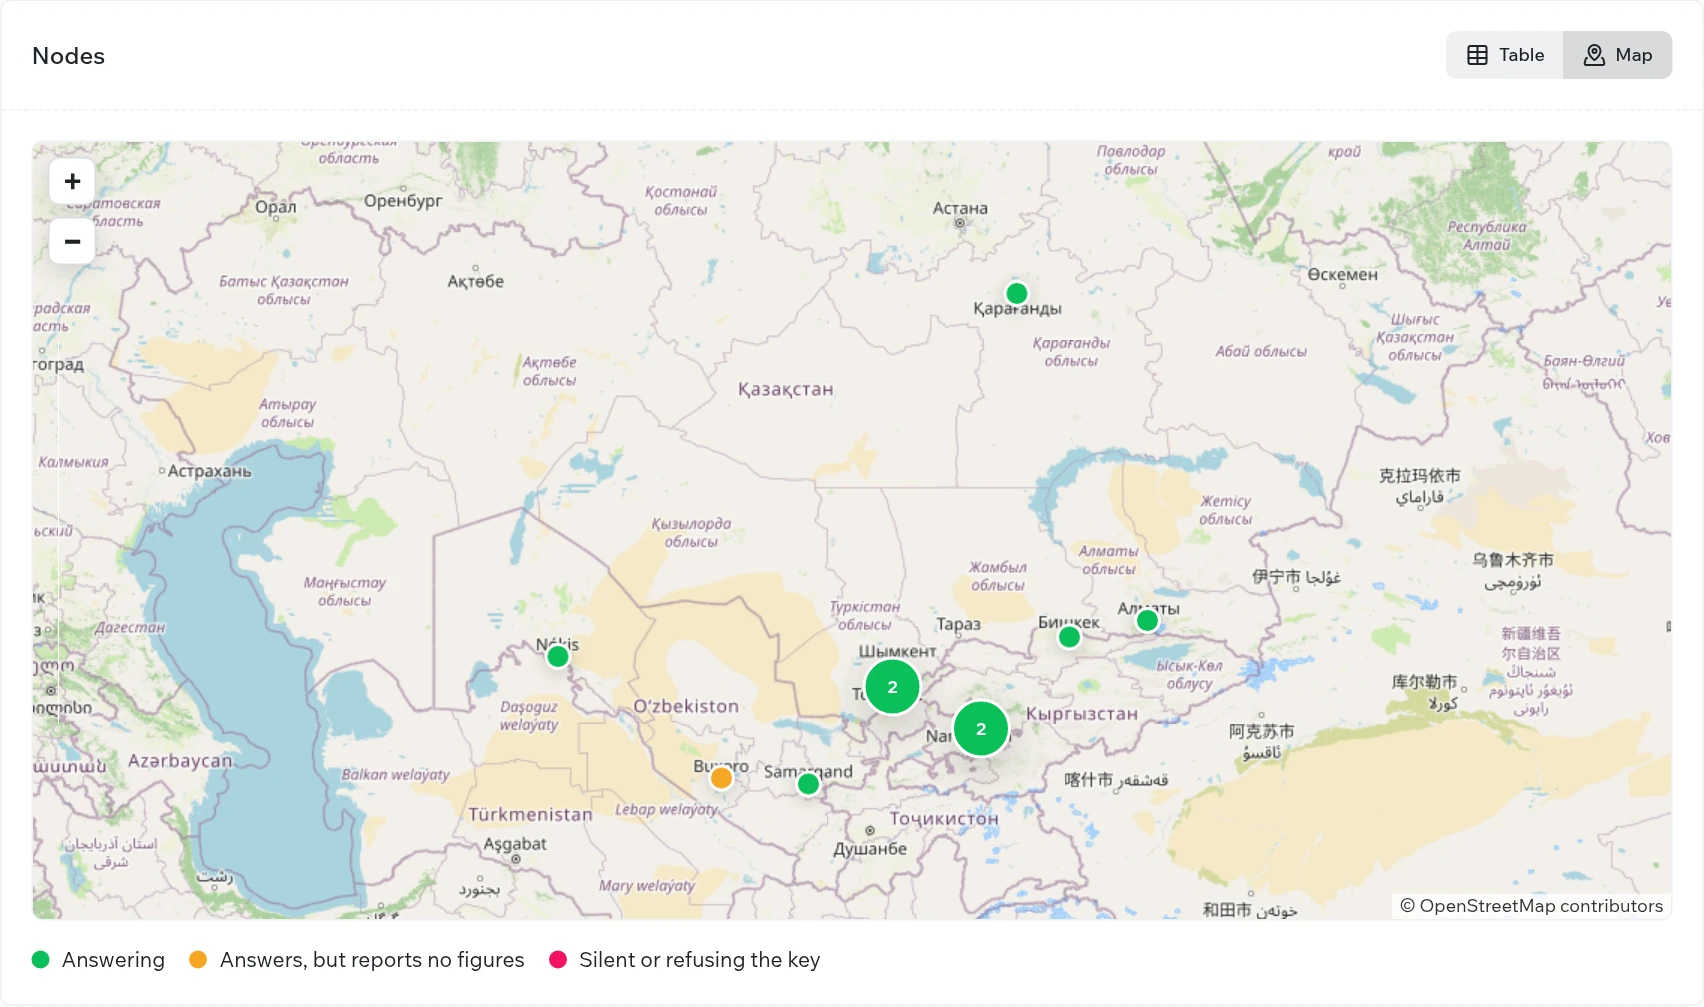
- A map of sites with color-coded status
- One-click access to any site without re-entering a password
- Secure site onboarding and automatic access key rotation
- A log of requests made to each site, for troubleshooting
Key principles
- Data stays at the site. The federation console receives only aggregate counters. Information about individual metering units, devices, and measurements does not leave the site.
- The site grants access. The console connects to a site using a key issued by that site’s administrator, and only the site administrator can revoke it.
- Scale does not affect speed. Metrics are collected on a schedule and stored in the console, so the summary opens instantly regardless of the number of sites.
- Responding is not the same as working properly. If a site responds but receives no data from its devices, the console flags it separately.
- Secrets stay on the server. The access key is stored encrypted and is not sent to the browser; signing in to a site uses a one-time ticket.
Main screens
Summary
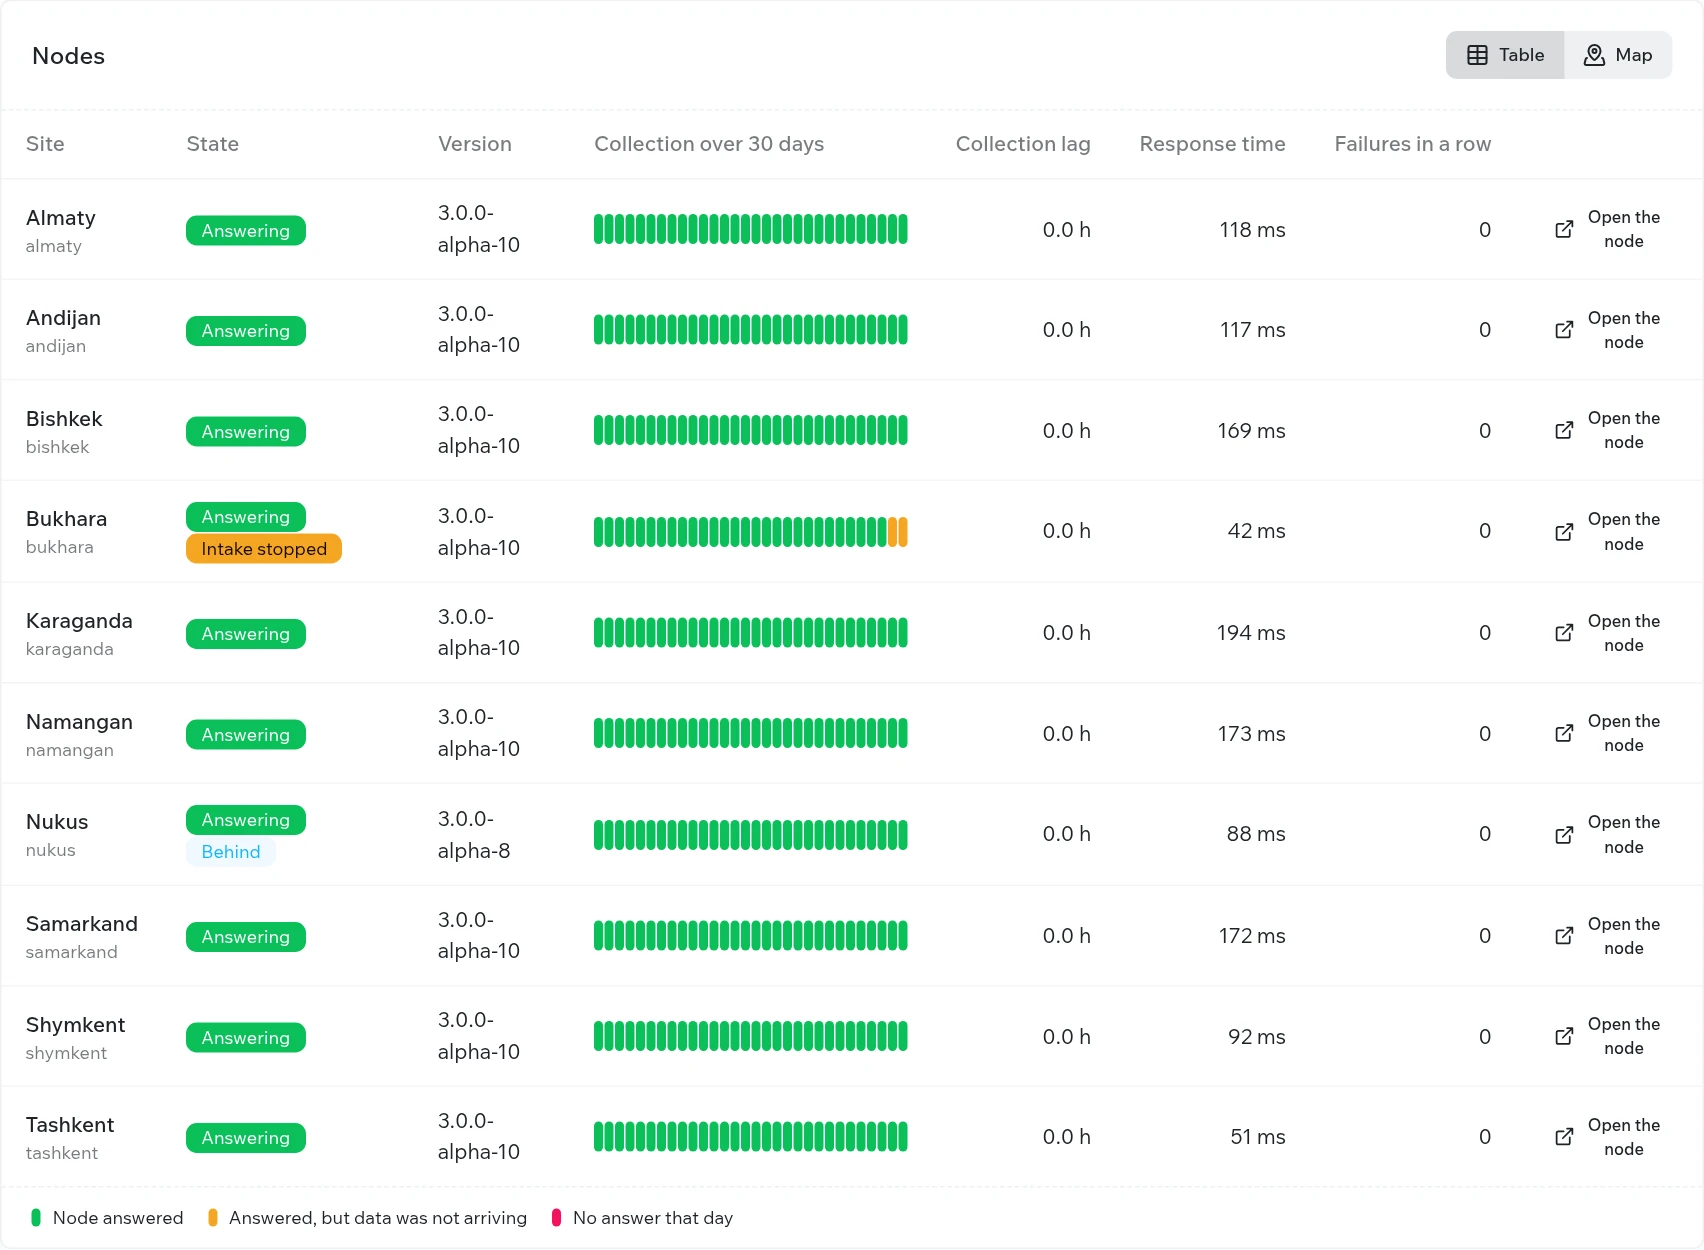
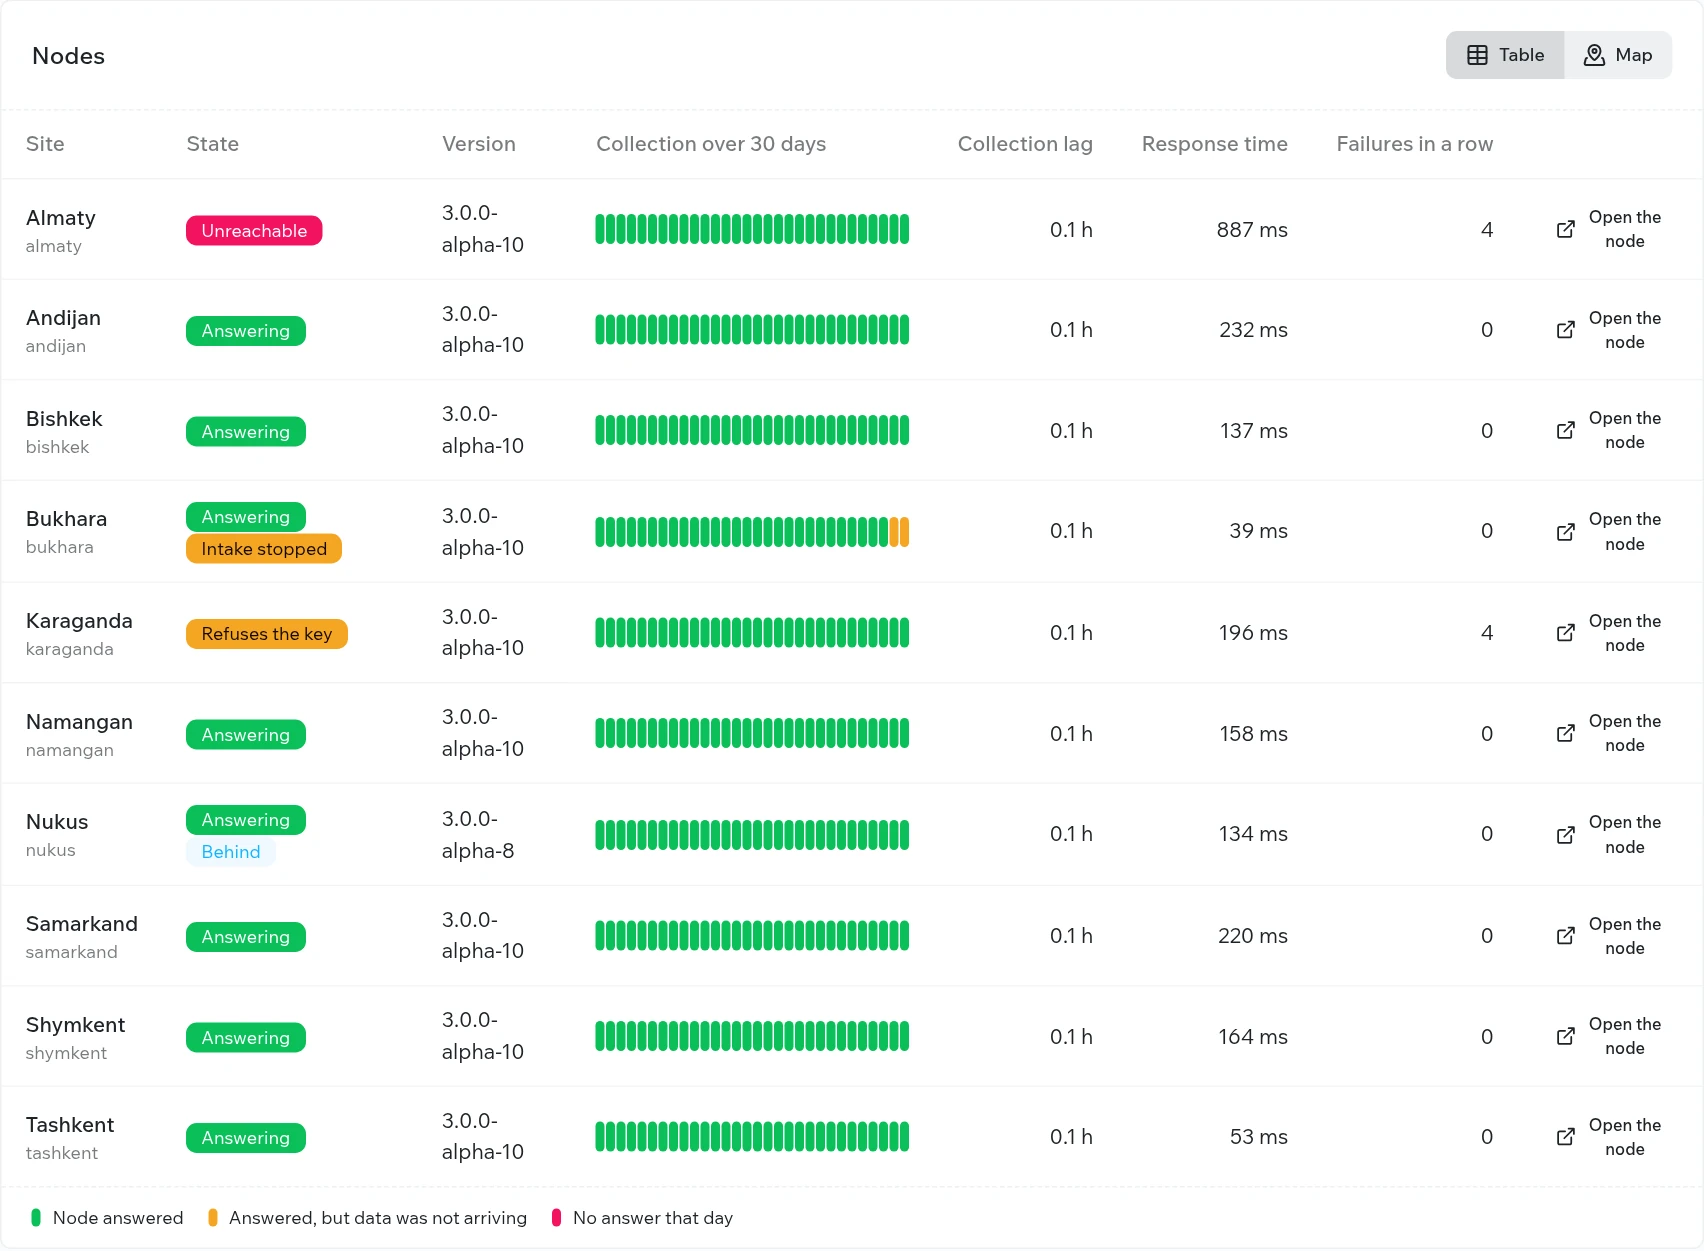
This is the operator’s main screen. It brings together status tiles, totals with trends, data quality, site groups, and a table that gives each site its own row with a 30-day collection history.
Map
The map shows sites color-coded by status: green — running normally; orange — responding, but no data is arriving; red — not responding or refusing the key.
Registry and site card
The registry is the complete list of sites, filterable by group and status. The site card shows the site’s version, supported features, access key, latest metrics, trends over the past month, and a log of requests that ended abnormally.
Opening a site
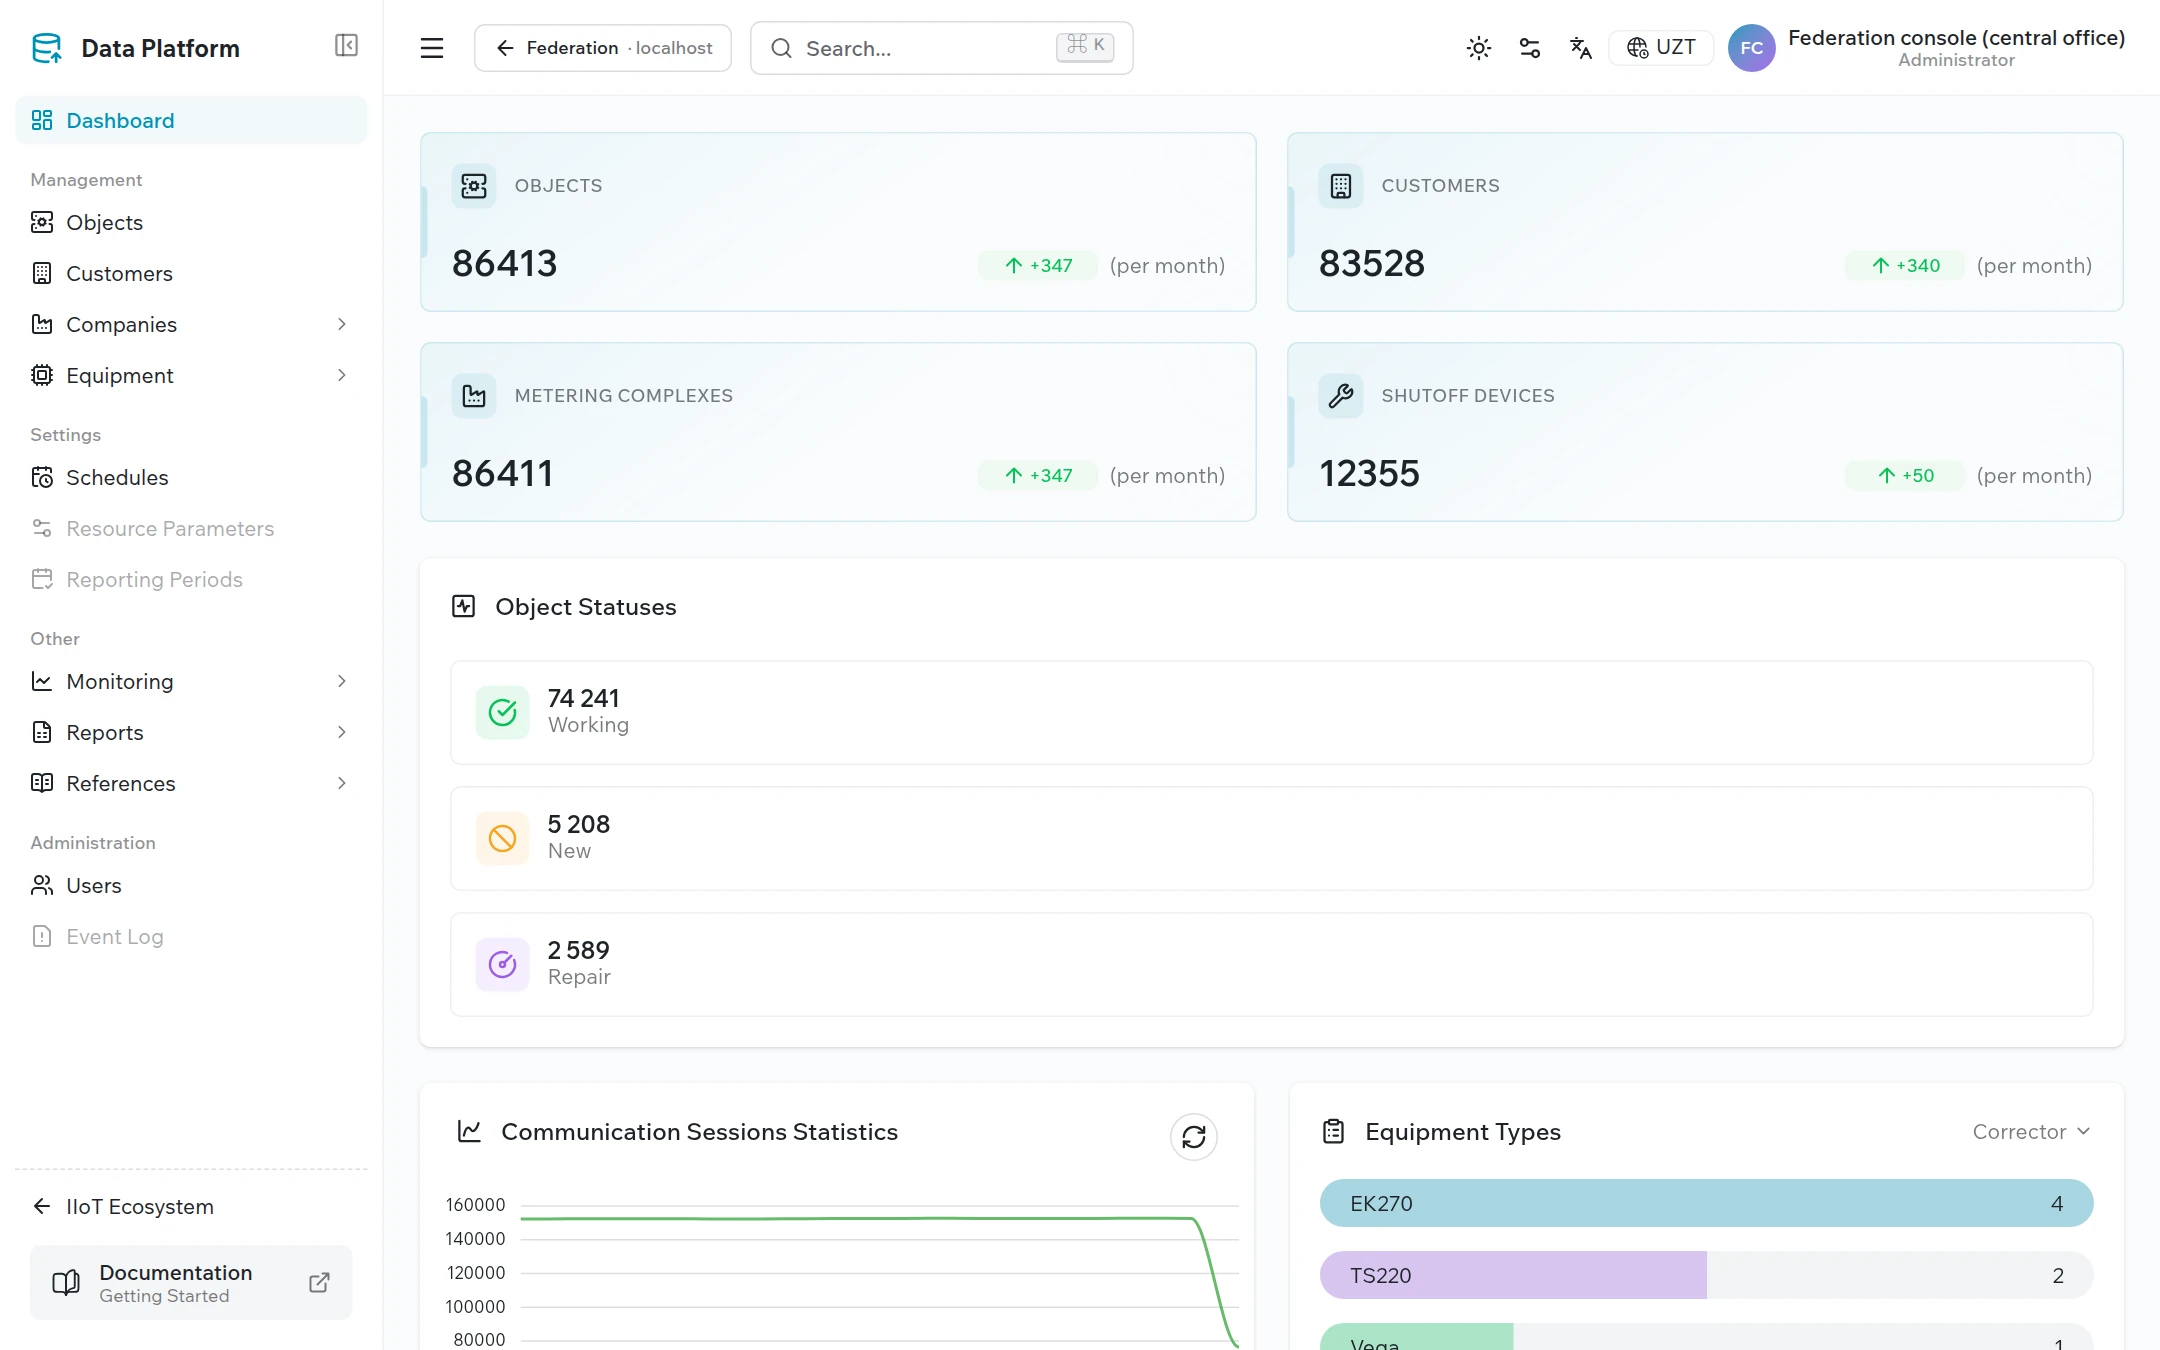
The Open the node button opens a site without prompting for a username and password. The operator works under a service account with view permissions and can return to the console with the ← Federation button in the site’s header.
Fault monitoring
The console distinguishes between common faults and suggests where to look for the cause: the site is unreachable over the network, it refuses the key, data intake from its devices has stopped, or its platform version is outdated.
Onboarding a site
| Step | Performed by | Action |
|---|---|---|
| 1 | Site administrator | Issues a key for the federation in the Access tokens section |
| 2 | Federation operator | Registers the site in the console: code, address, group, coordinates, key |
| 3 | Federation operator | Clicks Probe now and confirms that the site is in the Answering state |
The first metrics appear within 15 minutes; trends become available the next day.
مواضيع ذات صلة
هل كانت هذه الصفحة مفيدة؟
شكرًا على ملاحظاتك!