مساحات العمل والشاشات
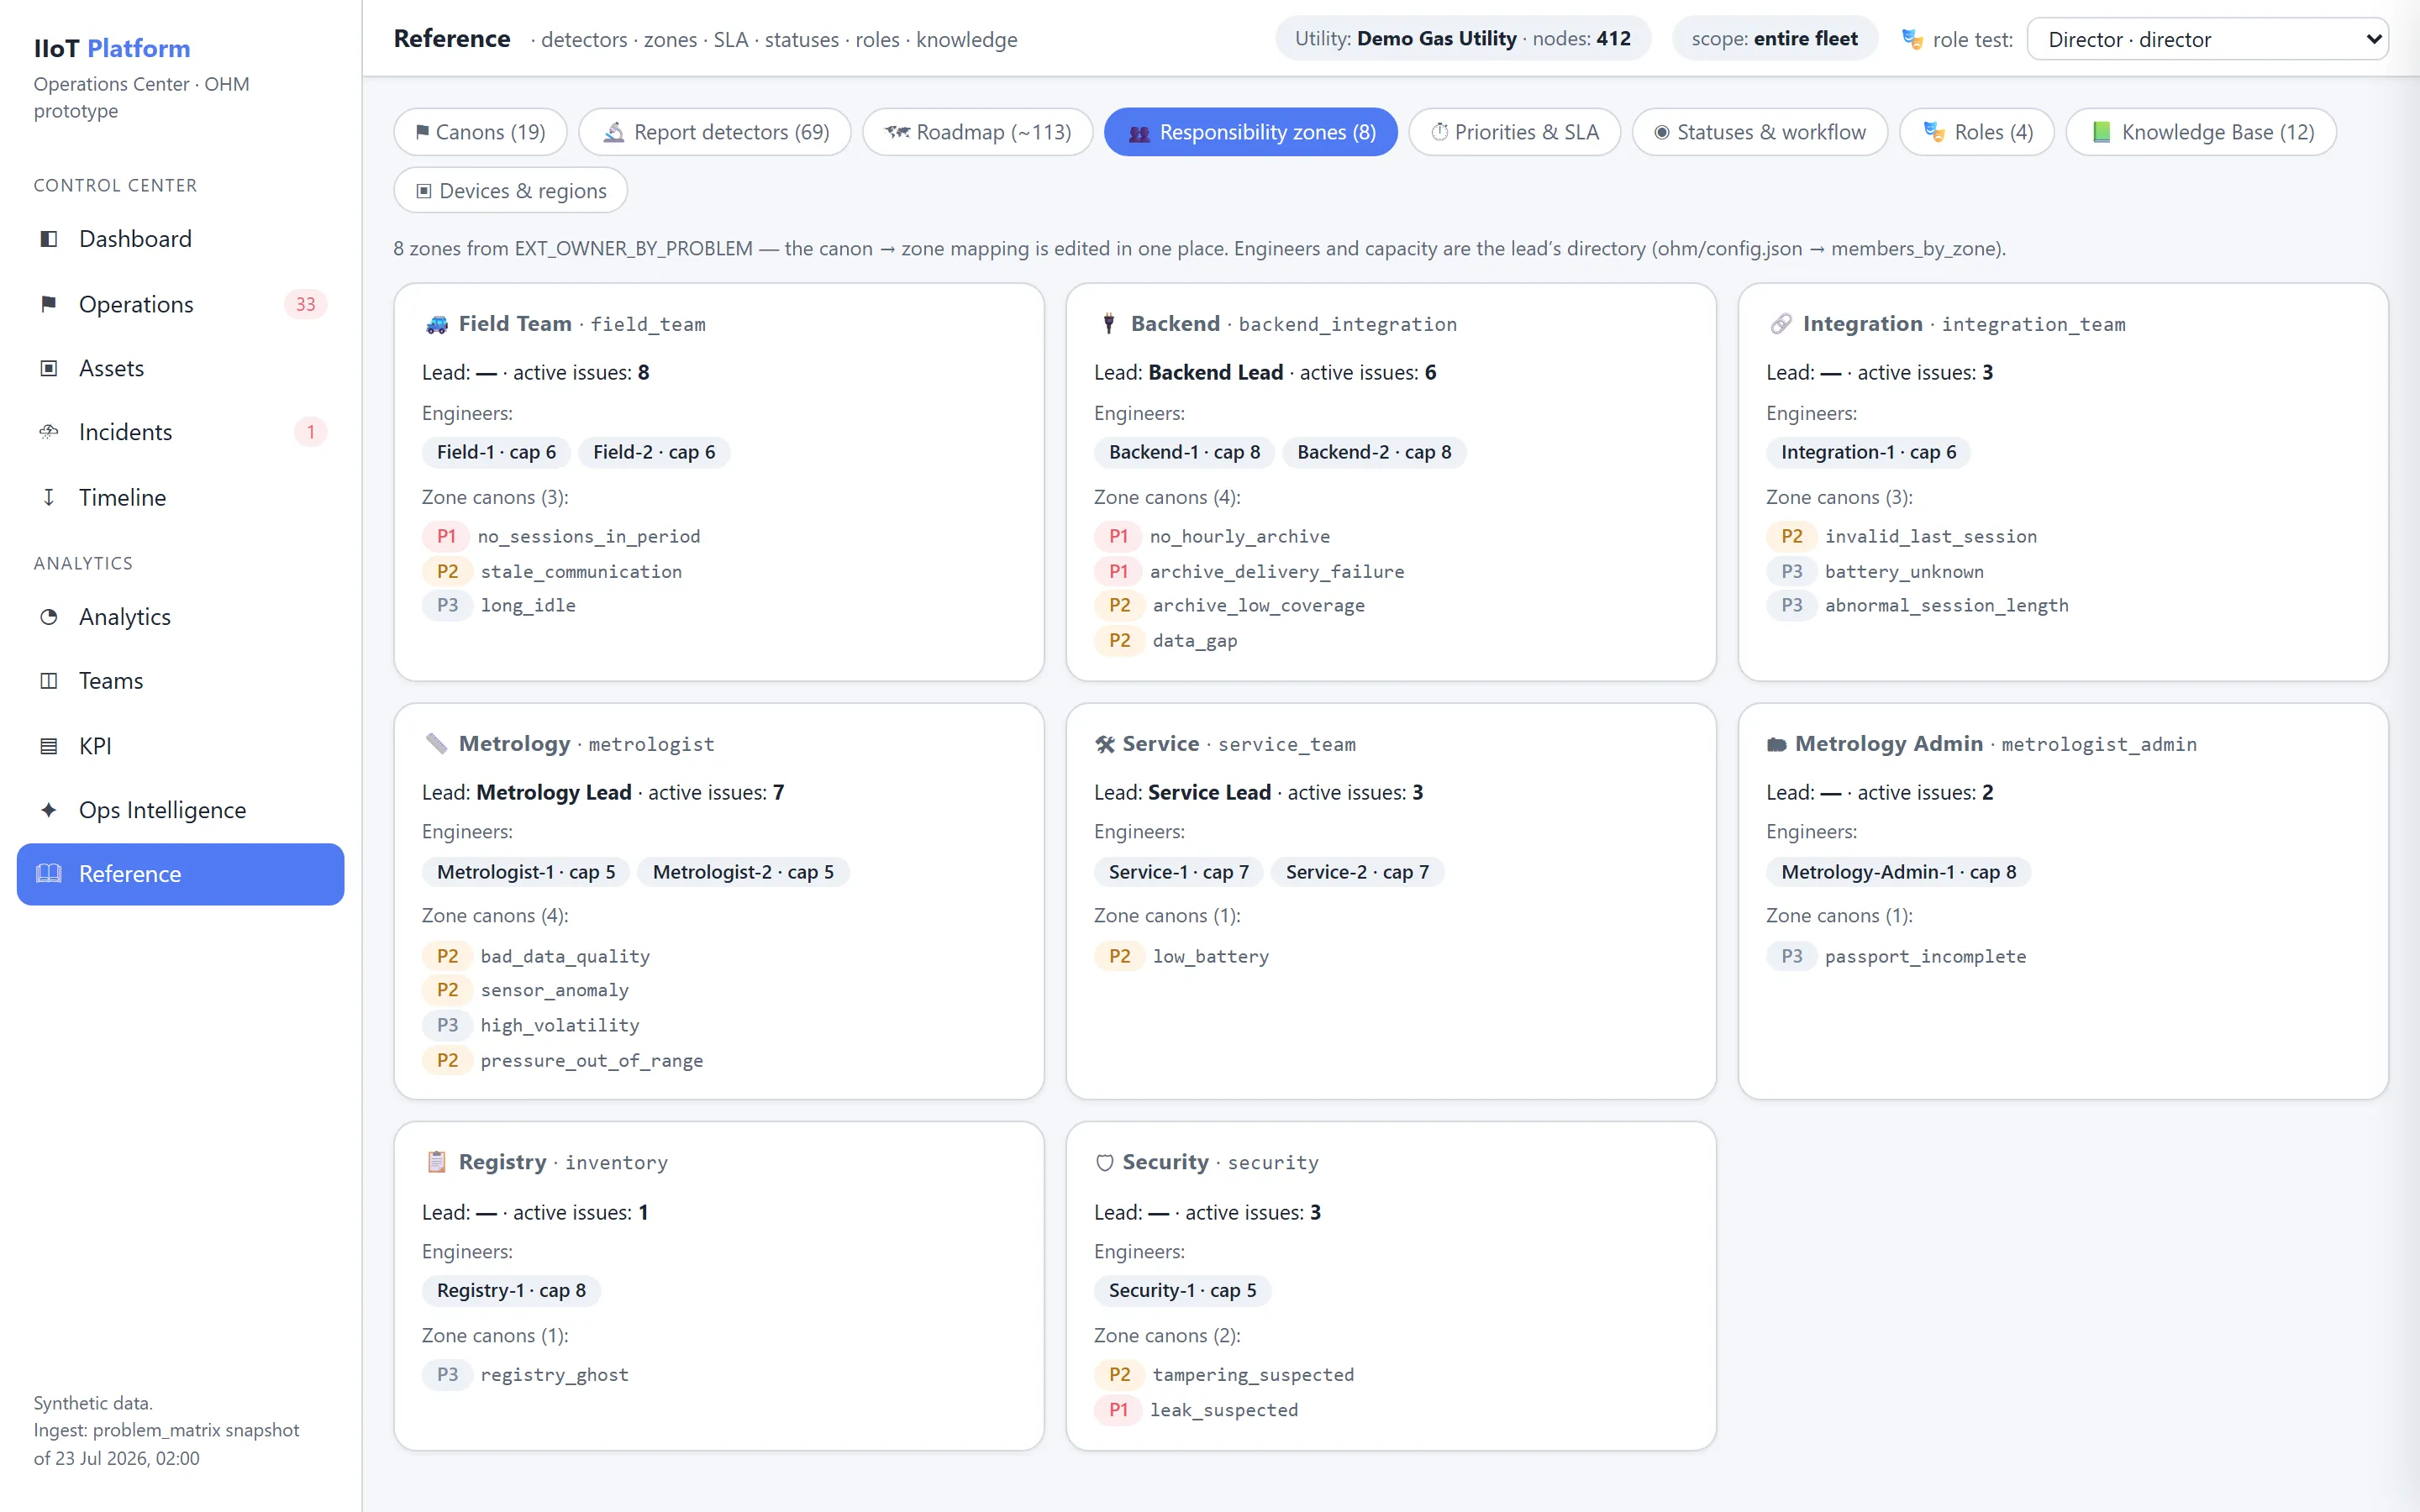
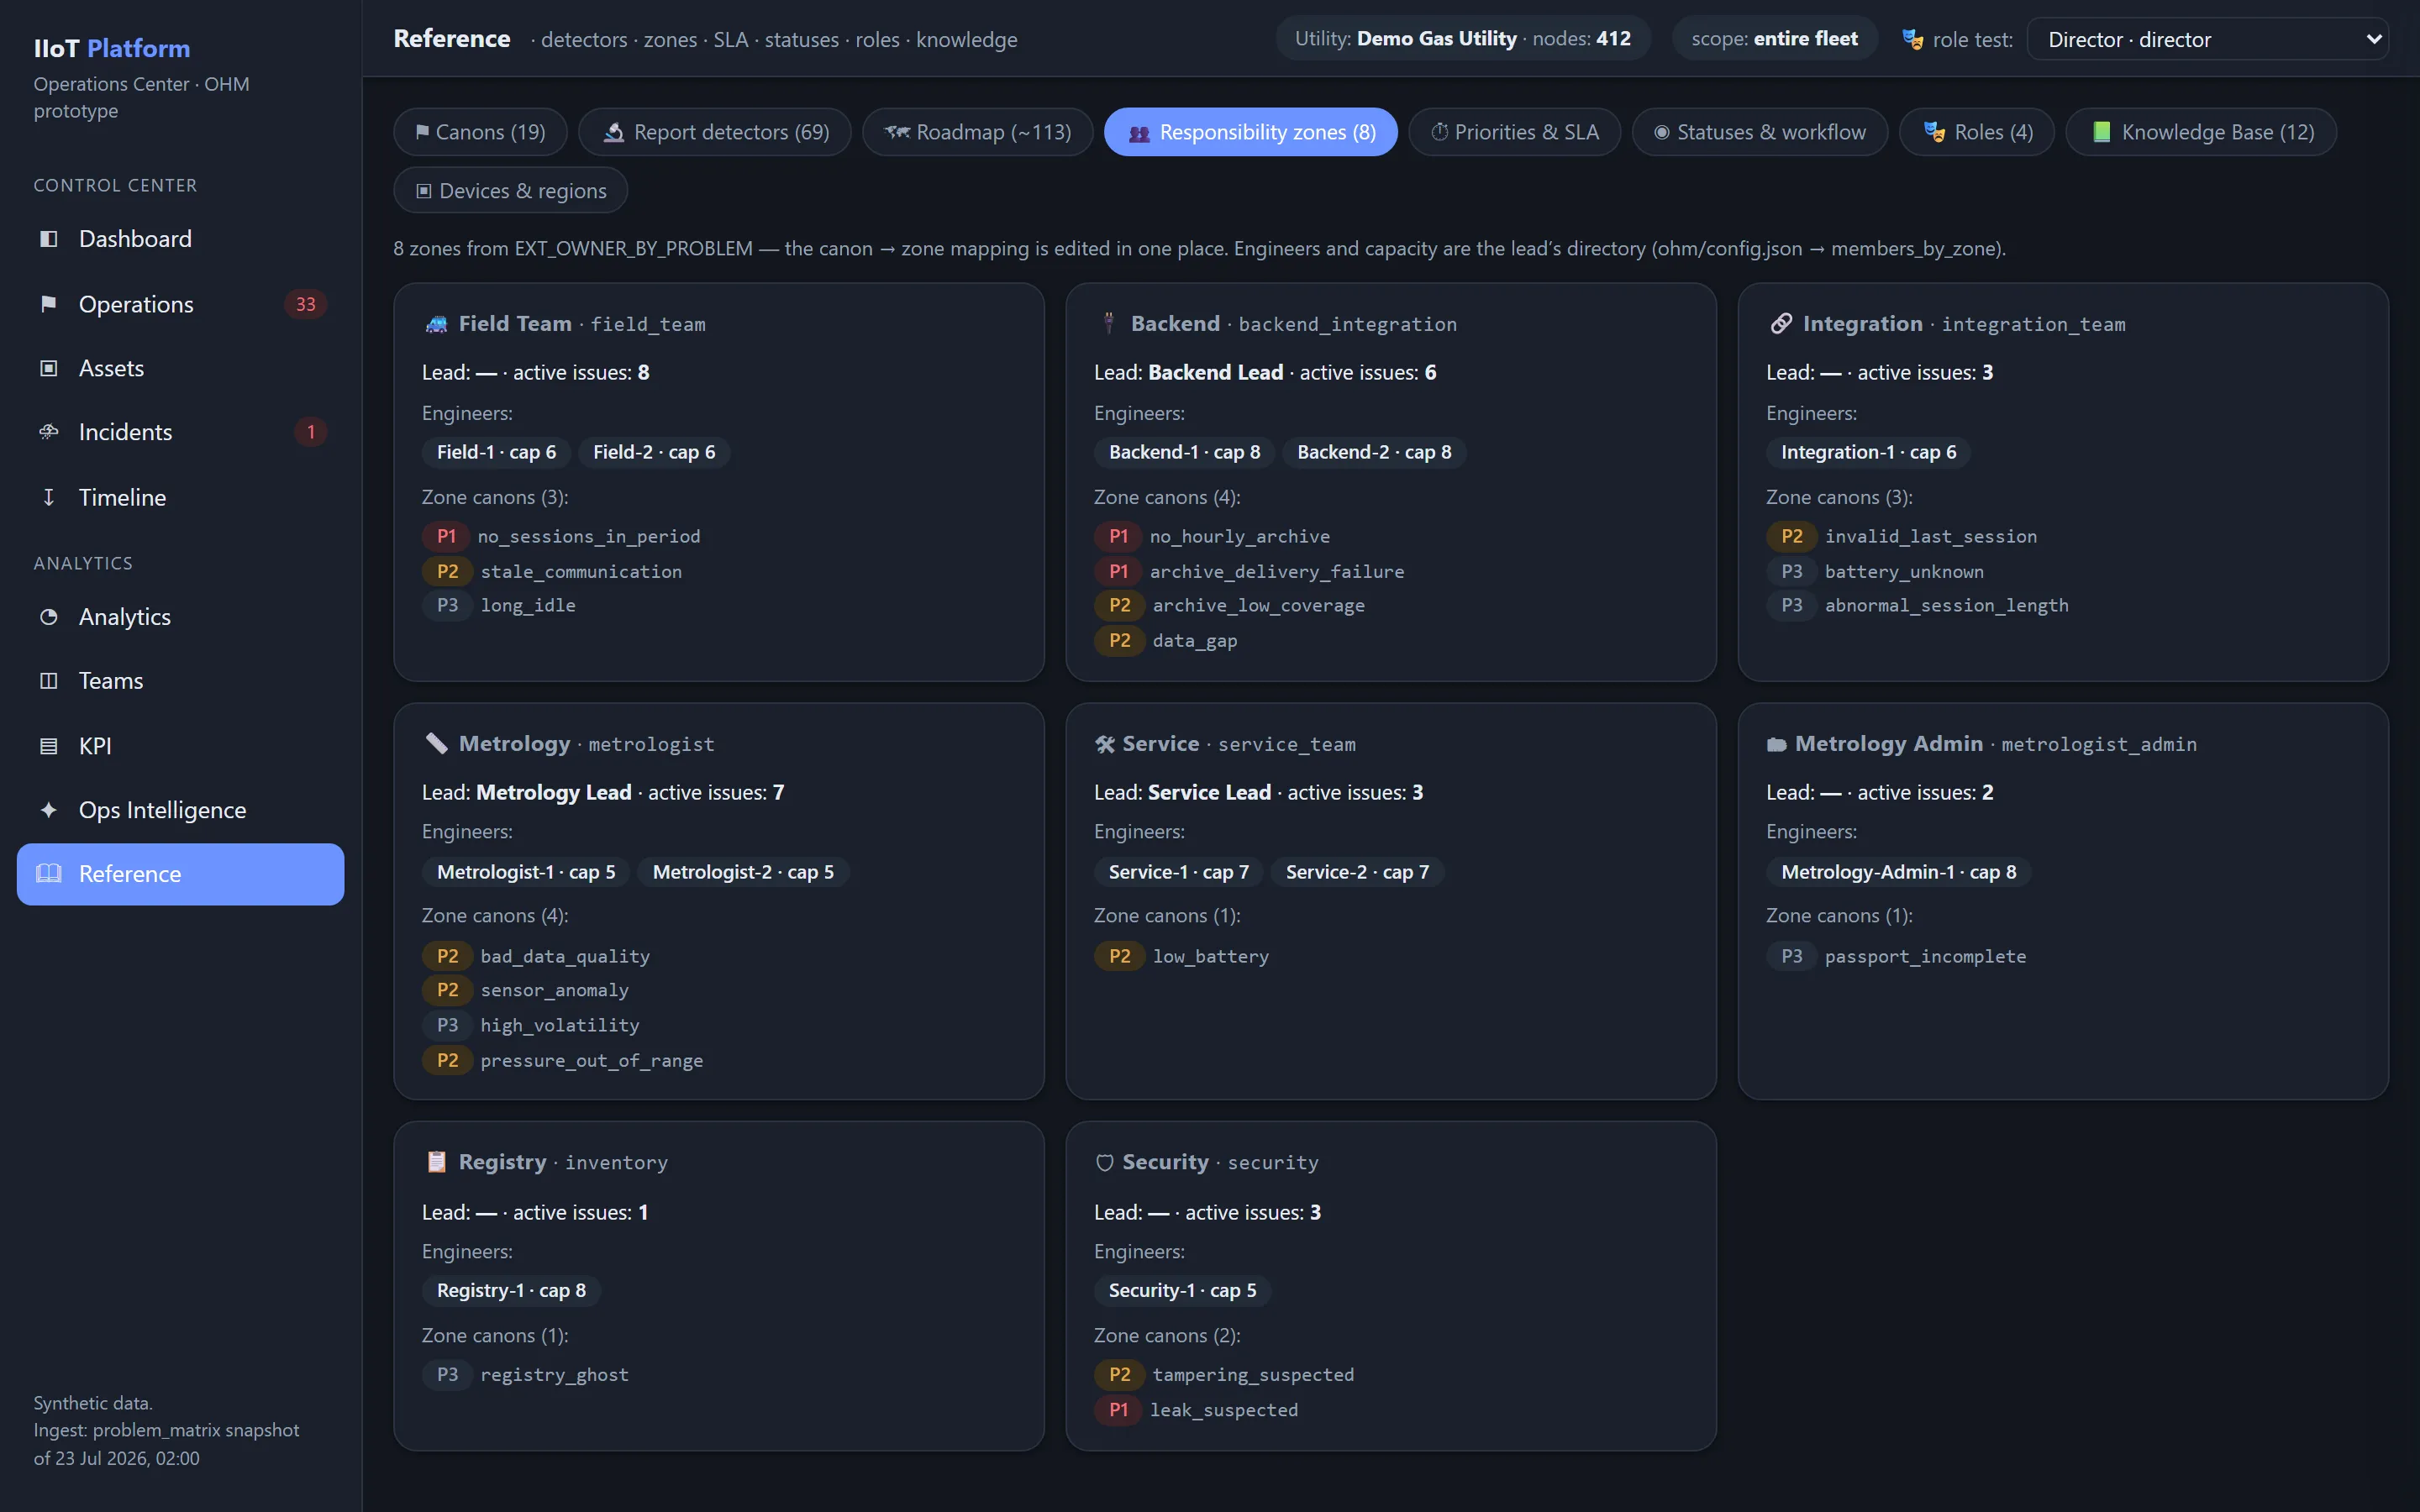
مساحات عمل قائمة على الأدوار للمدير ومديري المناطق والمهندسين والمترولوجيين وخدمة الأمن، والشاشات الأساسية في Operations Center، وكيف يحدّد الـ scope على جانب الخادم ما يراه كلّ دور.
مساحات العمل القائمة على الأدوار
يكيّف OHM الواجهة والمؤشّرات ومجموعات البيانات المعروضة وفق دور المستخدم.
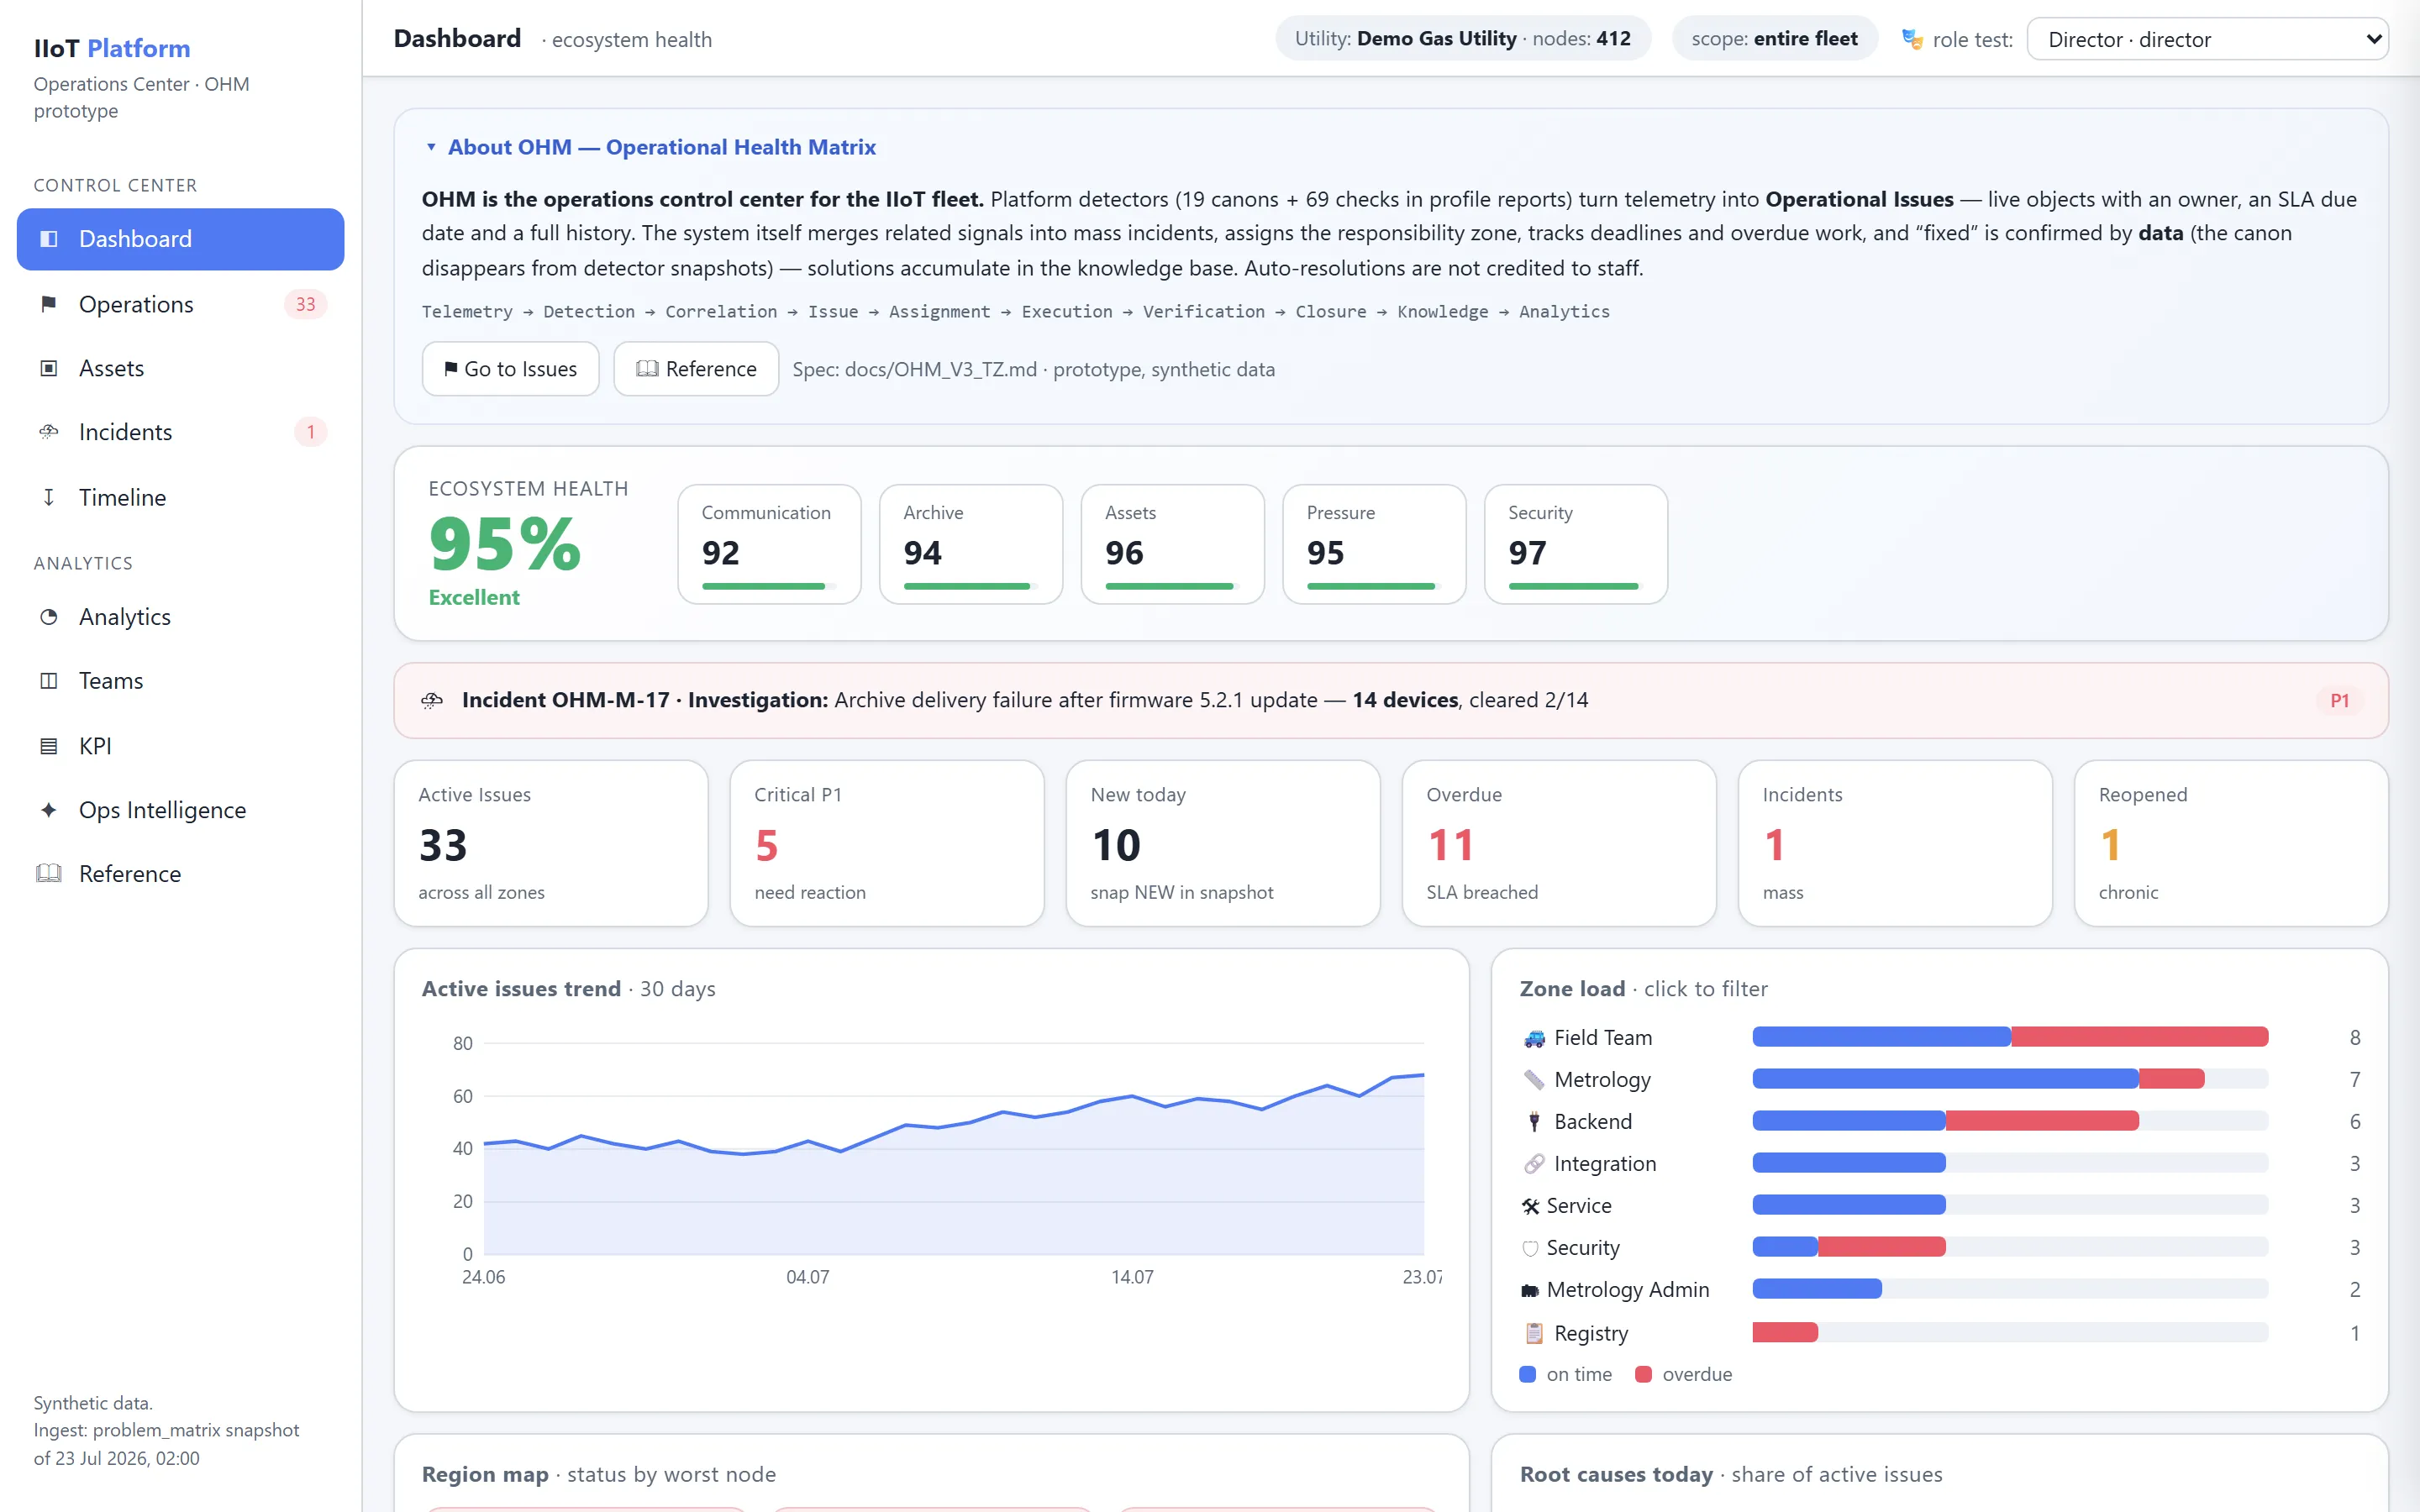
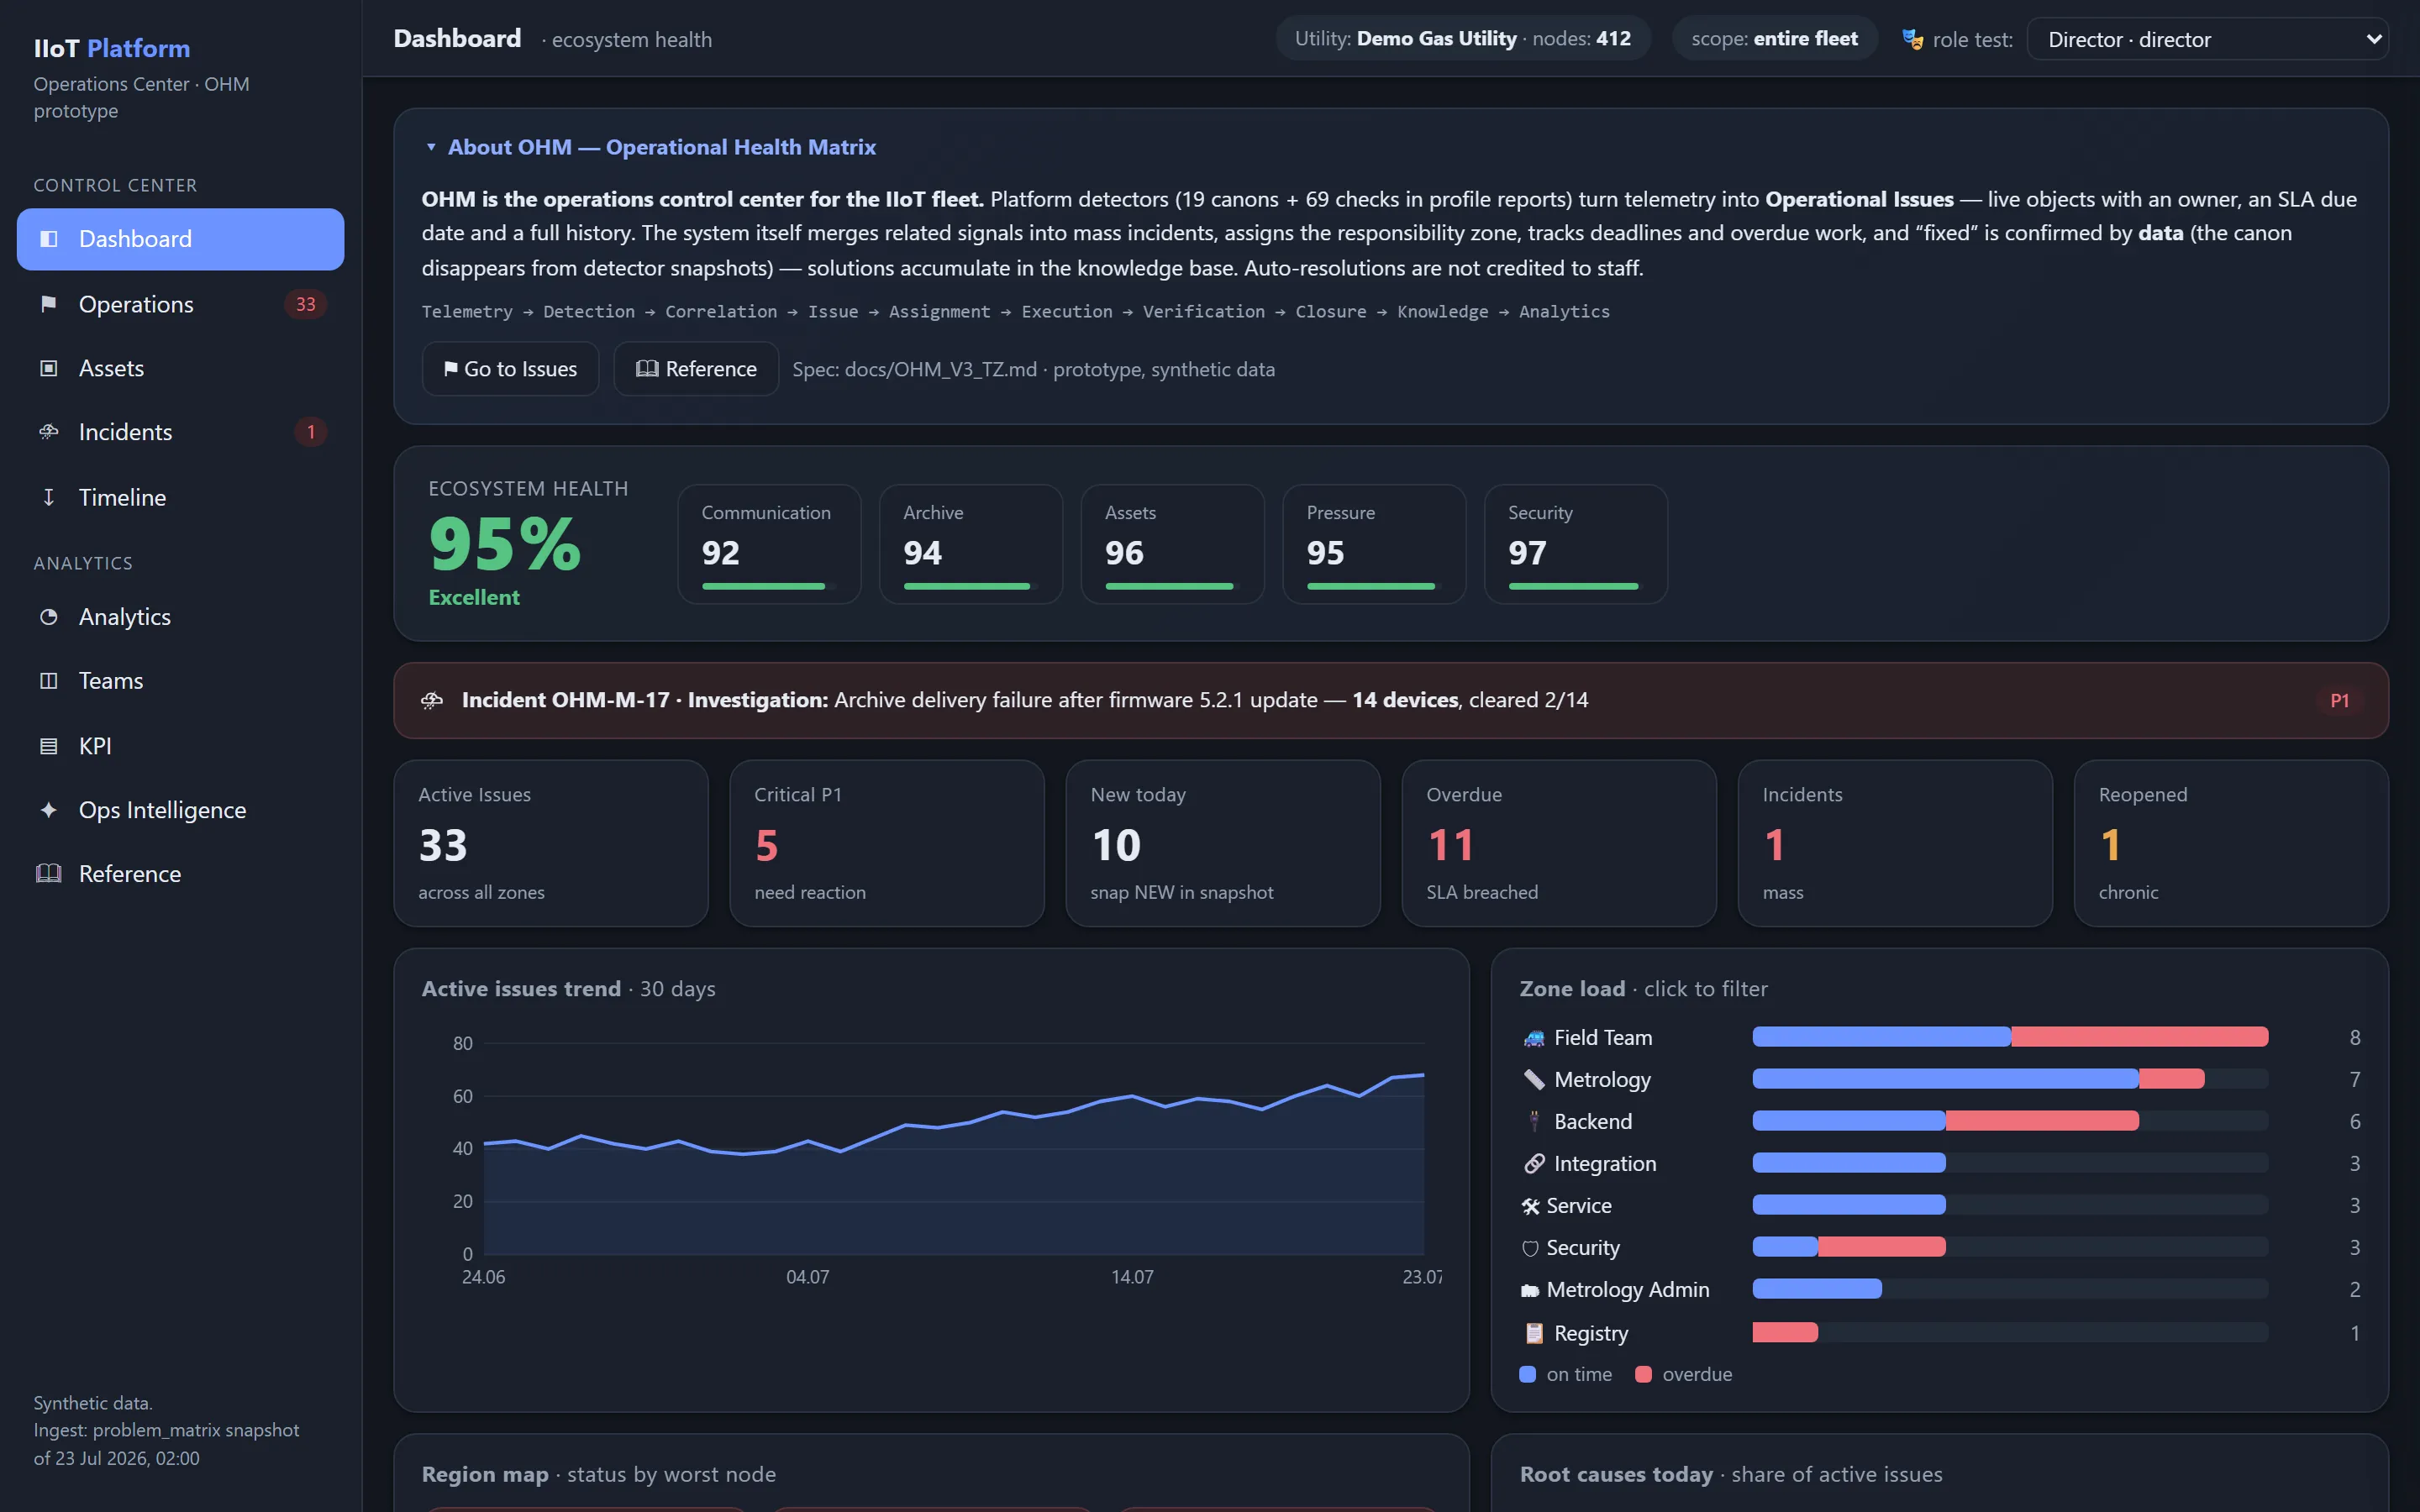
المدير
يرى:
- Ecosystem Health؛
- Issues الحرجة؛
- الحوادث الجماعية (Massive Incidents)؛
- SLA violations؛
- التوزيع حسب الأقاليم؛
- الأسباب الجذرية (Root Causes)؛
- ديناميكيات الـ backlog؛
- المخاطر الرئيسية؛
- حِمل العمل في الأقسام؛
- المشكلات المتوقَّعة.
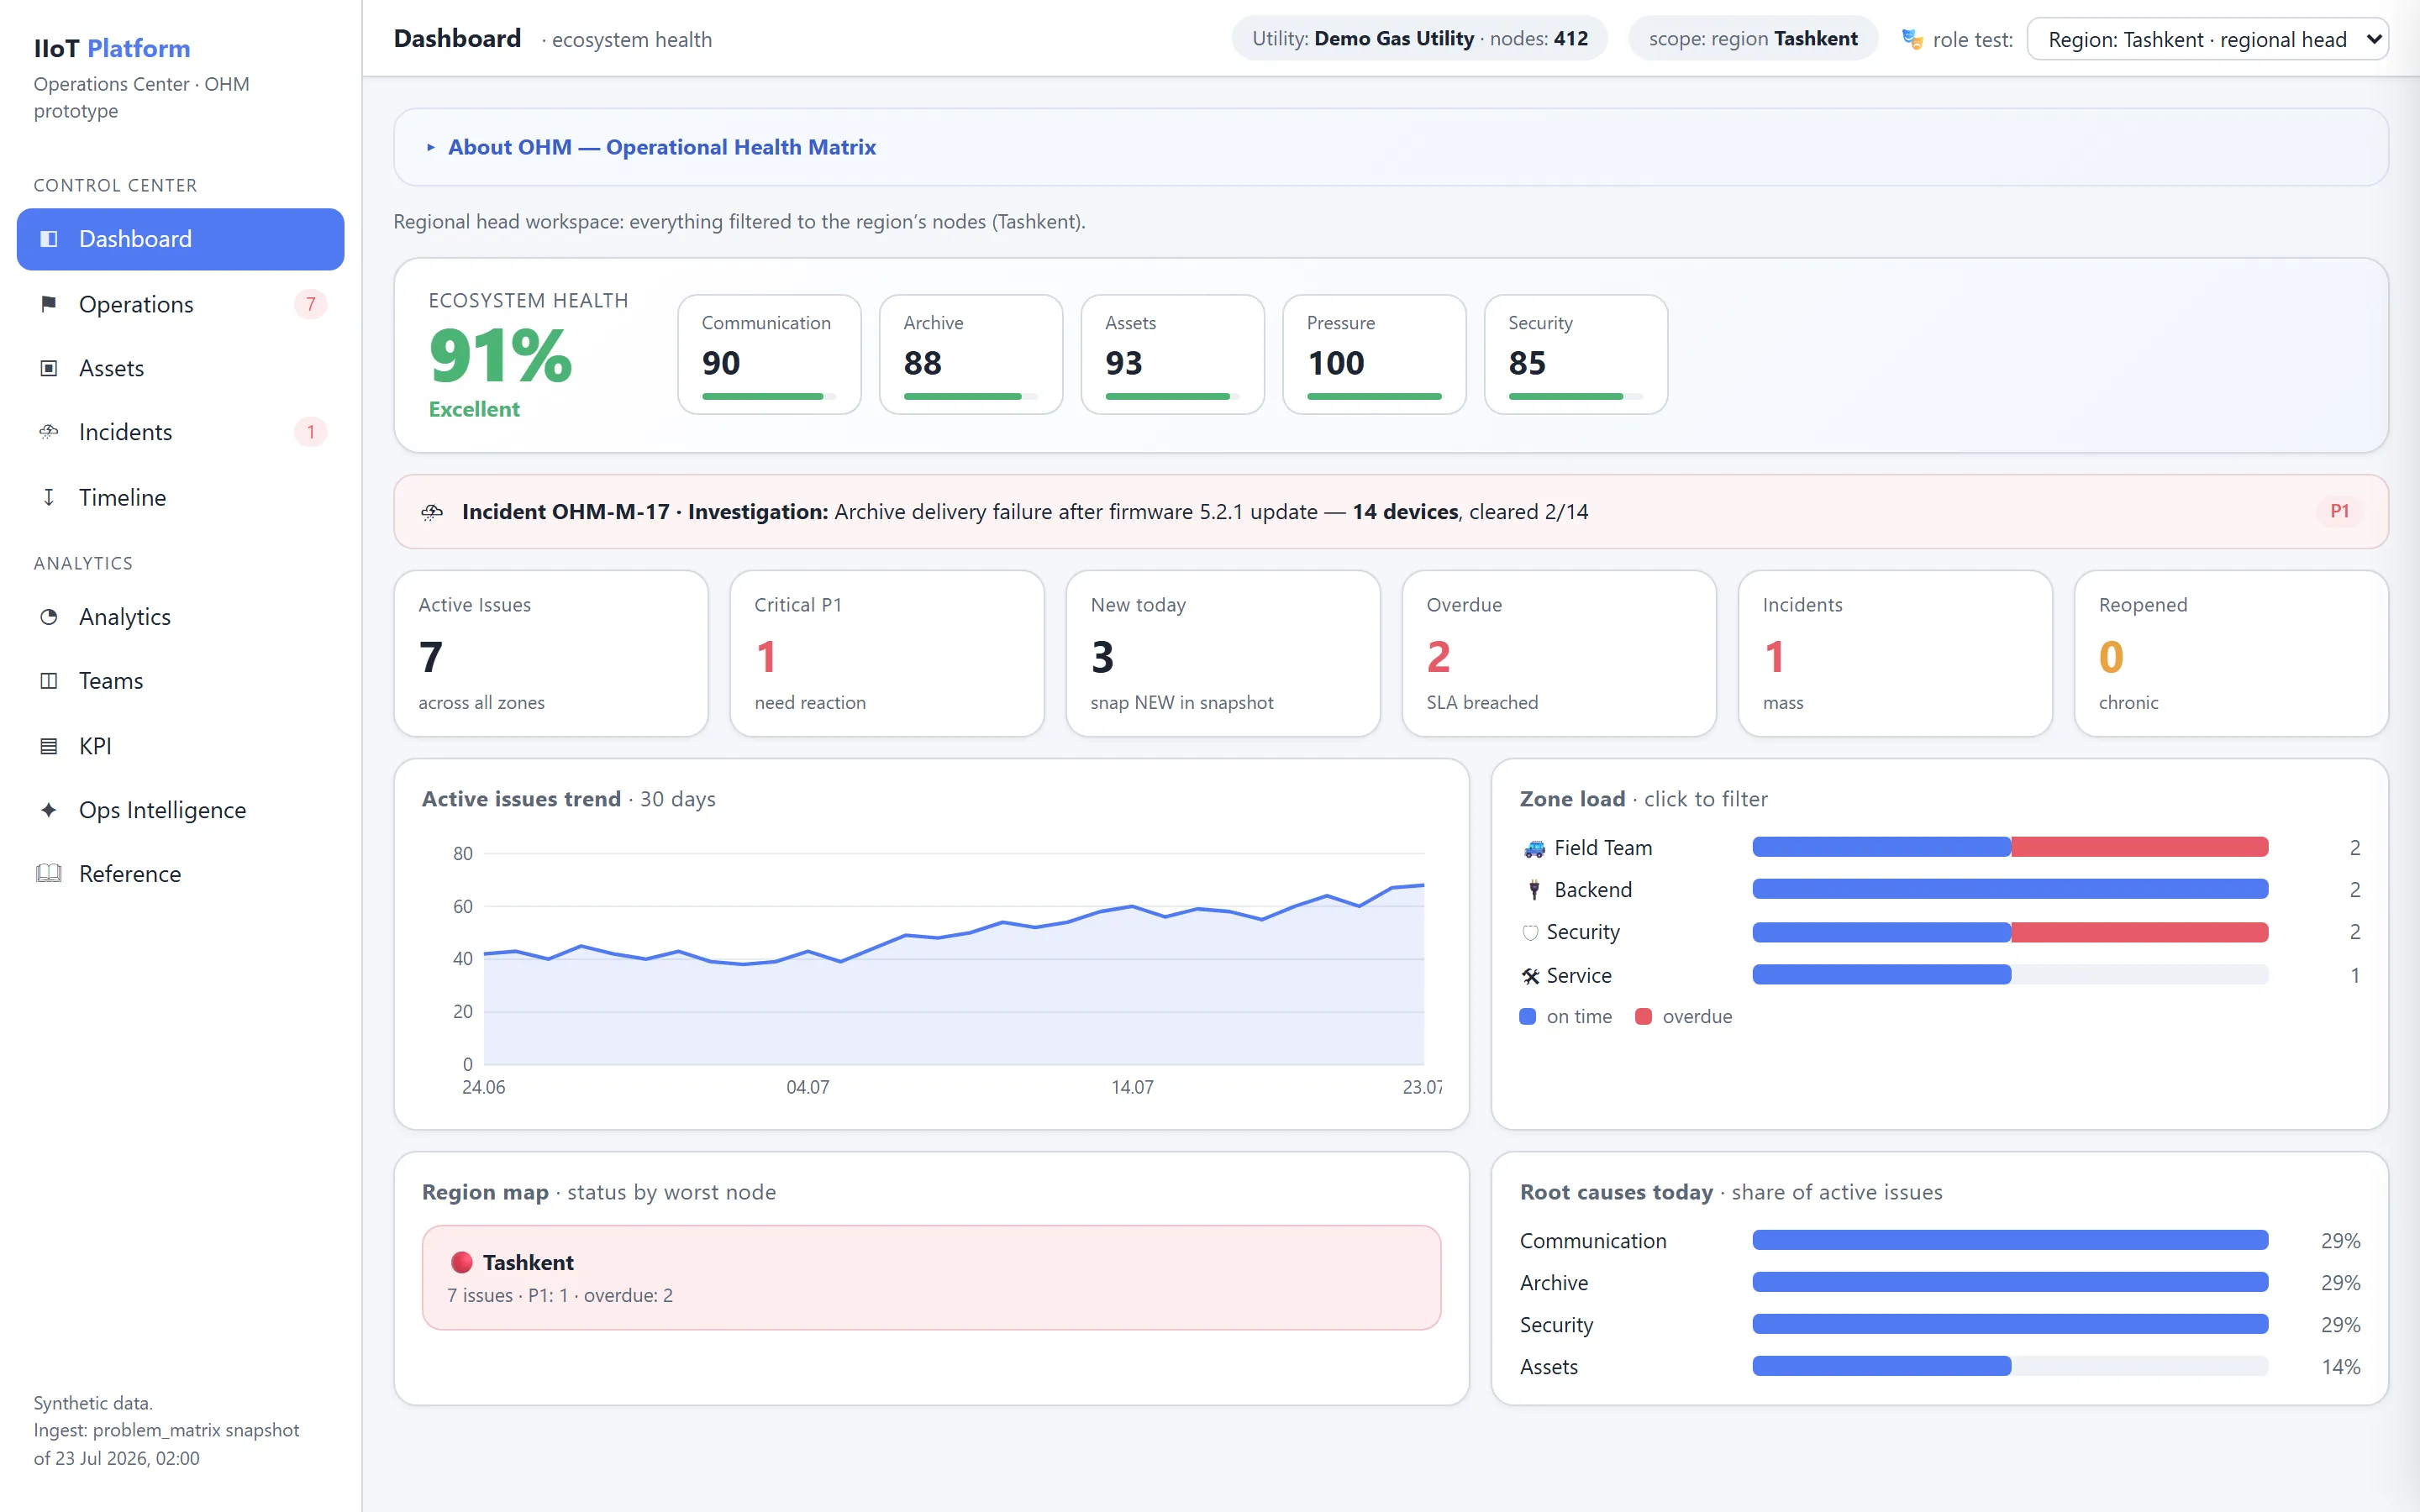
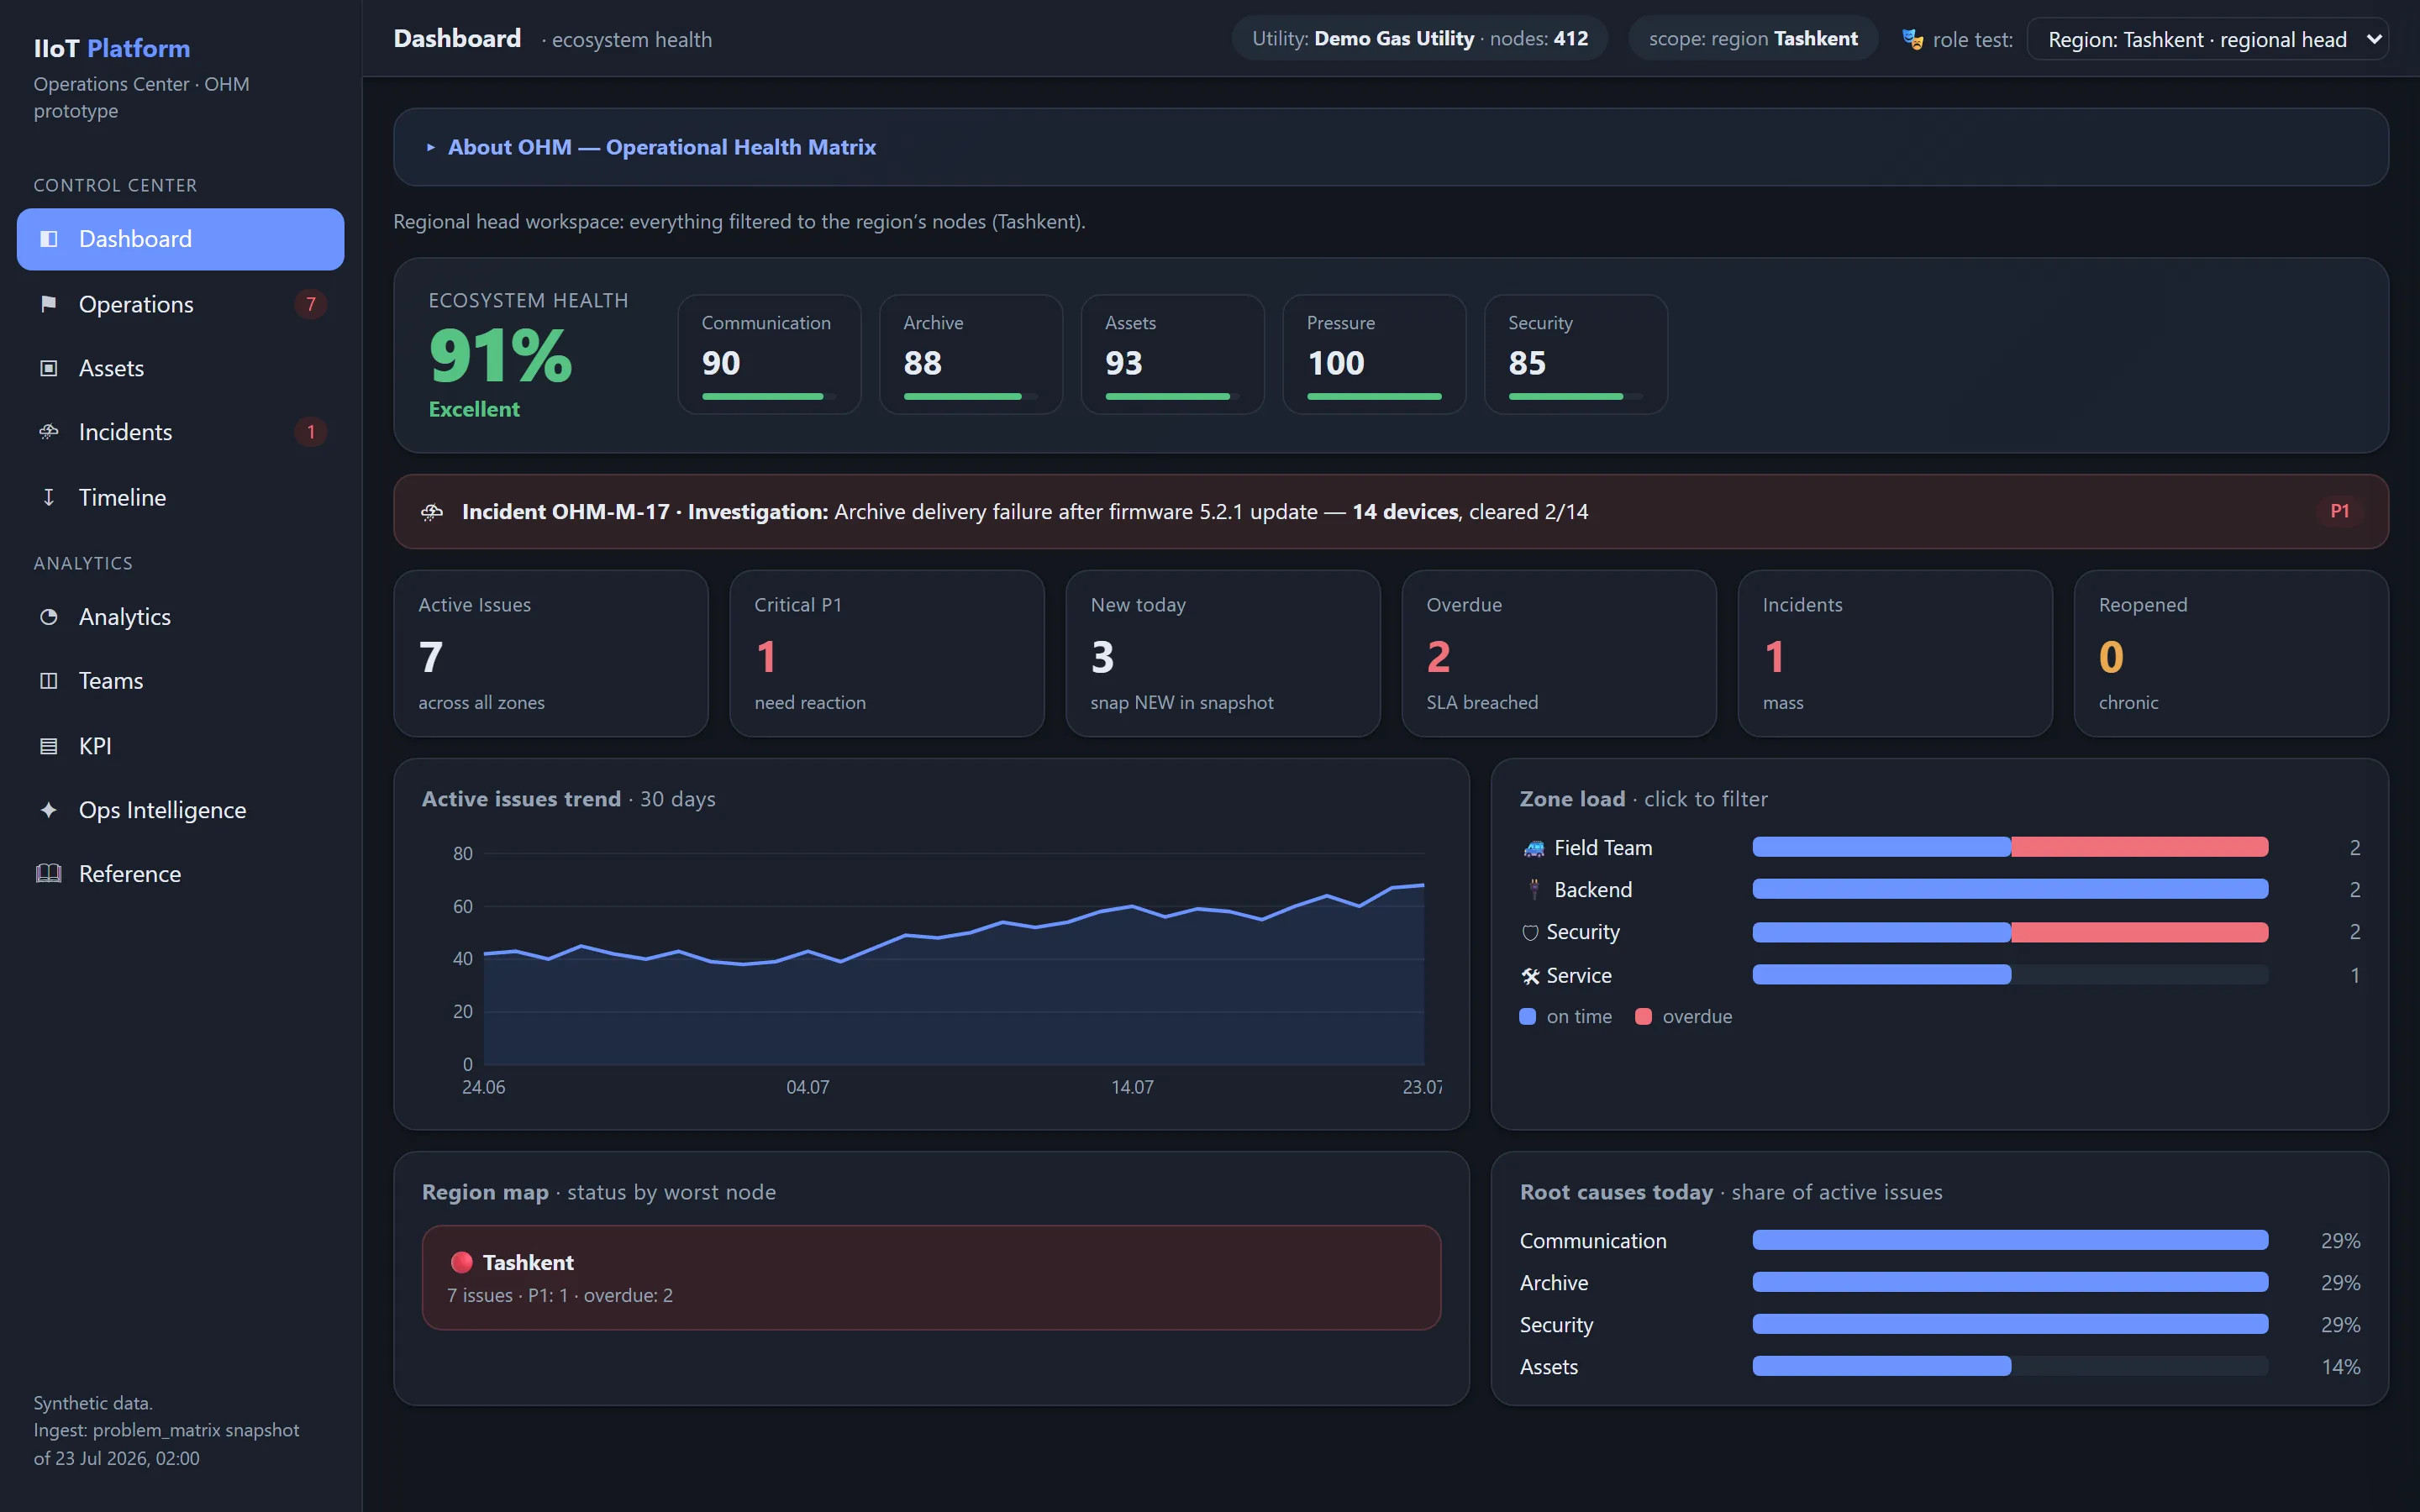
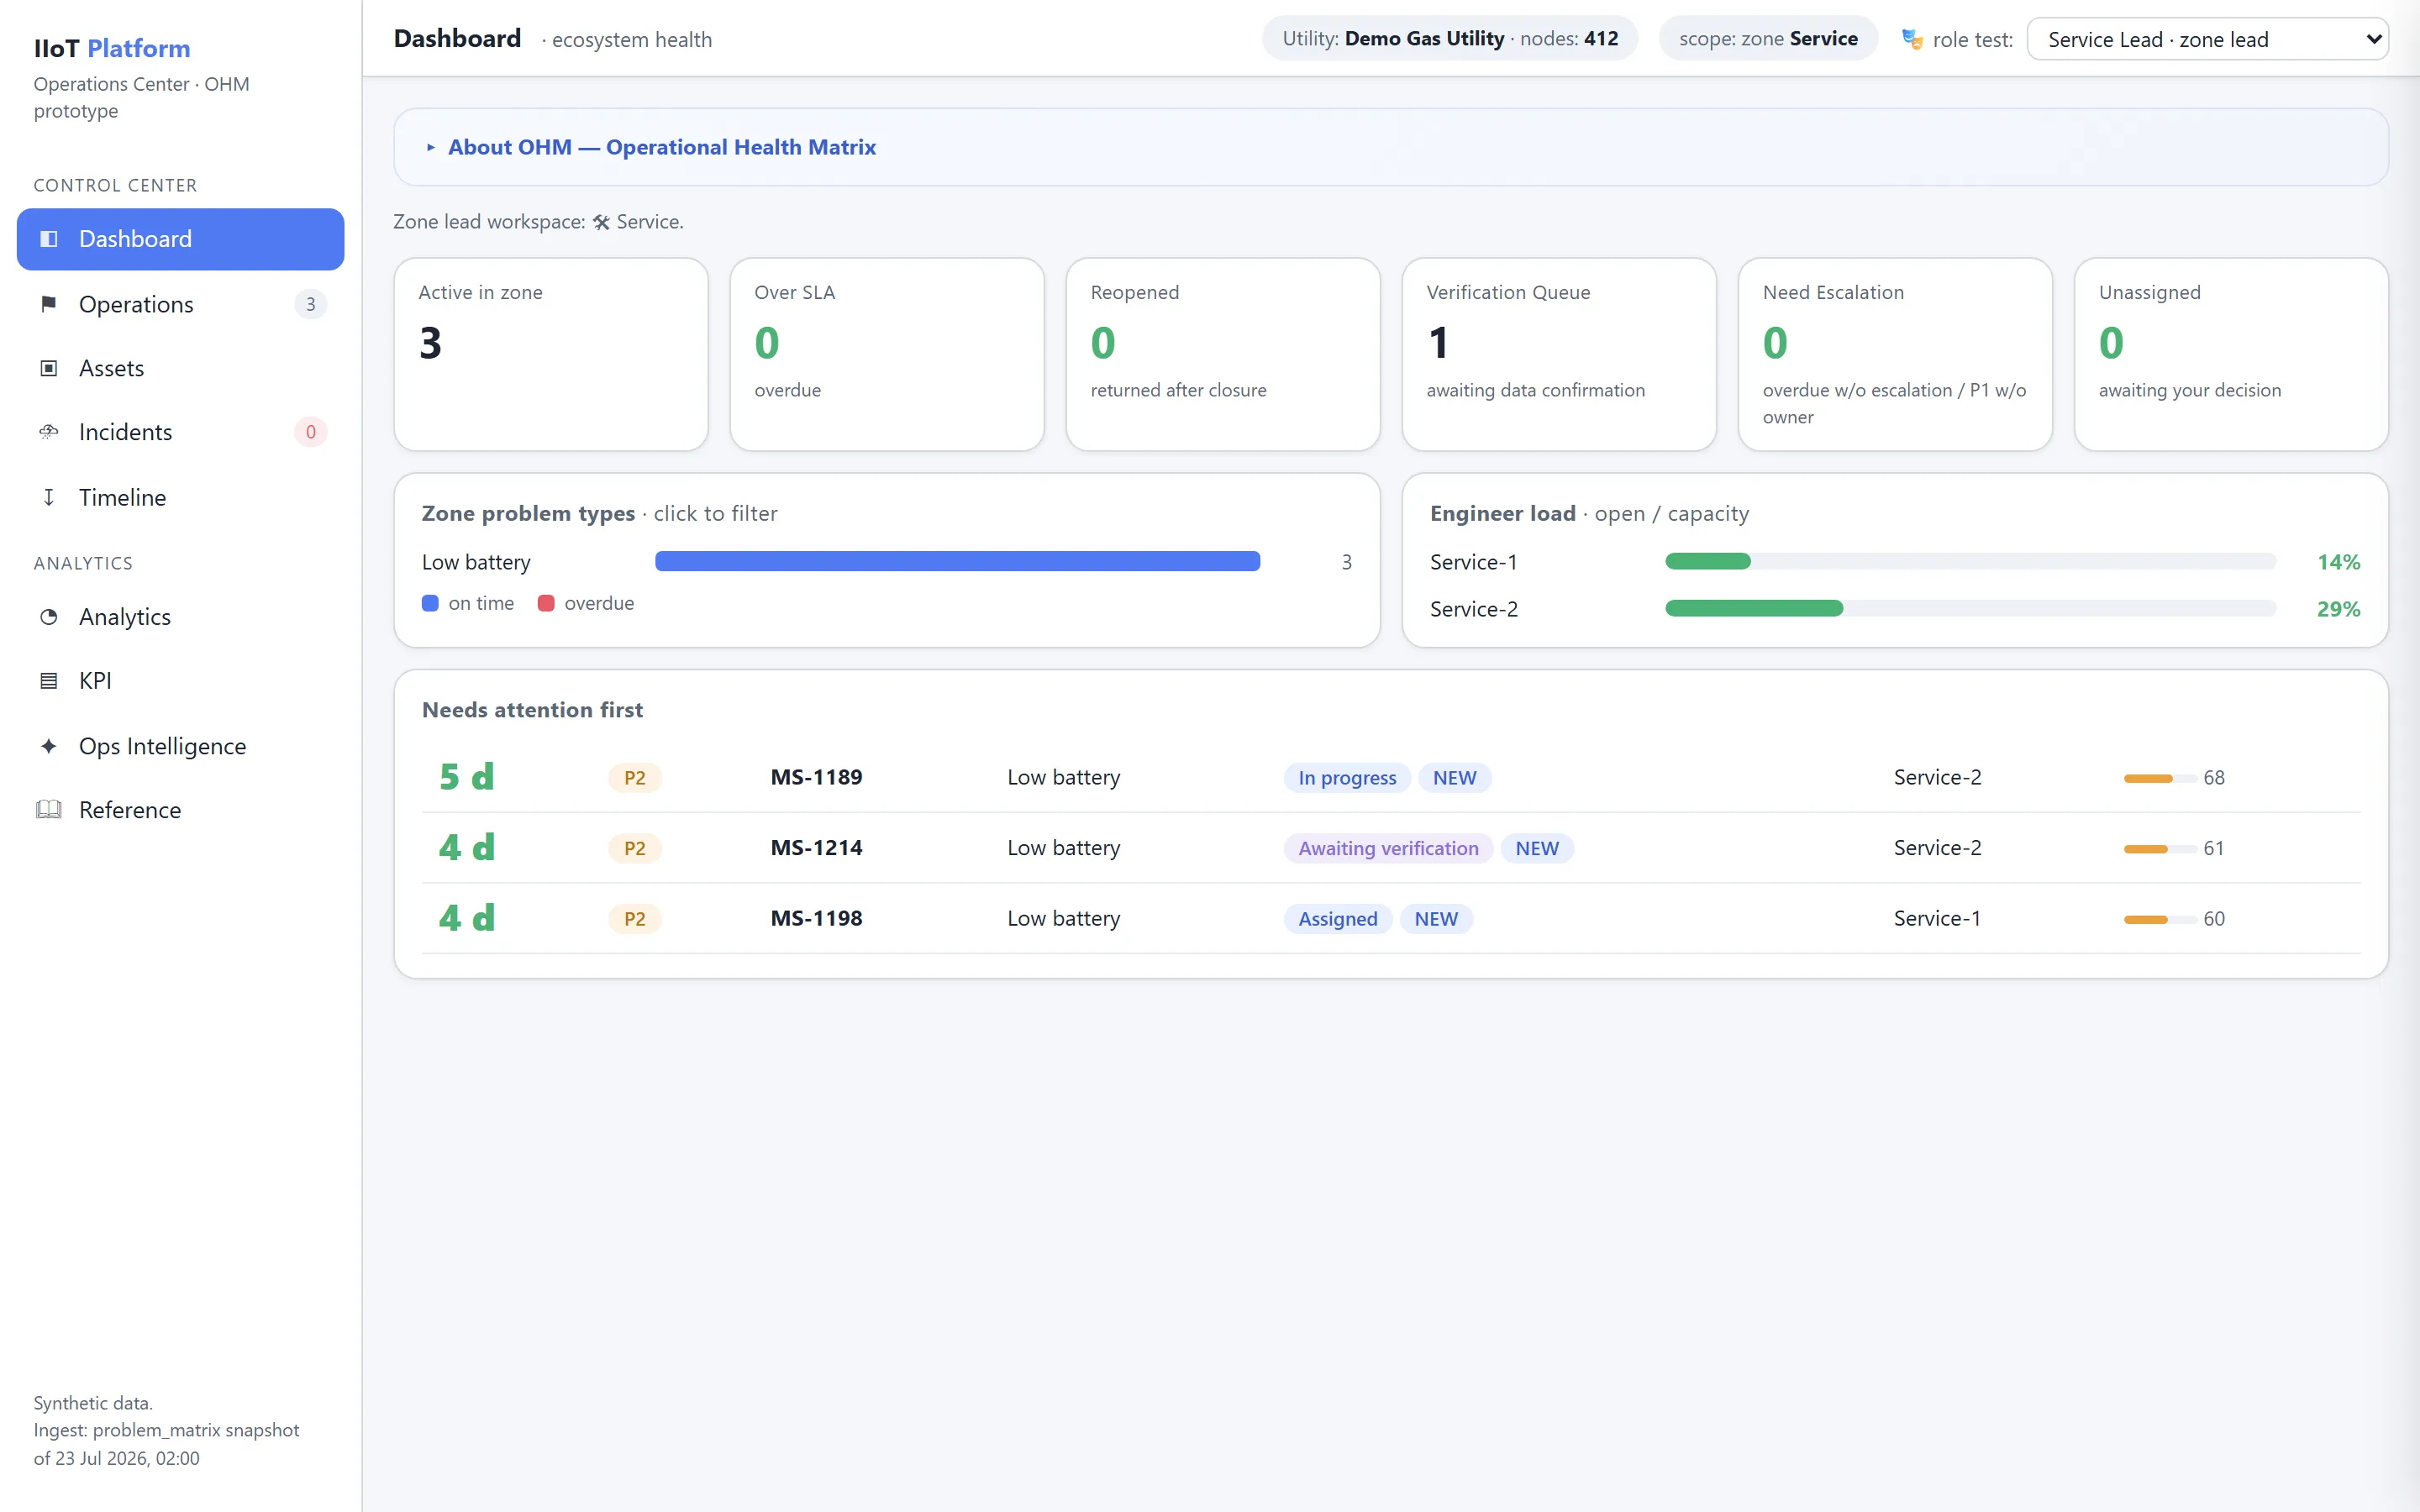
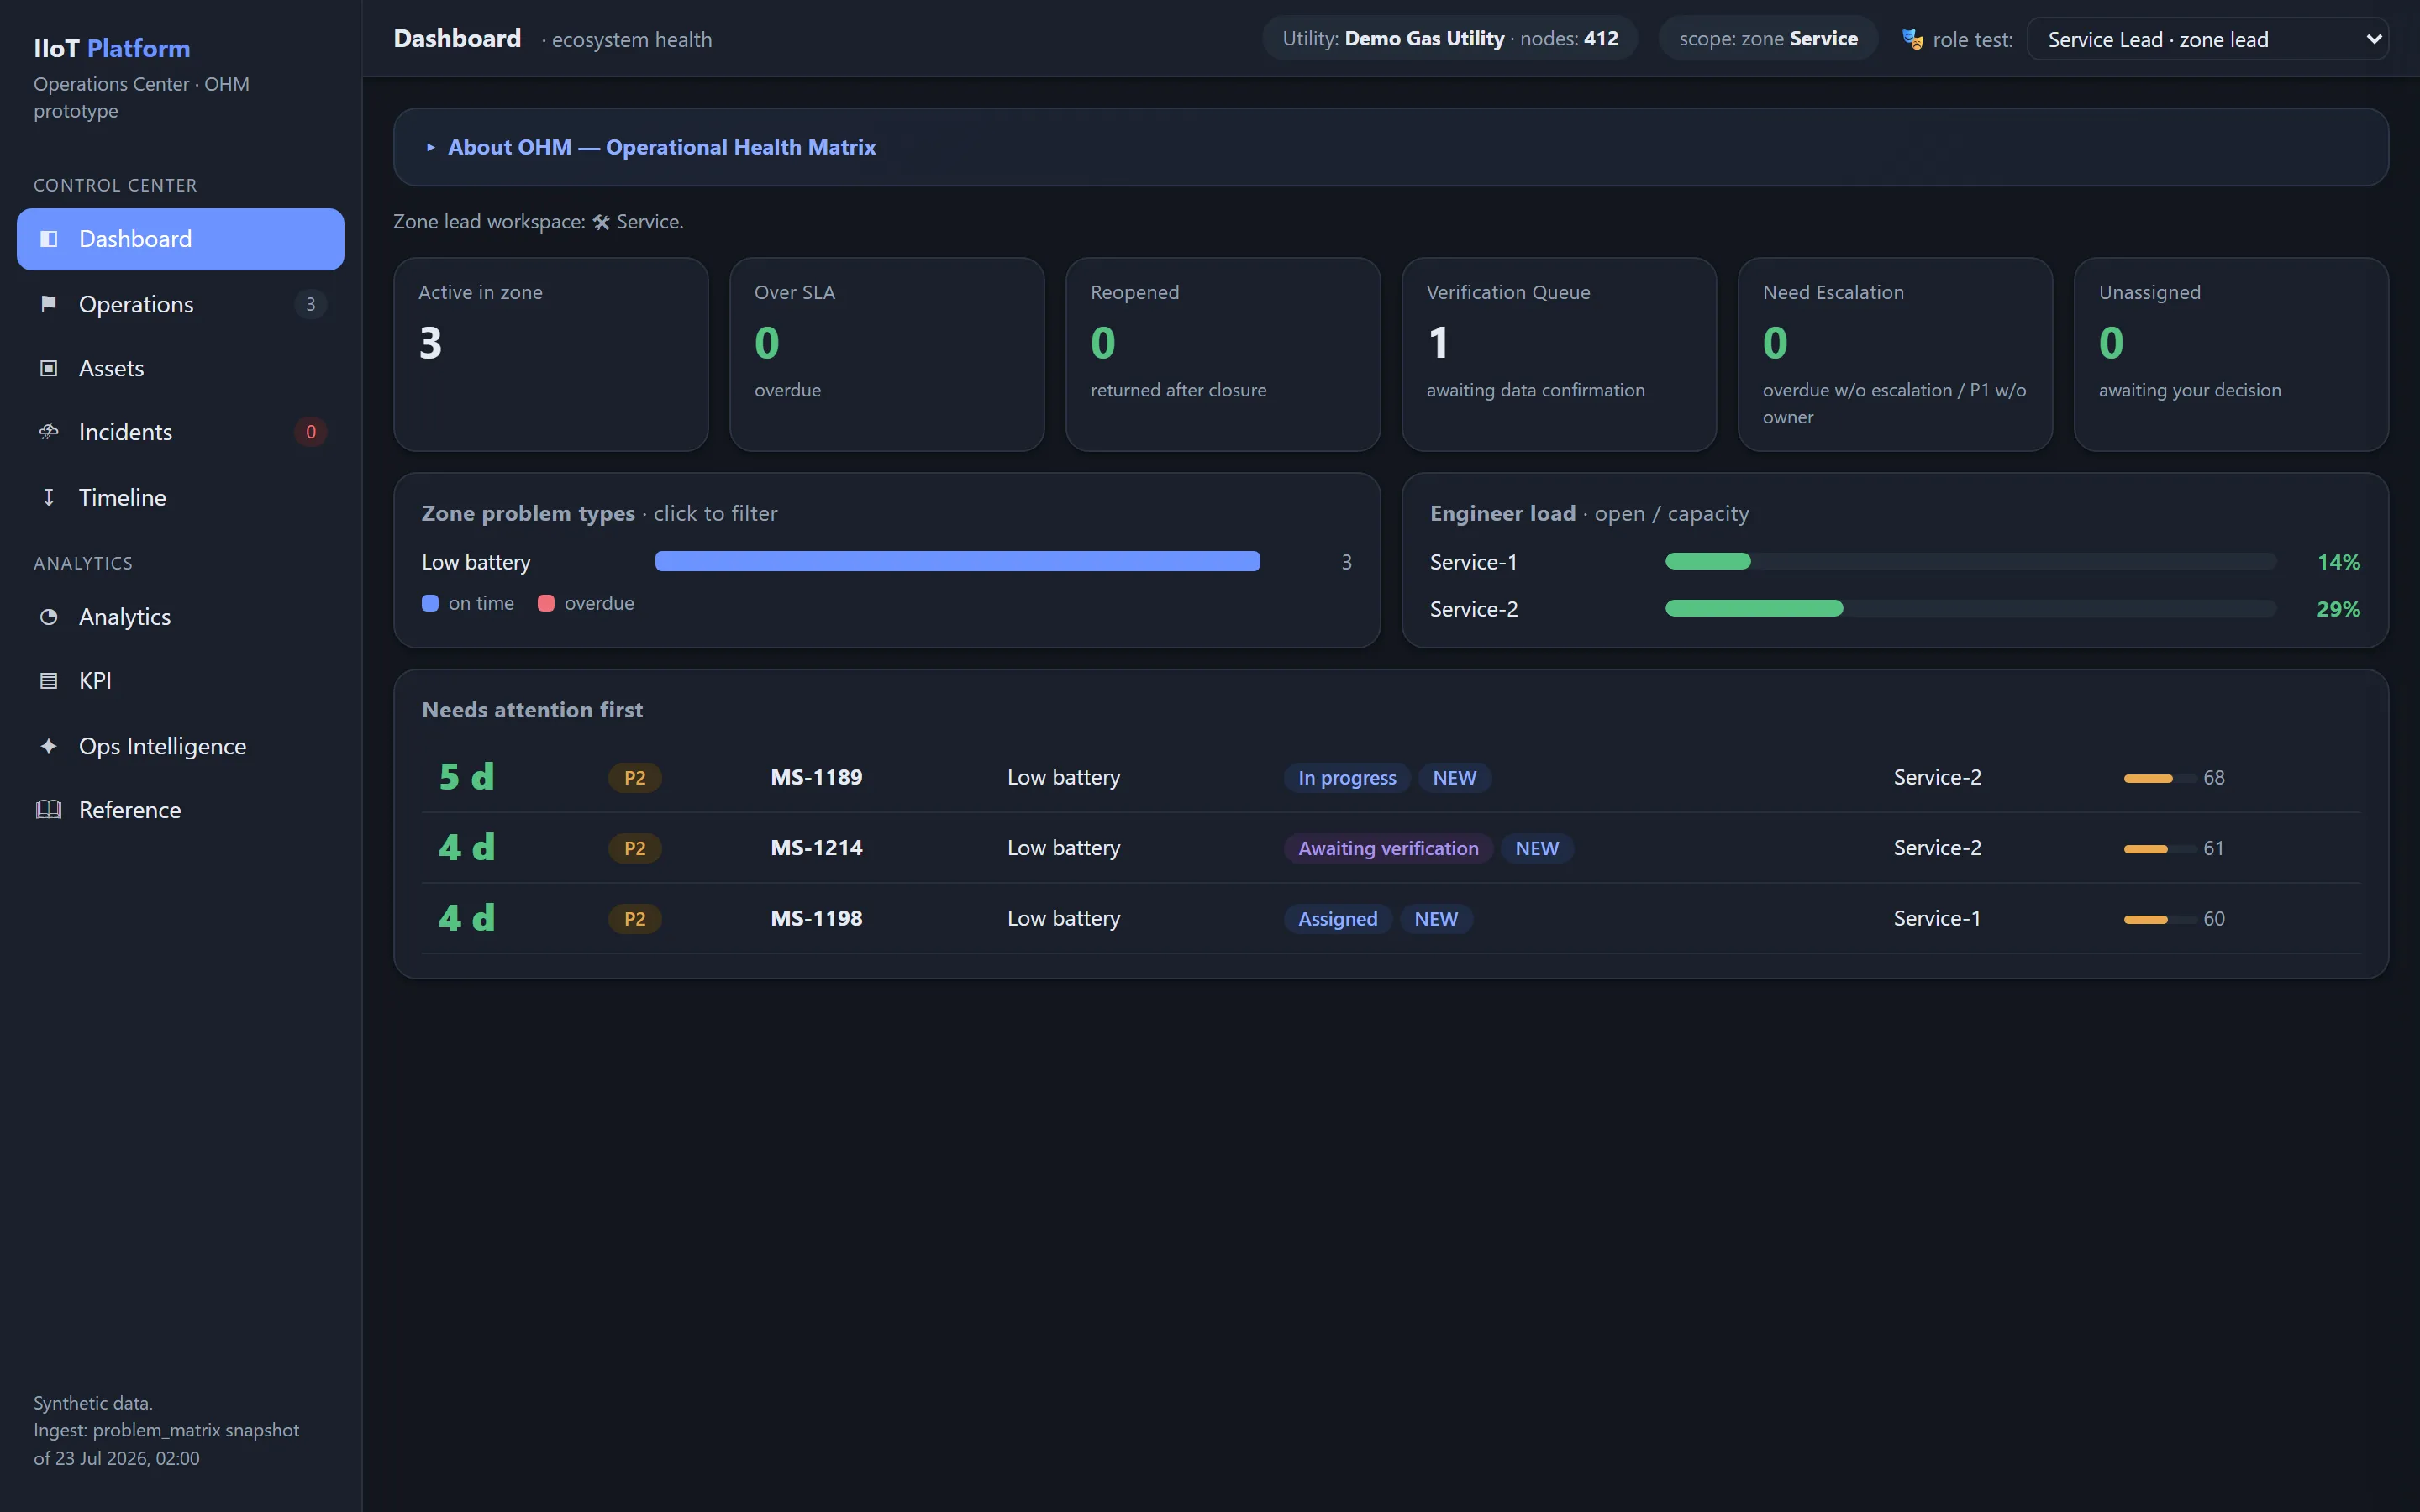
مدير المنطقة
يرى:
- Issues الخاصة بمنطقته؛
- الأعمال غير المُسنَدة؛
- Over SLA؛
- Reopened؛
- Verification Queue؛
- Need Escalation؛
- حِمل عمل المنفّذين؛
- سعة الفريق (capacity)؛
- فعالية الحلول؛
- المشكلات المزمنة؛
- الأسباب الجذرية النمطية (root causes).
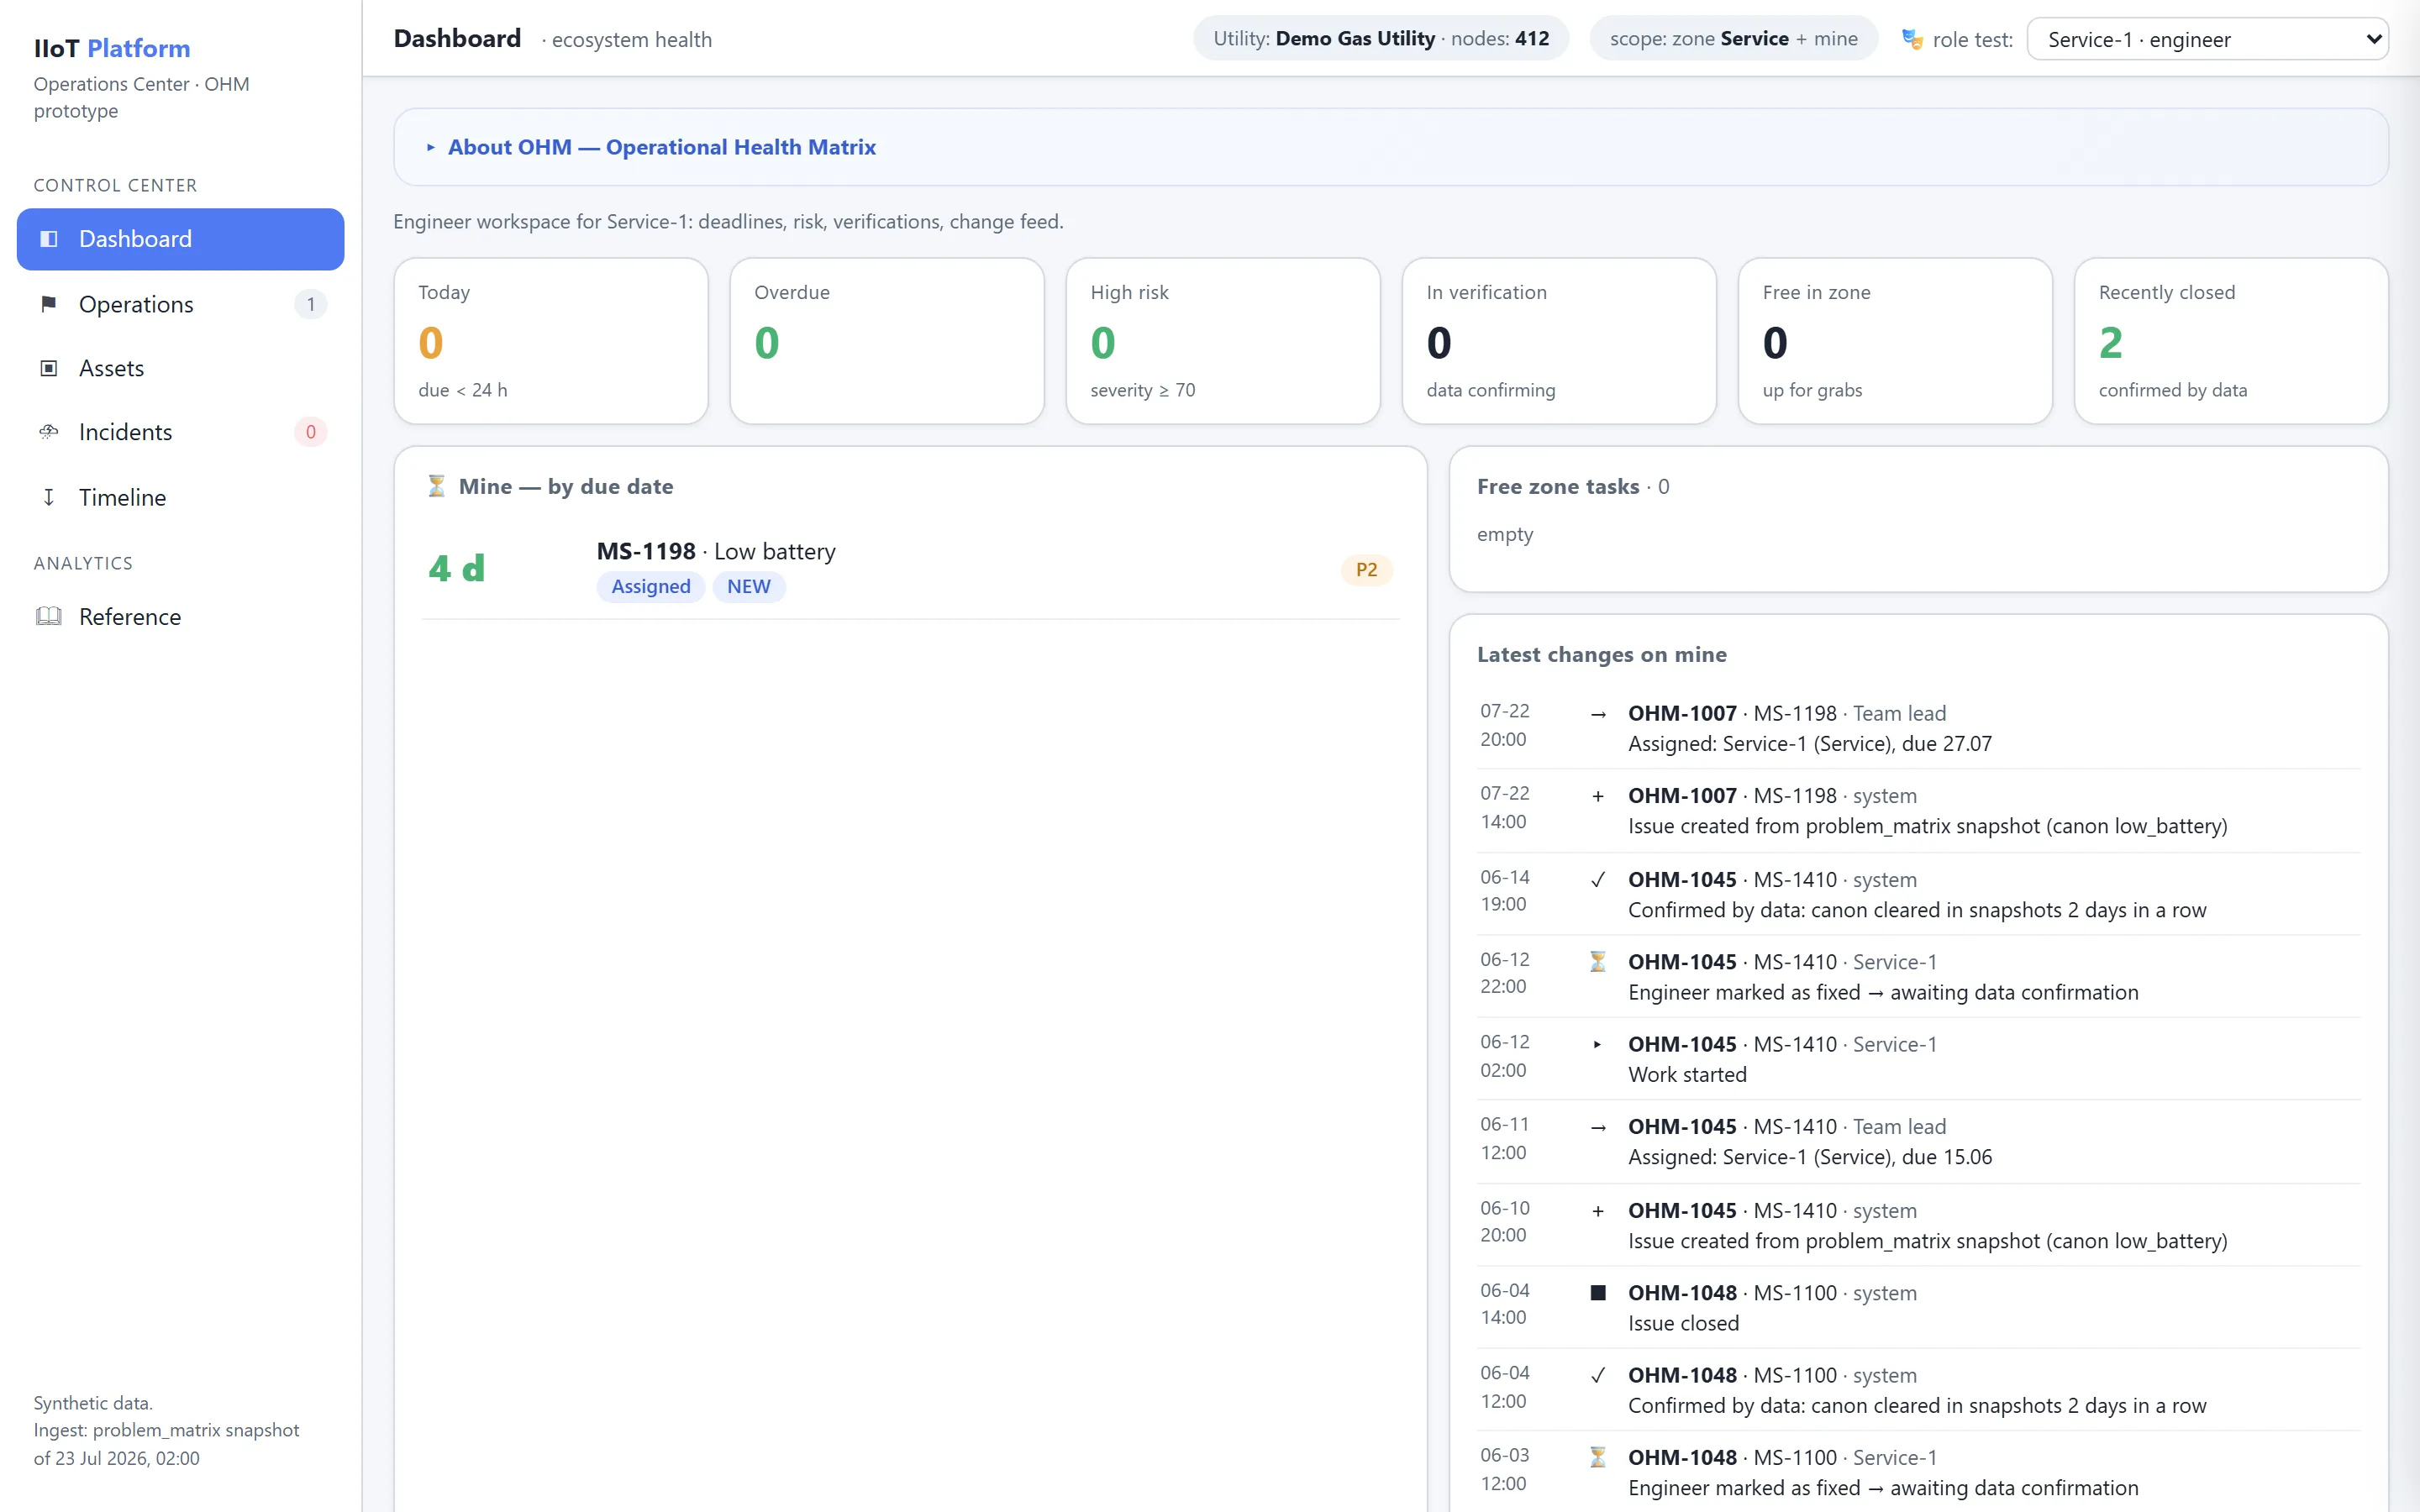
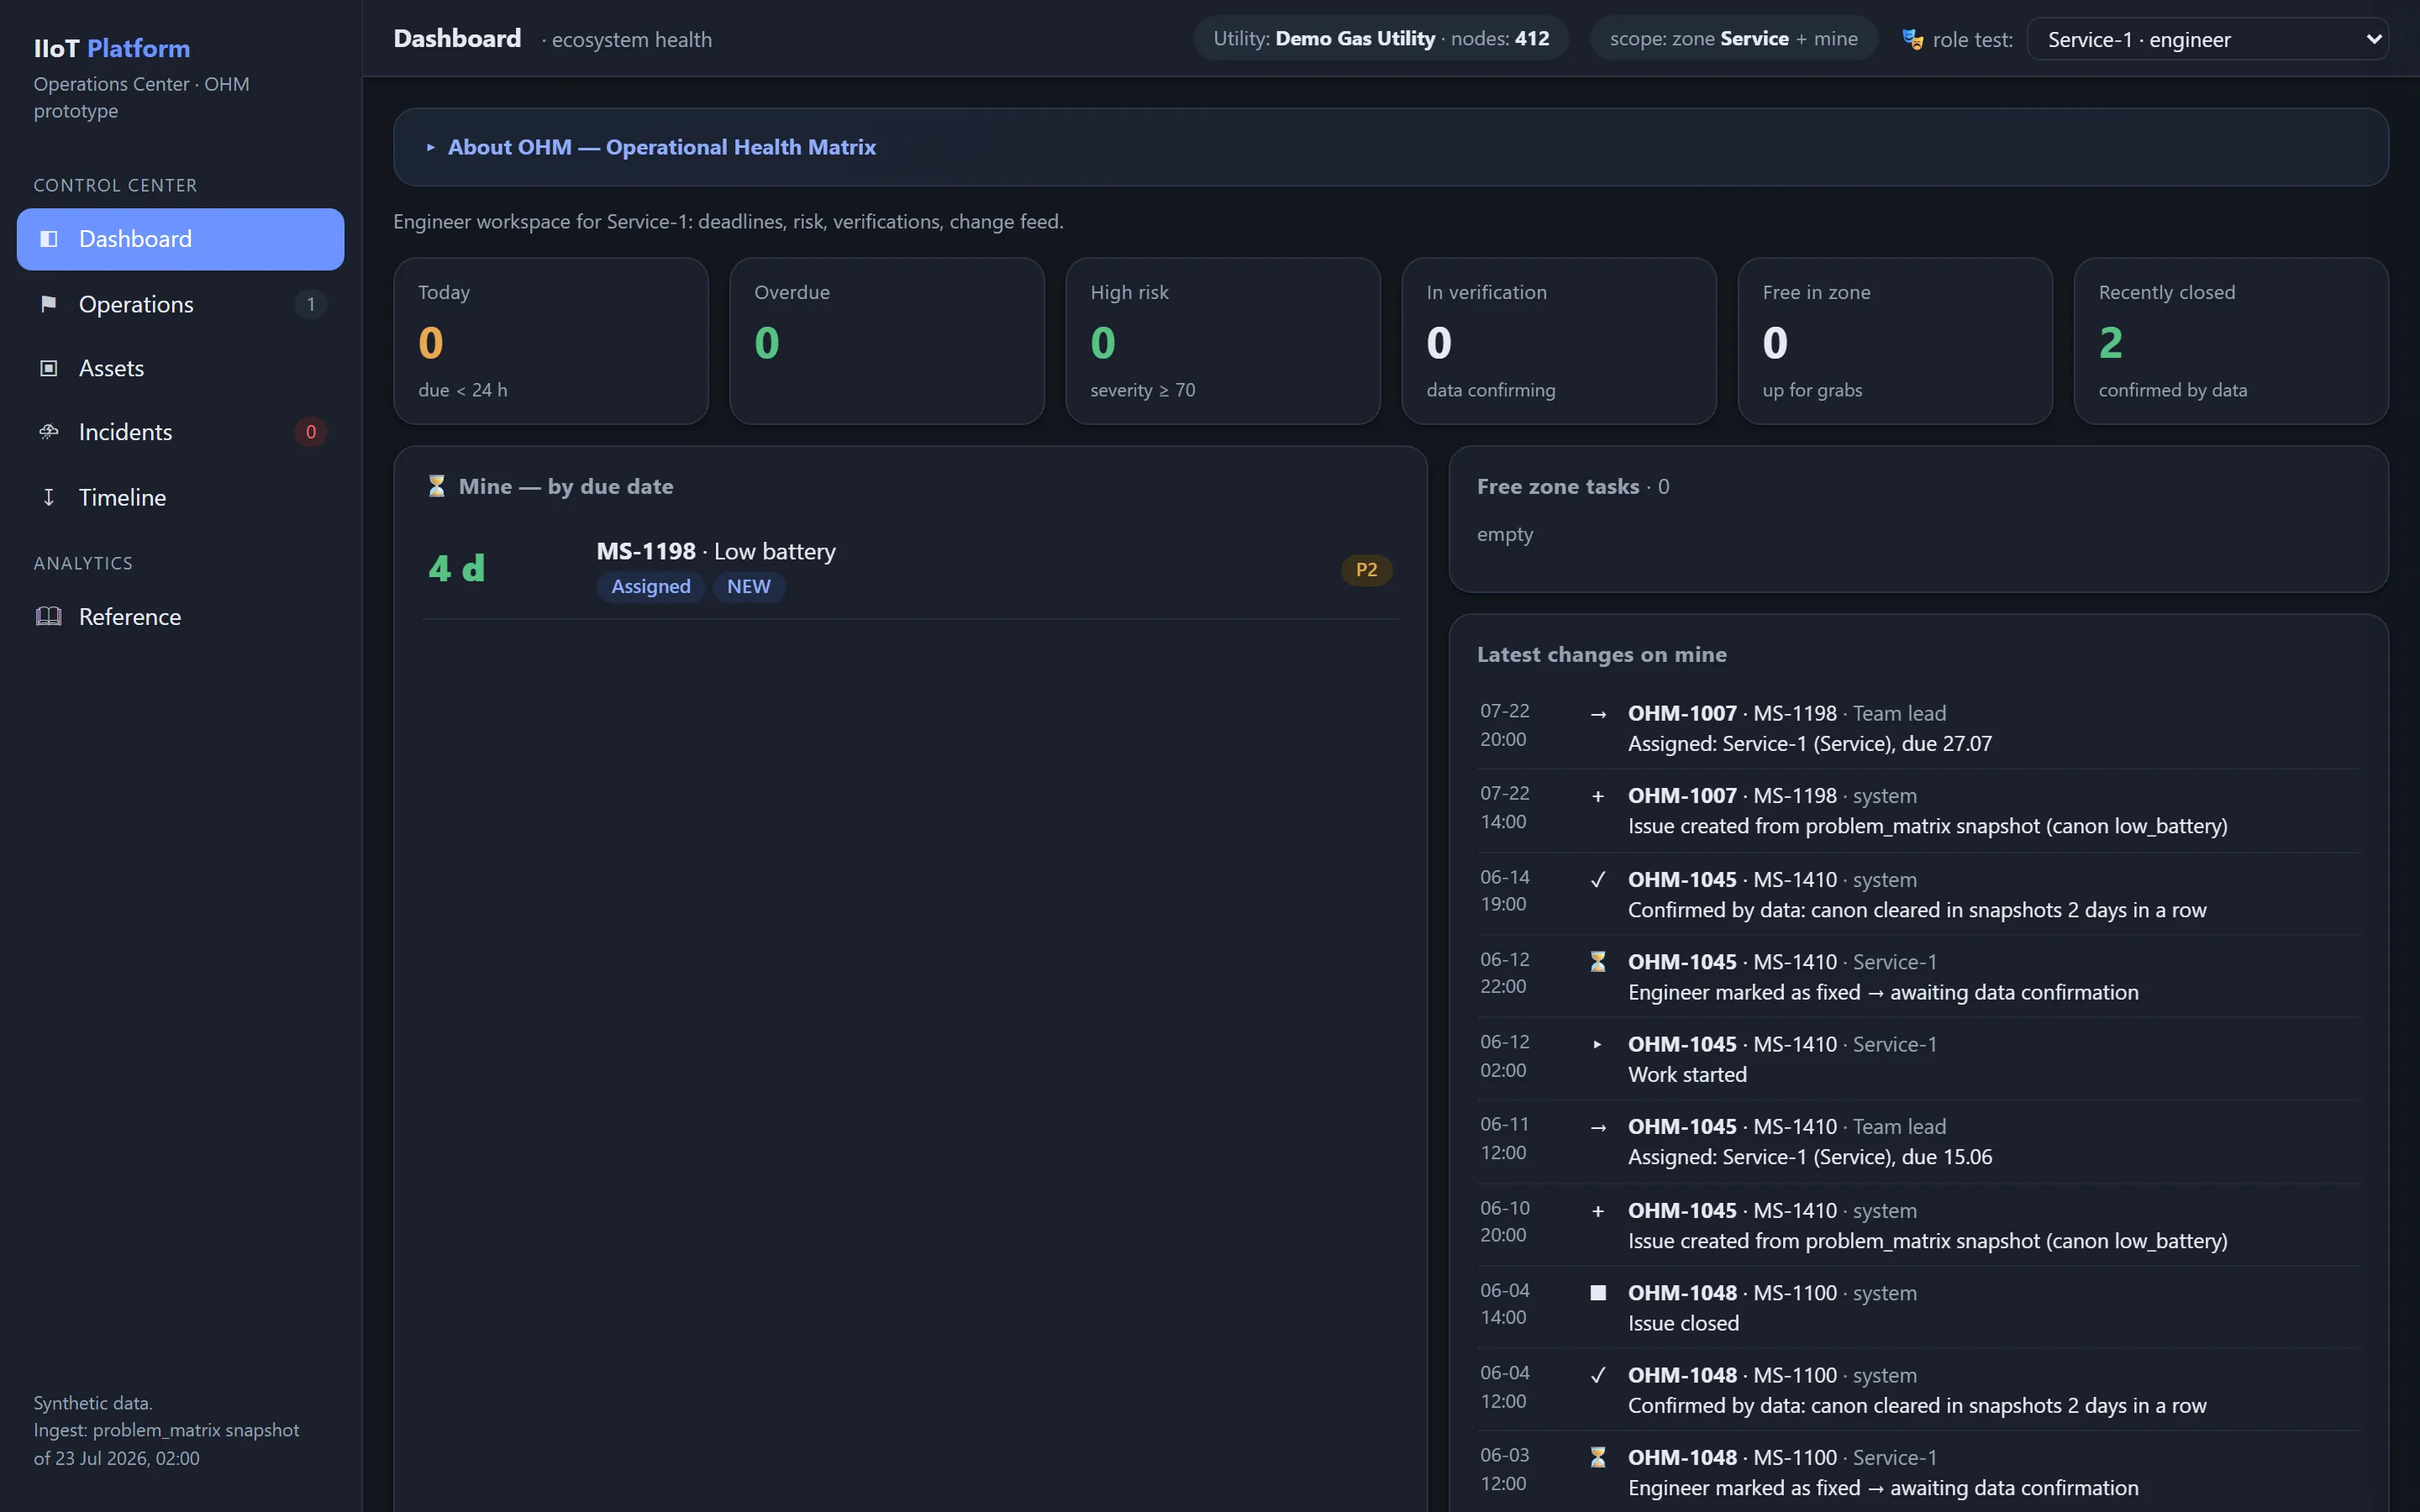
المنفِّذ
يرى:
- مهامّي النشطة؛
- الموعد النهائي و
Due in؛ - المهامّ المتأخّرة؛
- المهامّ عالية المخاطر؛
- المهامّ التي تنتظر التحقّق؛
- التعليقات؛
- آخر التغييرات؛
- مقالات KB المُوصى بها؛
- الحالات المشابهة التي أُغلقت بنجاح.
المترولوجي
يرى إضافةً إلى ذلك:
- مشكلات الـ passport؛
- الاتّساق الفيزيائي للبيانات؛
- شذوذ المستشعرات؛
- التحقّق من الإجراءات المترولوجية؛
- Evidence المستمدّة من التقارير المتخصّصة؛
- سجلّ الاستبدالات وعمليات المعايرة.
دور خدمة الأمن
يرى السياق المسموح به فقط:
- إشارات السلامة (Integrity)؛
- الإجراءات الشاذّة؛
- تغييرات التهيئة؛
- الحوادث الأمنية المؤكَّدة؛
- سجلّ الوصول؛
- سلسلة Evidence.
تُقيَّد البيانات الحسّاسة وEvidence التحليل الجنائي الرقمي بسياسات الوصول.
الشاشات الأساسية
لوحة المعلومات (Dashboard)
تعرض Dashboard صحّة المنظومة والسياق التشغيلي:
- Overall Health Score؛
- Communication Health؛
- Archive Health؛
- Asset Health؛
- Pressure Health؛
- Security Health؛
- Critical Issues؛
- New Today؛
- Overdue؛
- Massive Incidents؛
- SLA Violations؛
- Root Cause Distribution؛
- خريطة الأقاليم؛
- الاتجاه؛
- Operations Feed.
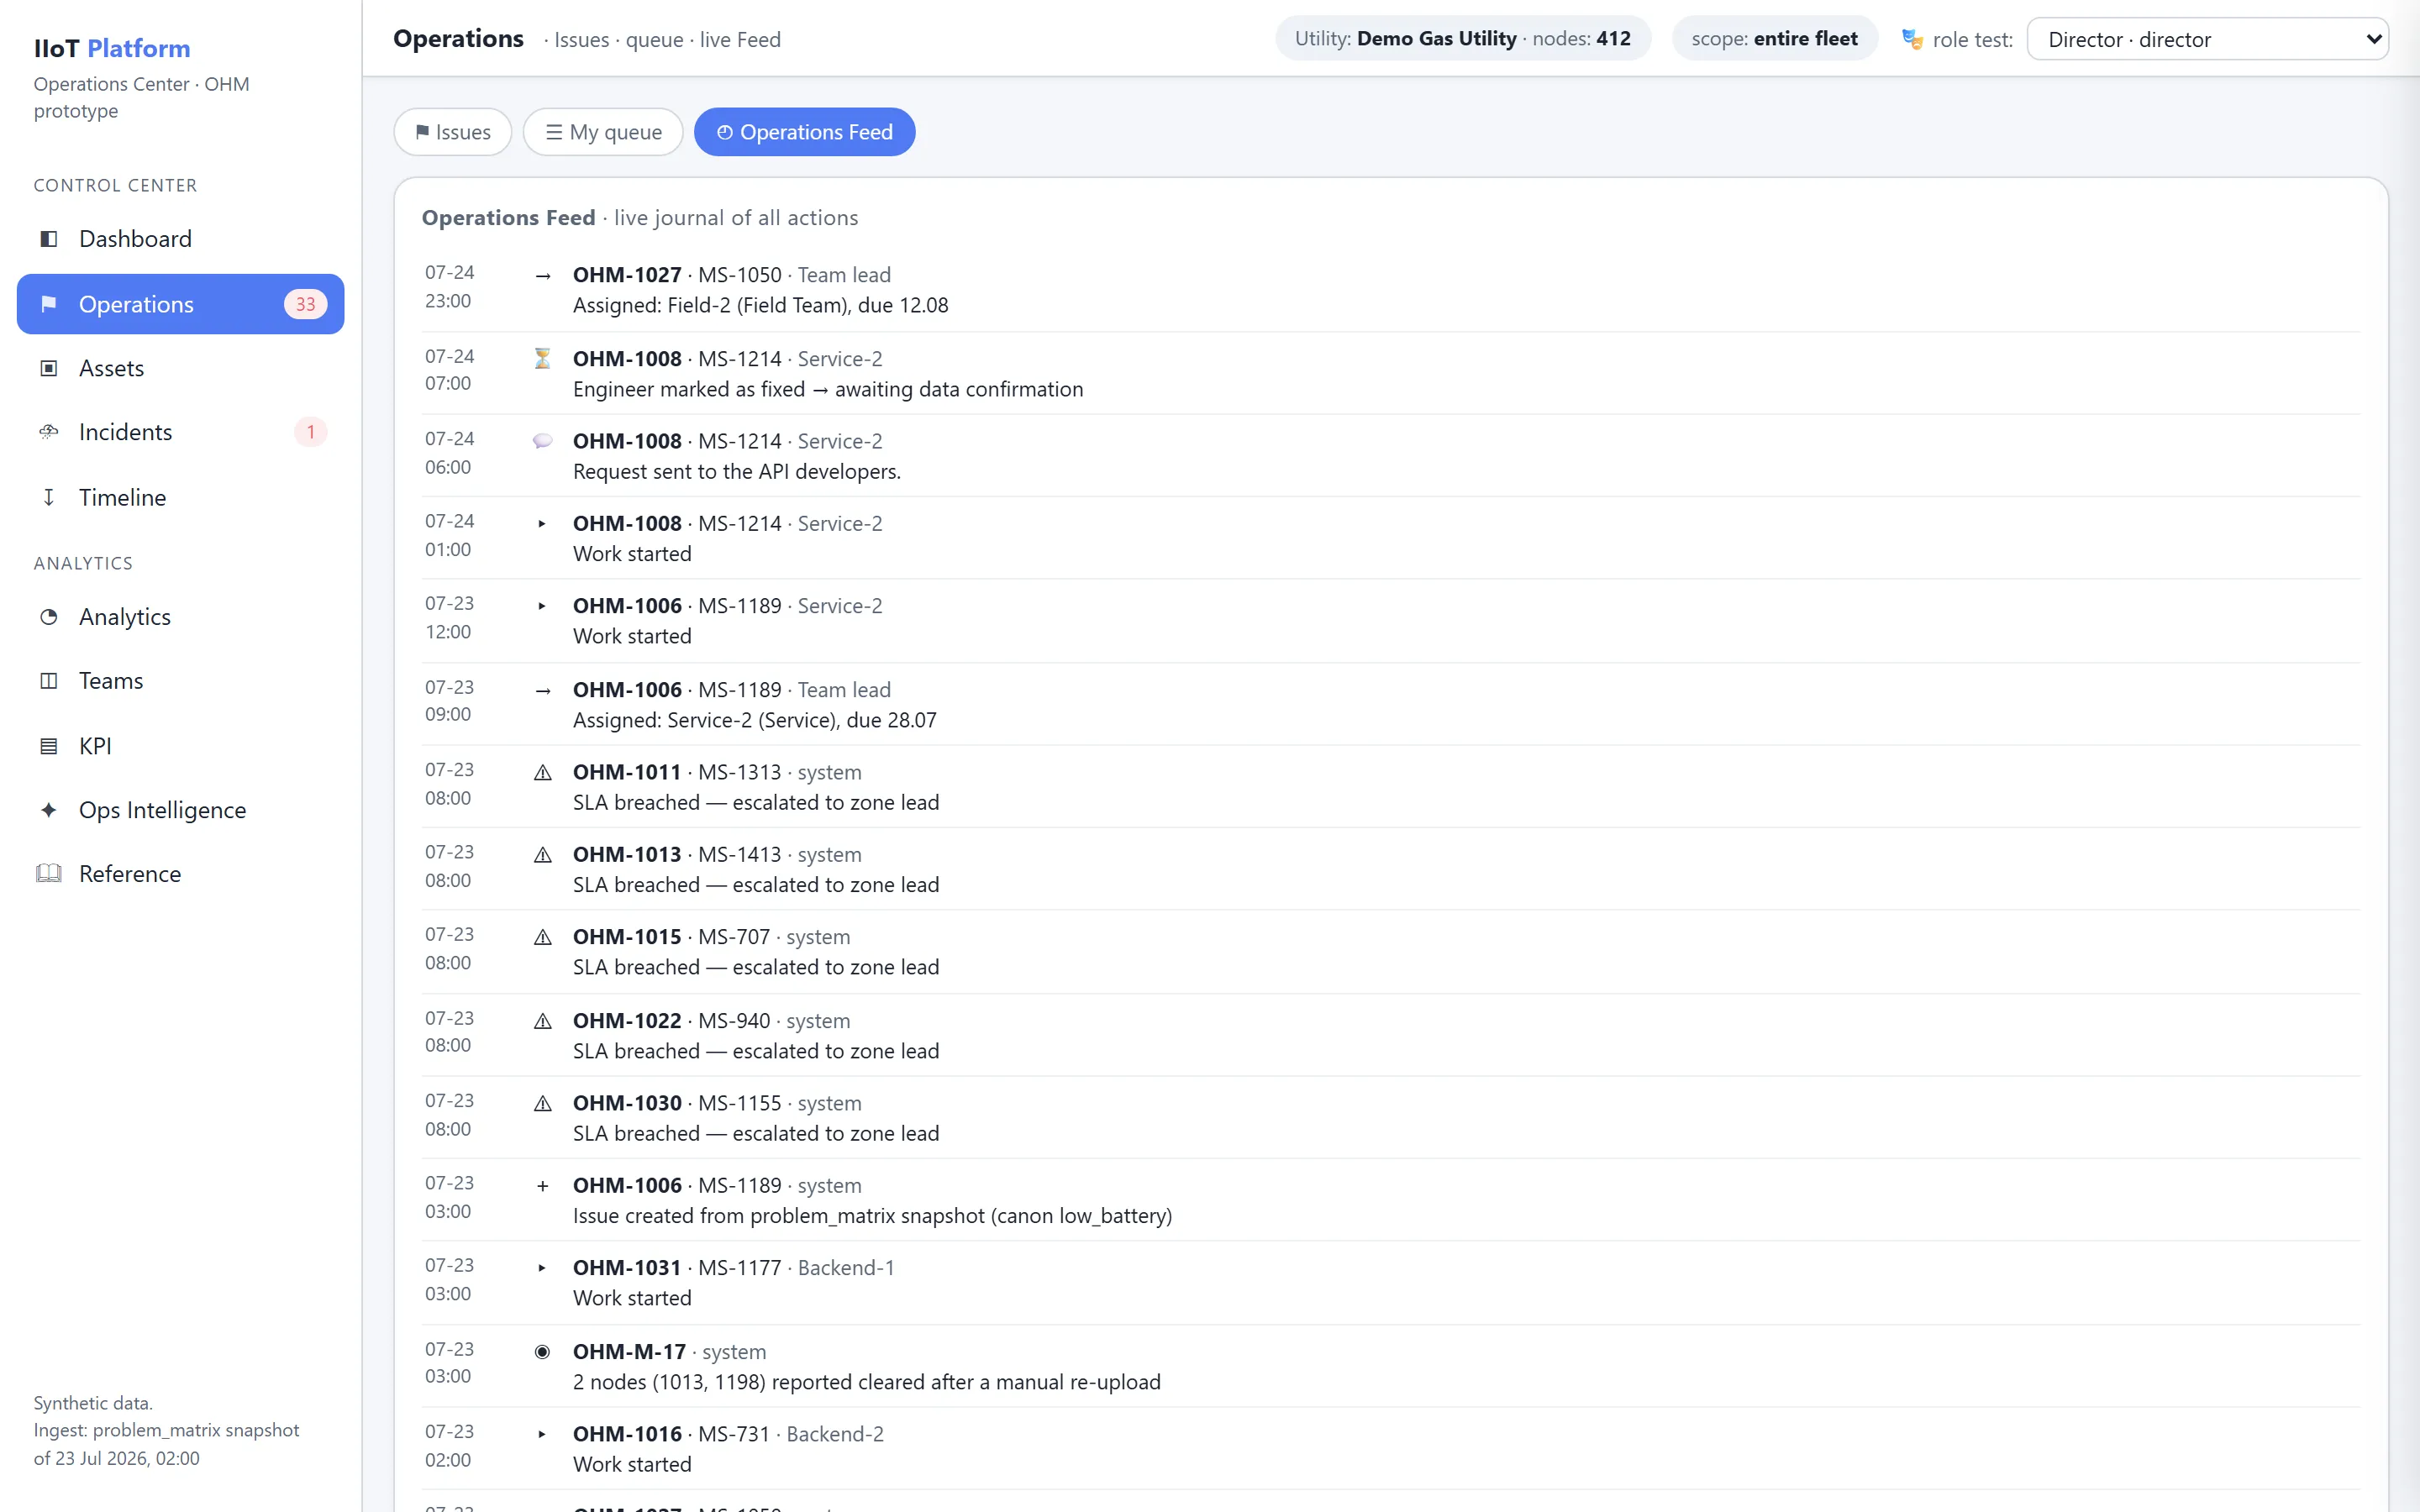
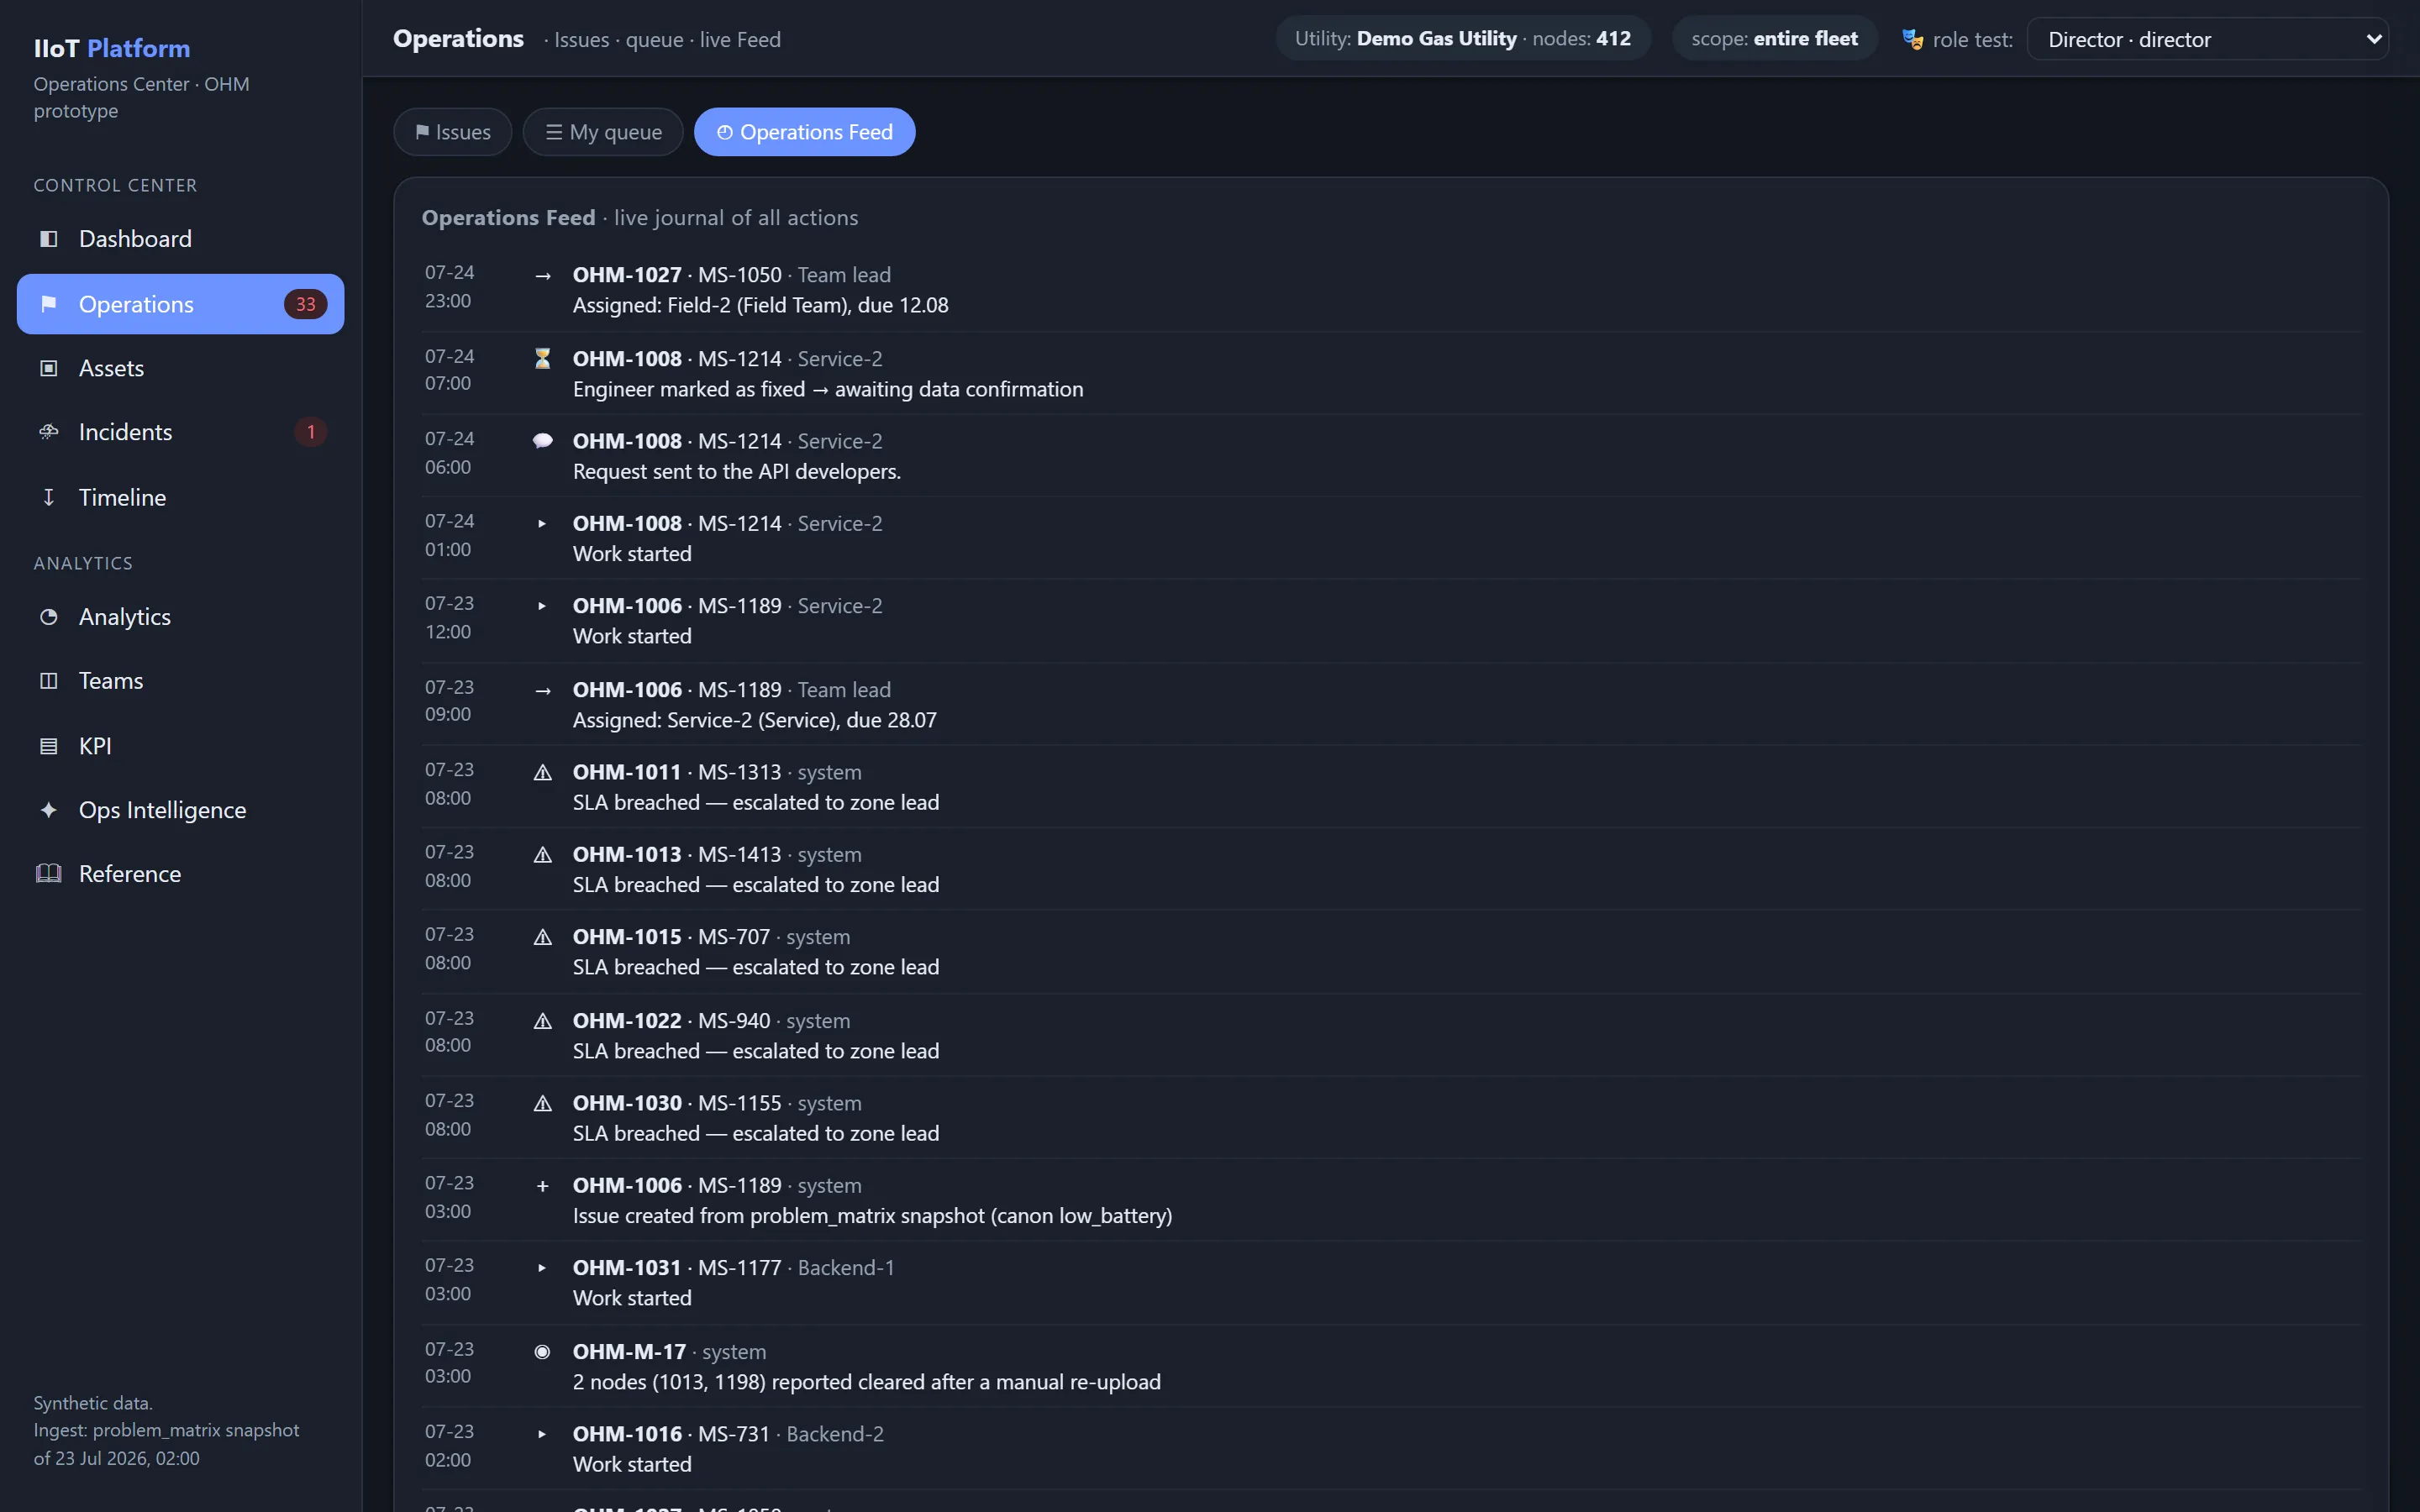
العمليات (Operations)
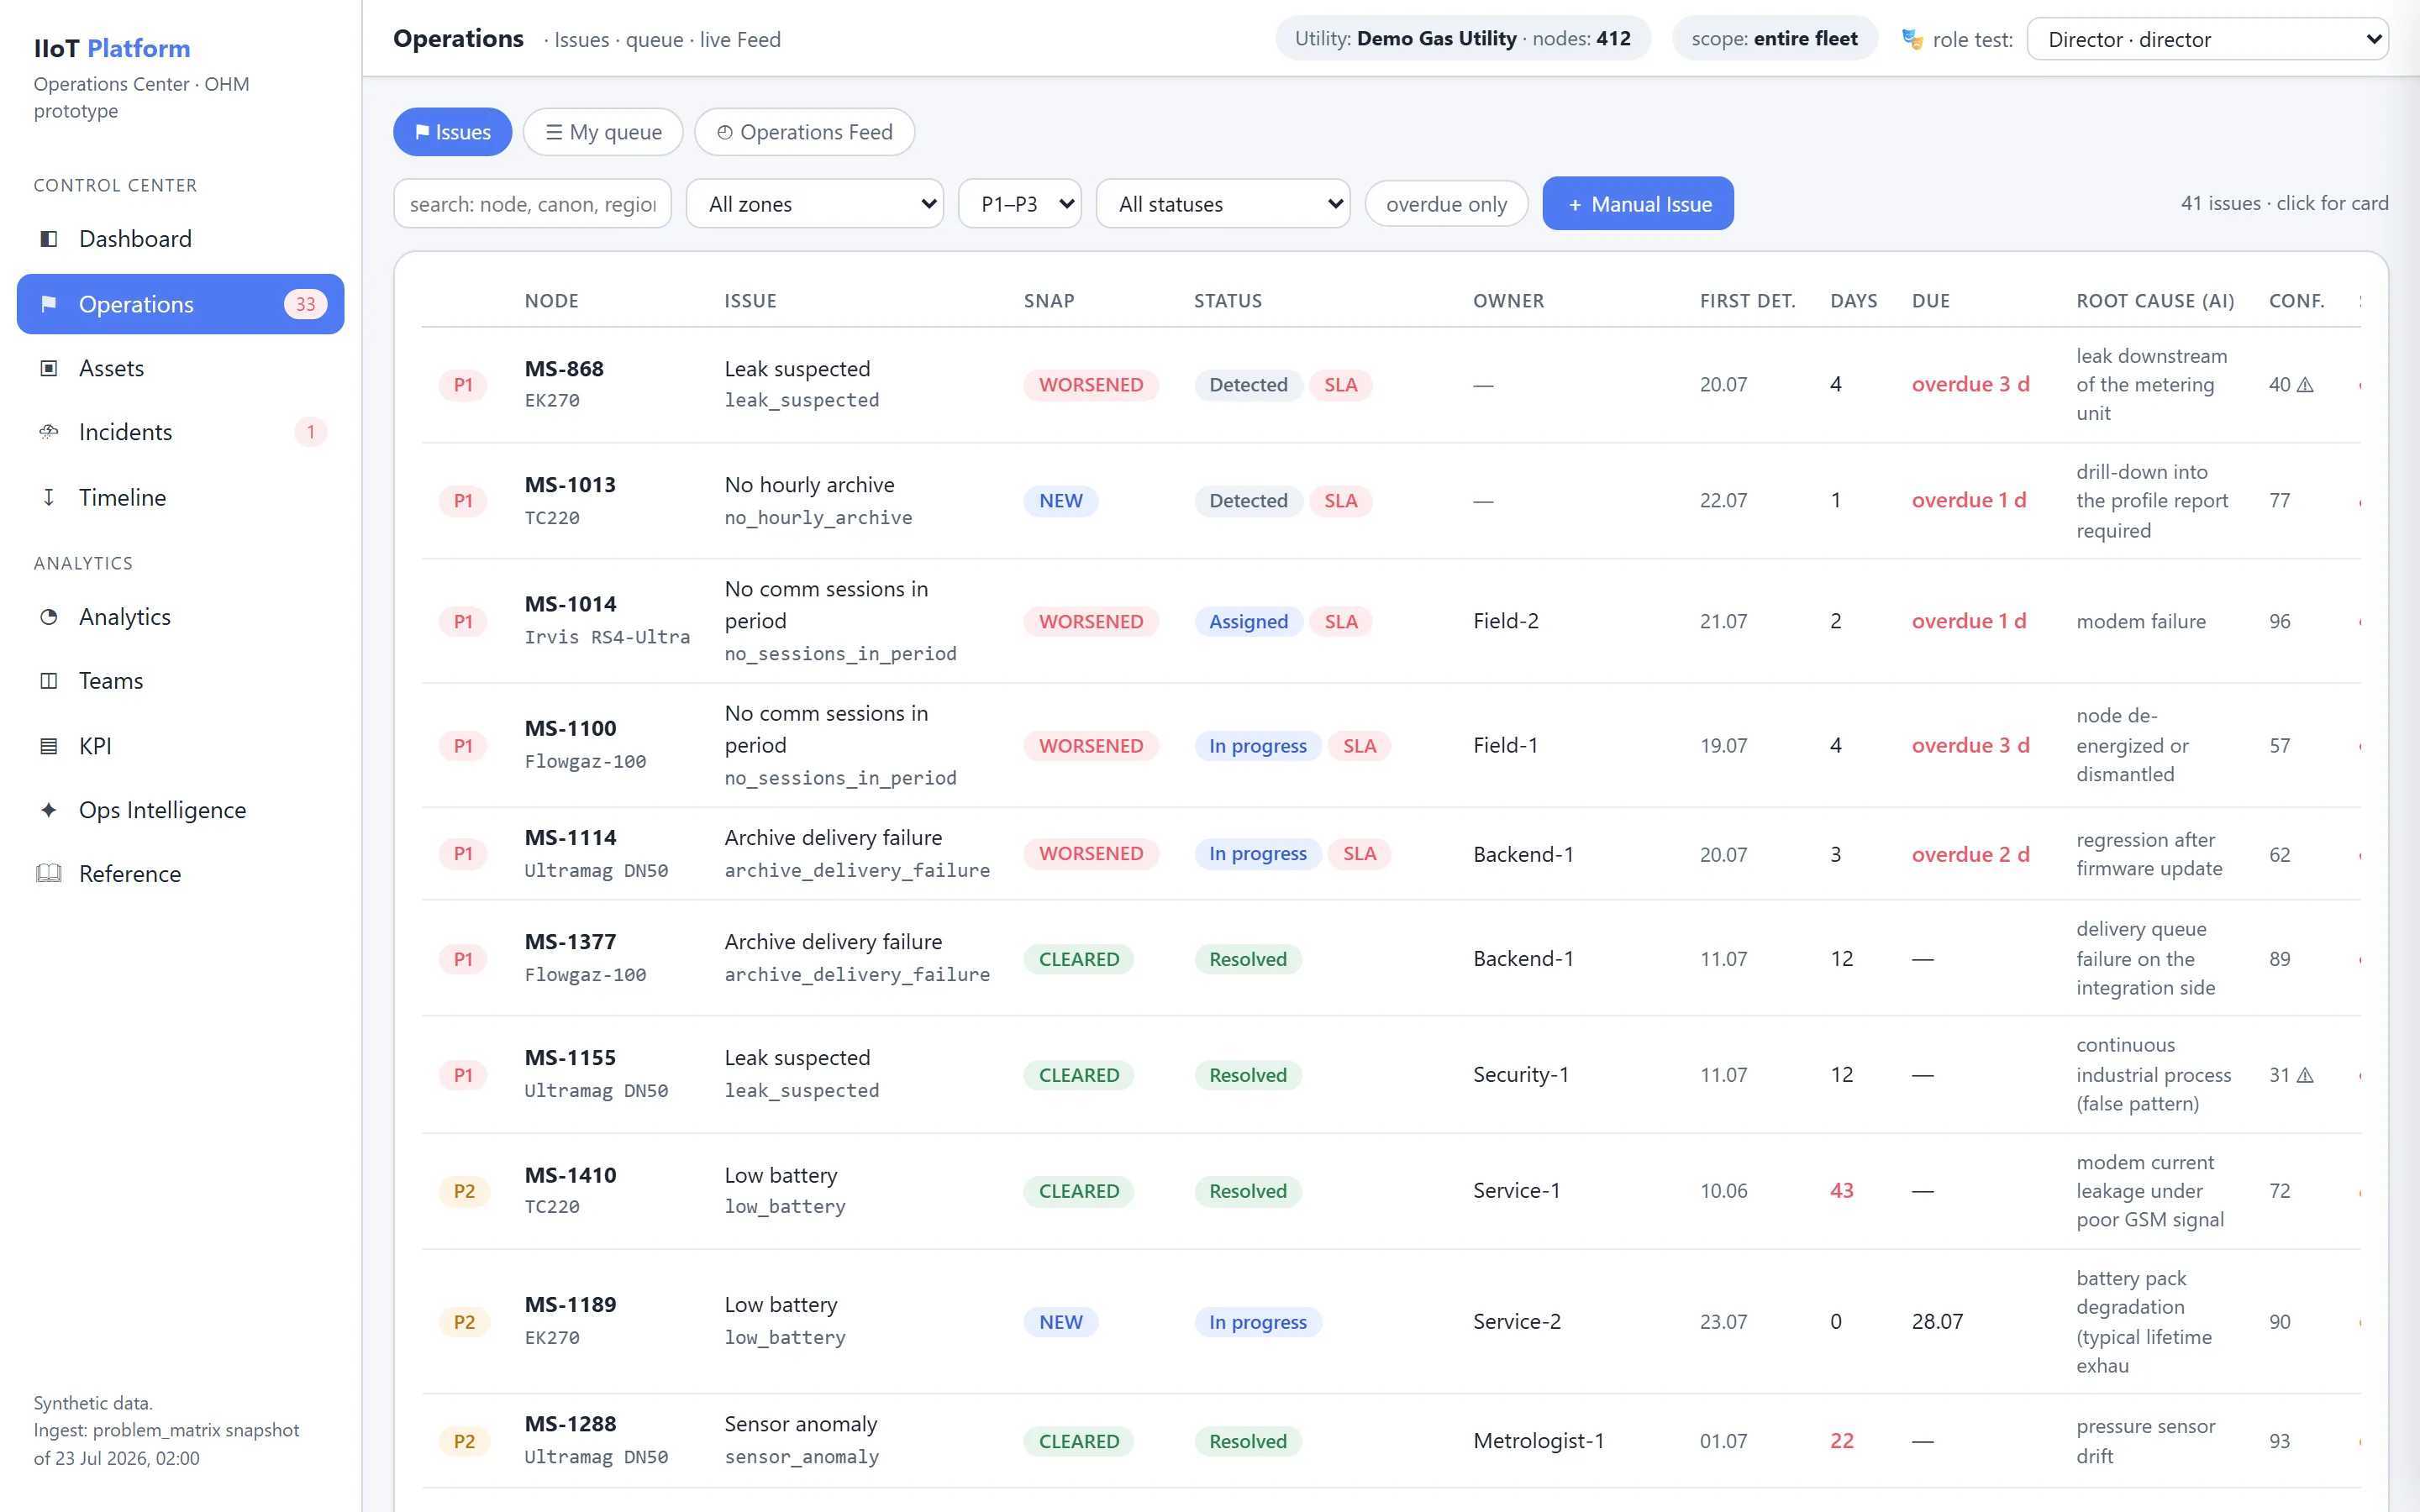
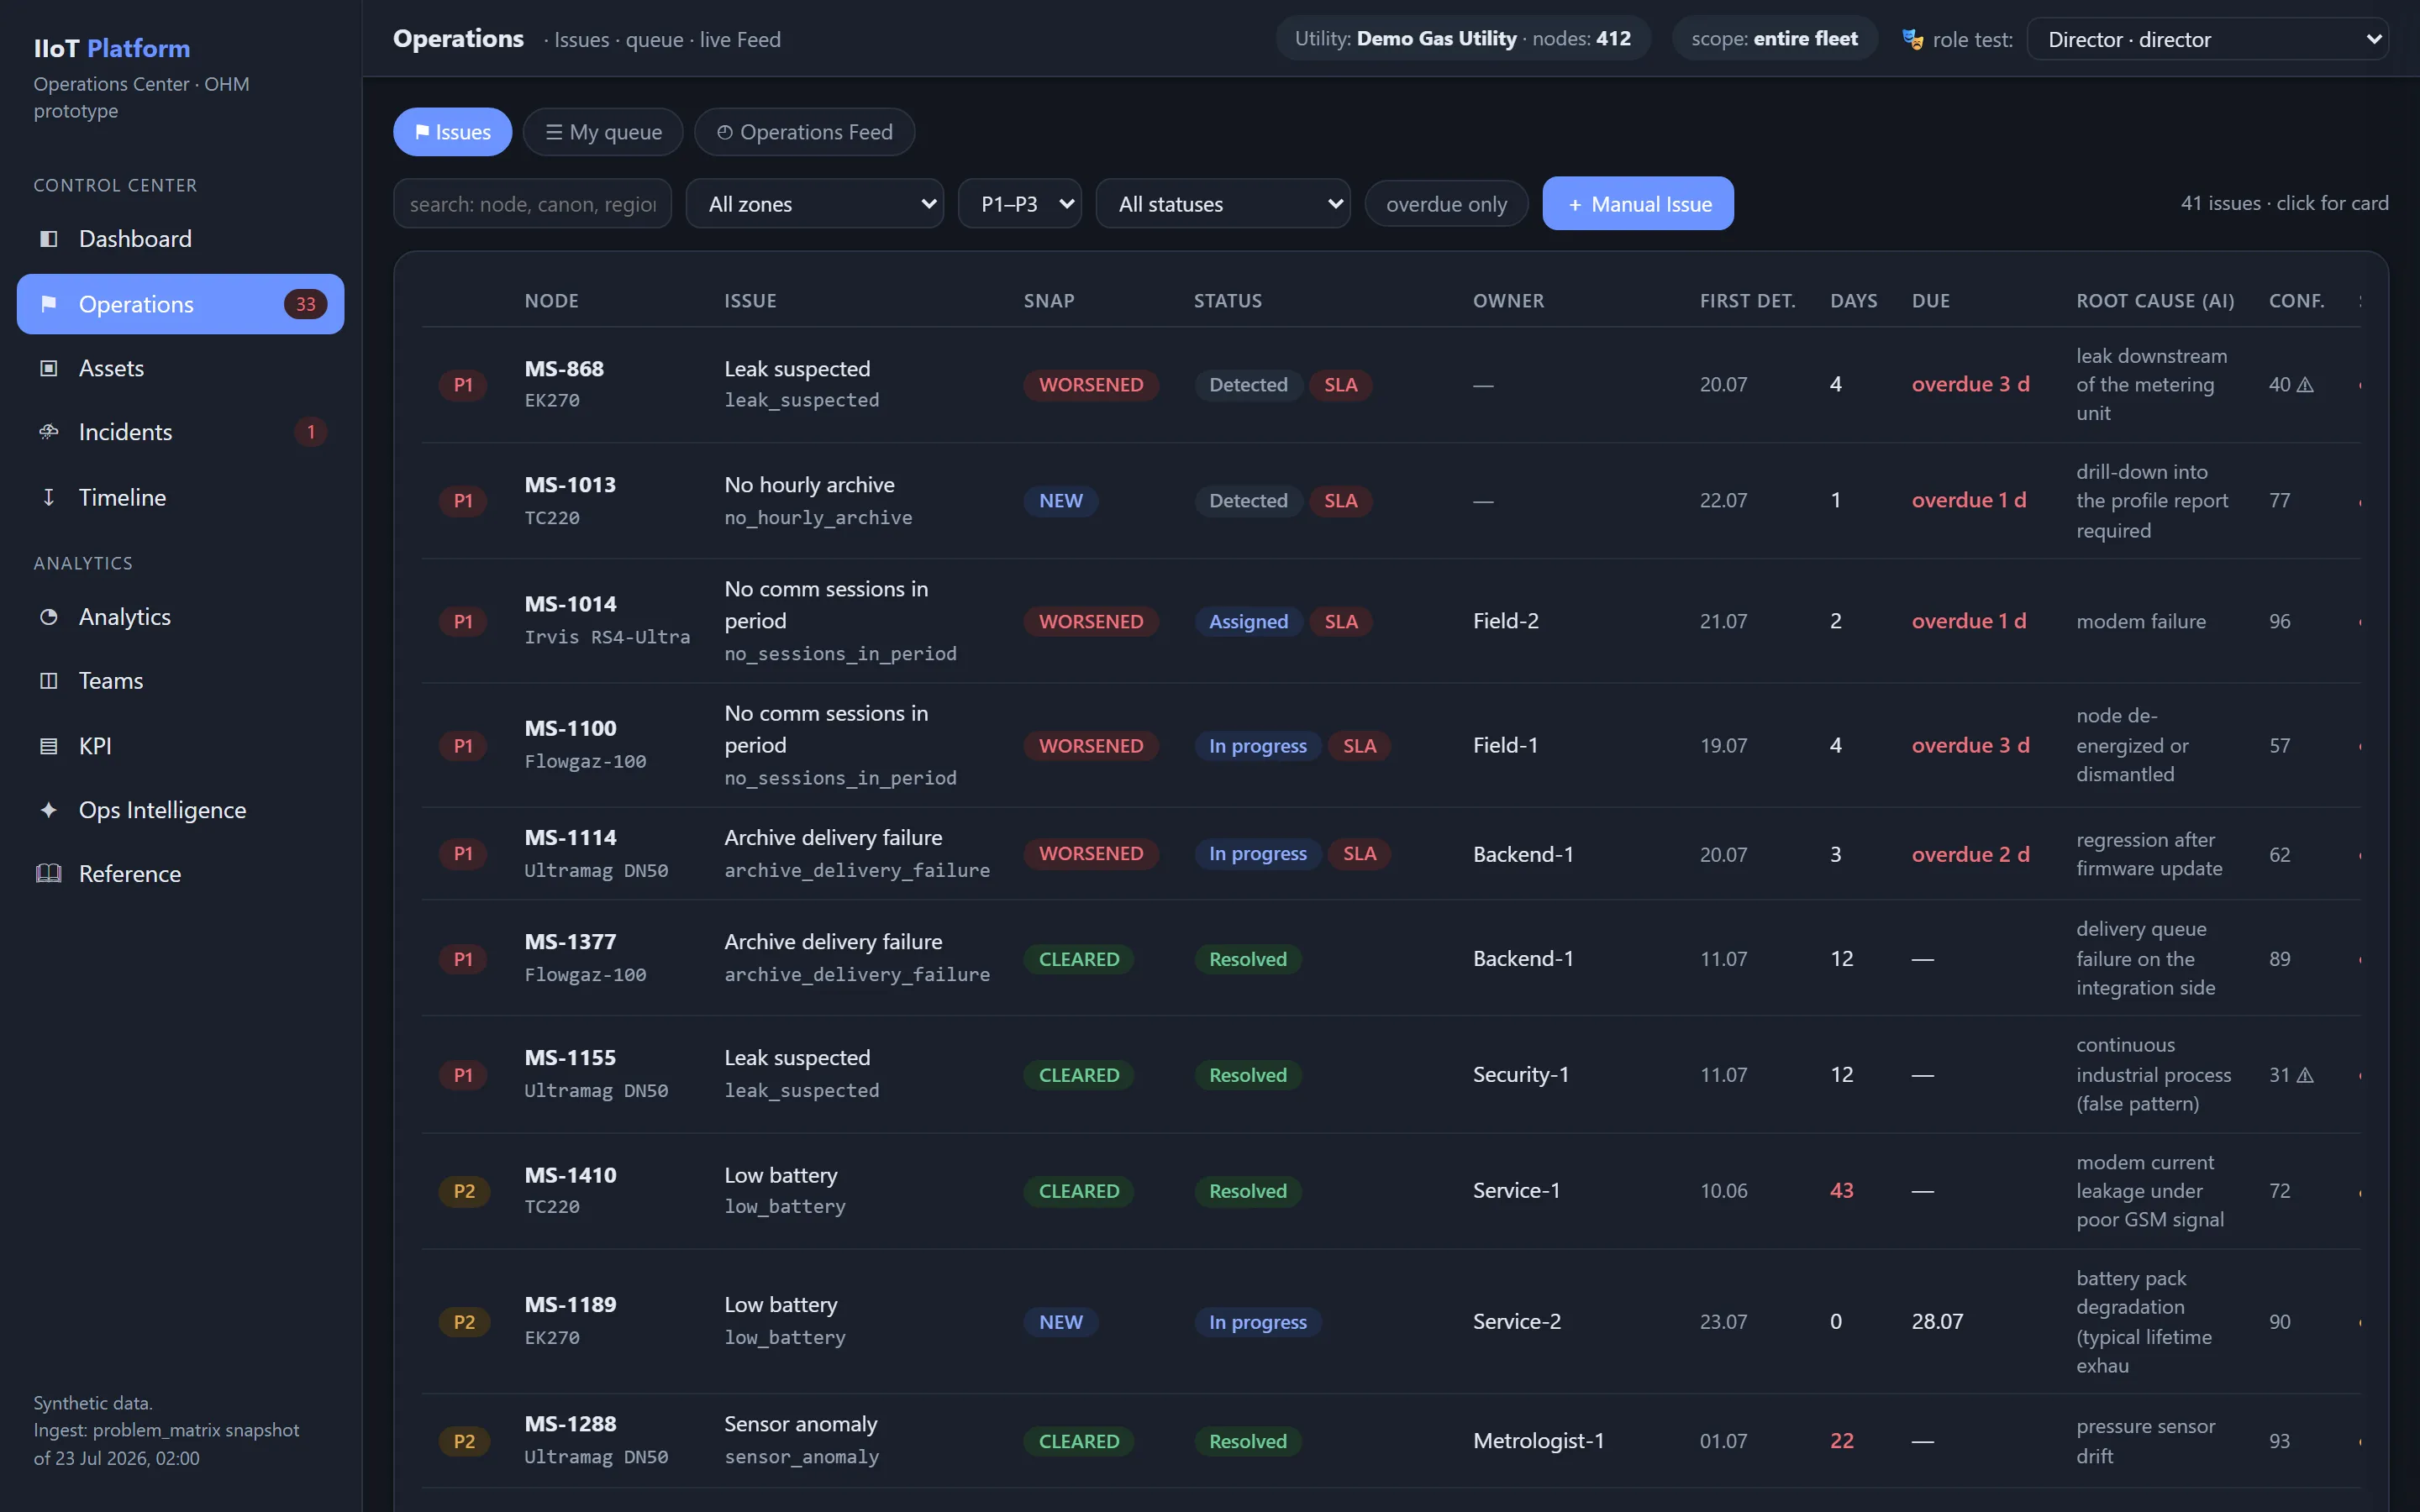
تتضمّن قائمة العمل الرئيسية:
- ID؛
- الأولوية؛
- حالة snapshot؛
- حالة workflow؛
- الـ canon؛
- الأصل؛
- الإقليم؛
- السبب الجذري؛
- درجة الثقة؛
- وقت أوّل اكتشاف؛
- العمر؛
- المنفِّذ؛
- الموعد النهائي؛
- SLA؛
- عدد مرّات إعادة الفتح؛
- massive incident ID؛
- التبعيات الحاجبة.
بطاقة Issue
تجمع بطاقة Issue بين:
- passport المشكلة؛
- affected assets؛
- Evidence؛
- workflow؛
- root cause؛
- impact؛
- المهامّ؛
- التعليقات؛
- timeline؛
- related Issues؛
- التبعيات؛
- knowledge articles؛
- الإجراءات؛
- نتيجة التحقّق؛
- audit trail.
بطاقة Issue الكاملة ودورة حياتها موصوفتان في قسم Operational Issues.
الأصول (Assets)
تعرض بطاقة الأصل:
- المعرّفات؛
- النوع والطراز؛
- الإقليم؛
- التهيئة؛
- البرنامج الثابت (firmware)؛
- حالة القياس عن بُعد؛
- Health Score؛
- الدرجات الفرعية؛
- Issues النشطة؛
- السجلّ التاريخي؛
- المشكلات المتكرّرة؛
- الأصول المرتبطة؛
- الأعمال المنجزة؛
- المستندات.
نموذج الصحّة الذي تستند إليه هذه الدرجات موصوف في قسم Asset Health.
الحوادث الجماعية (Massive Incidents)
تعرض شاشة الحوادث الجماعية:
- الحجم؛
- النافذة الزمنية؛
- التوقيع المشترك؛
- affected assets؛
- الإصدارات والتبعيات المشتركة؛
- السبب الجذري المُرجَّح؛
- تقدّم الاستعادة؛
- Issues المفردة المتبقّية؛
- التحليل اللاحق للحادث.
ارتباط الحوادث ودورة حياتها موصوفان في قسم الحوادث الجماعية.
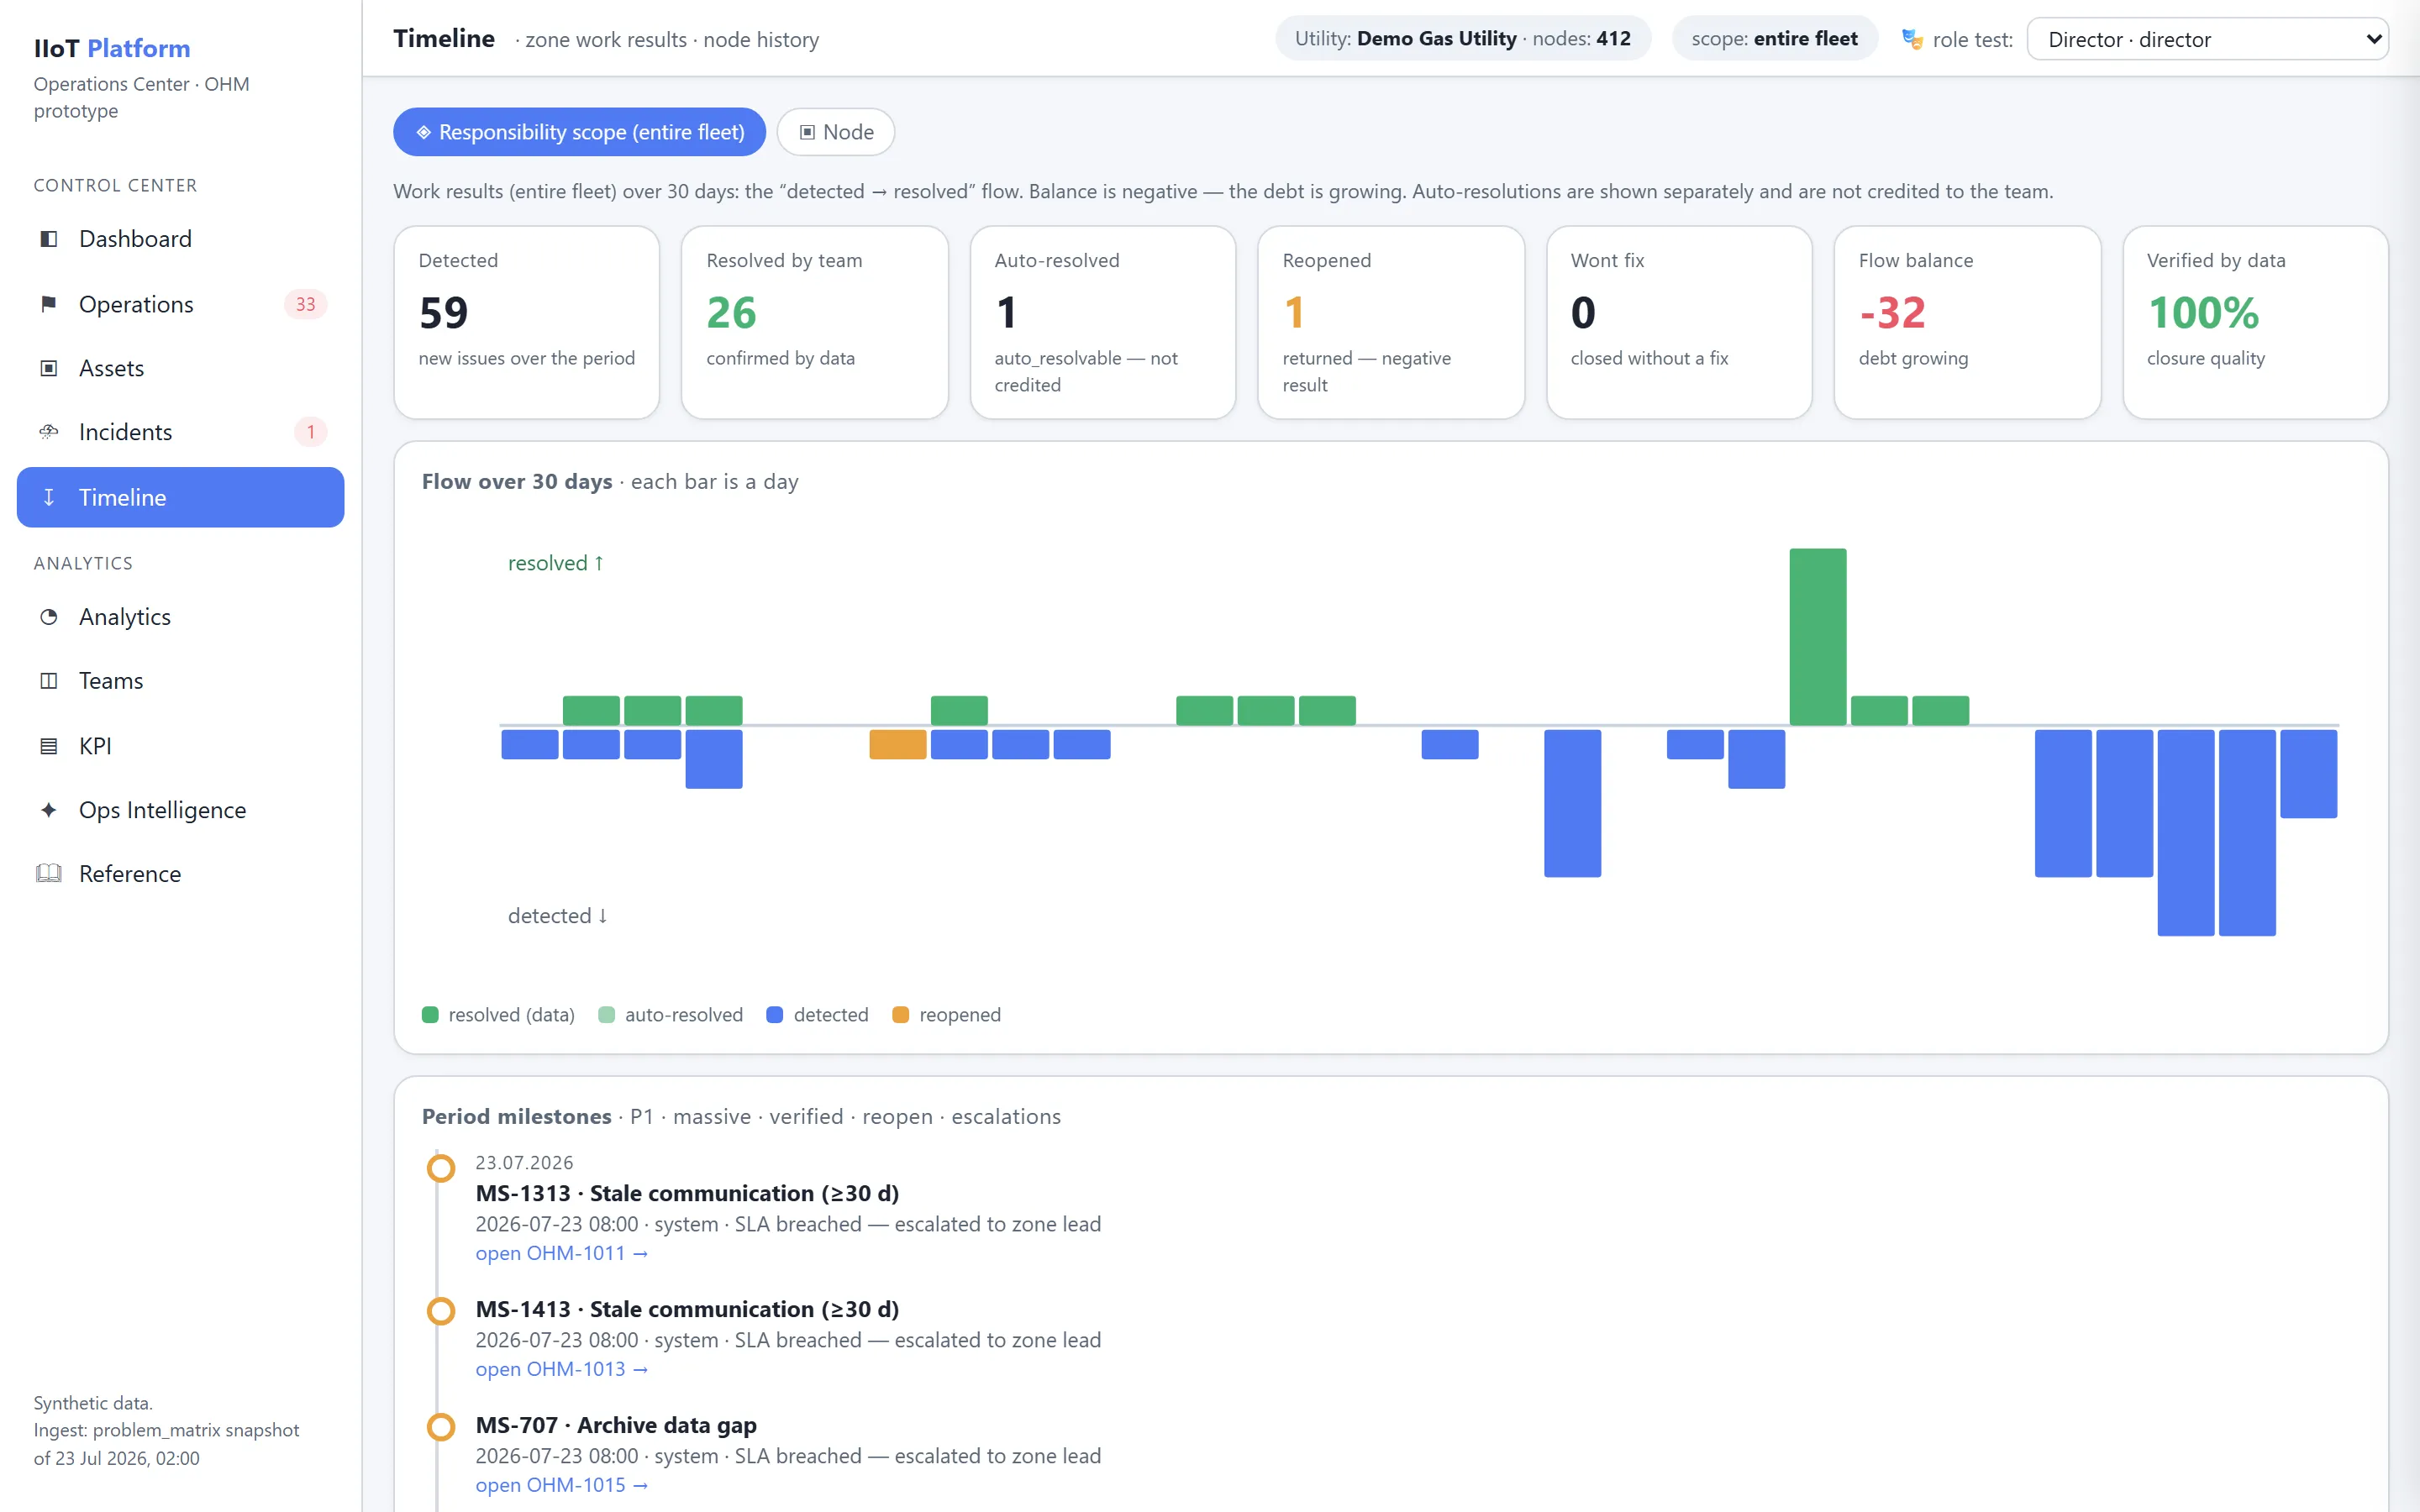
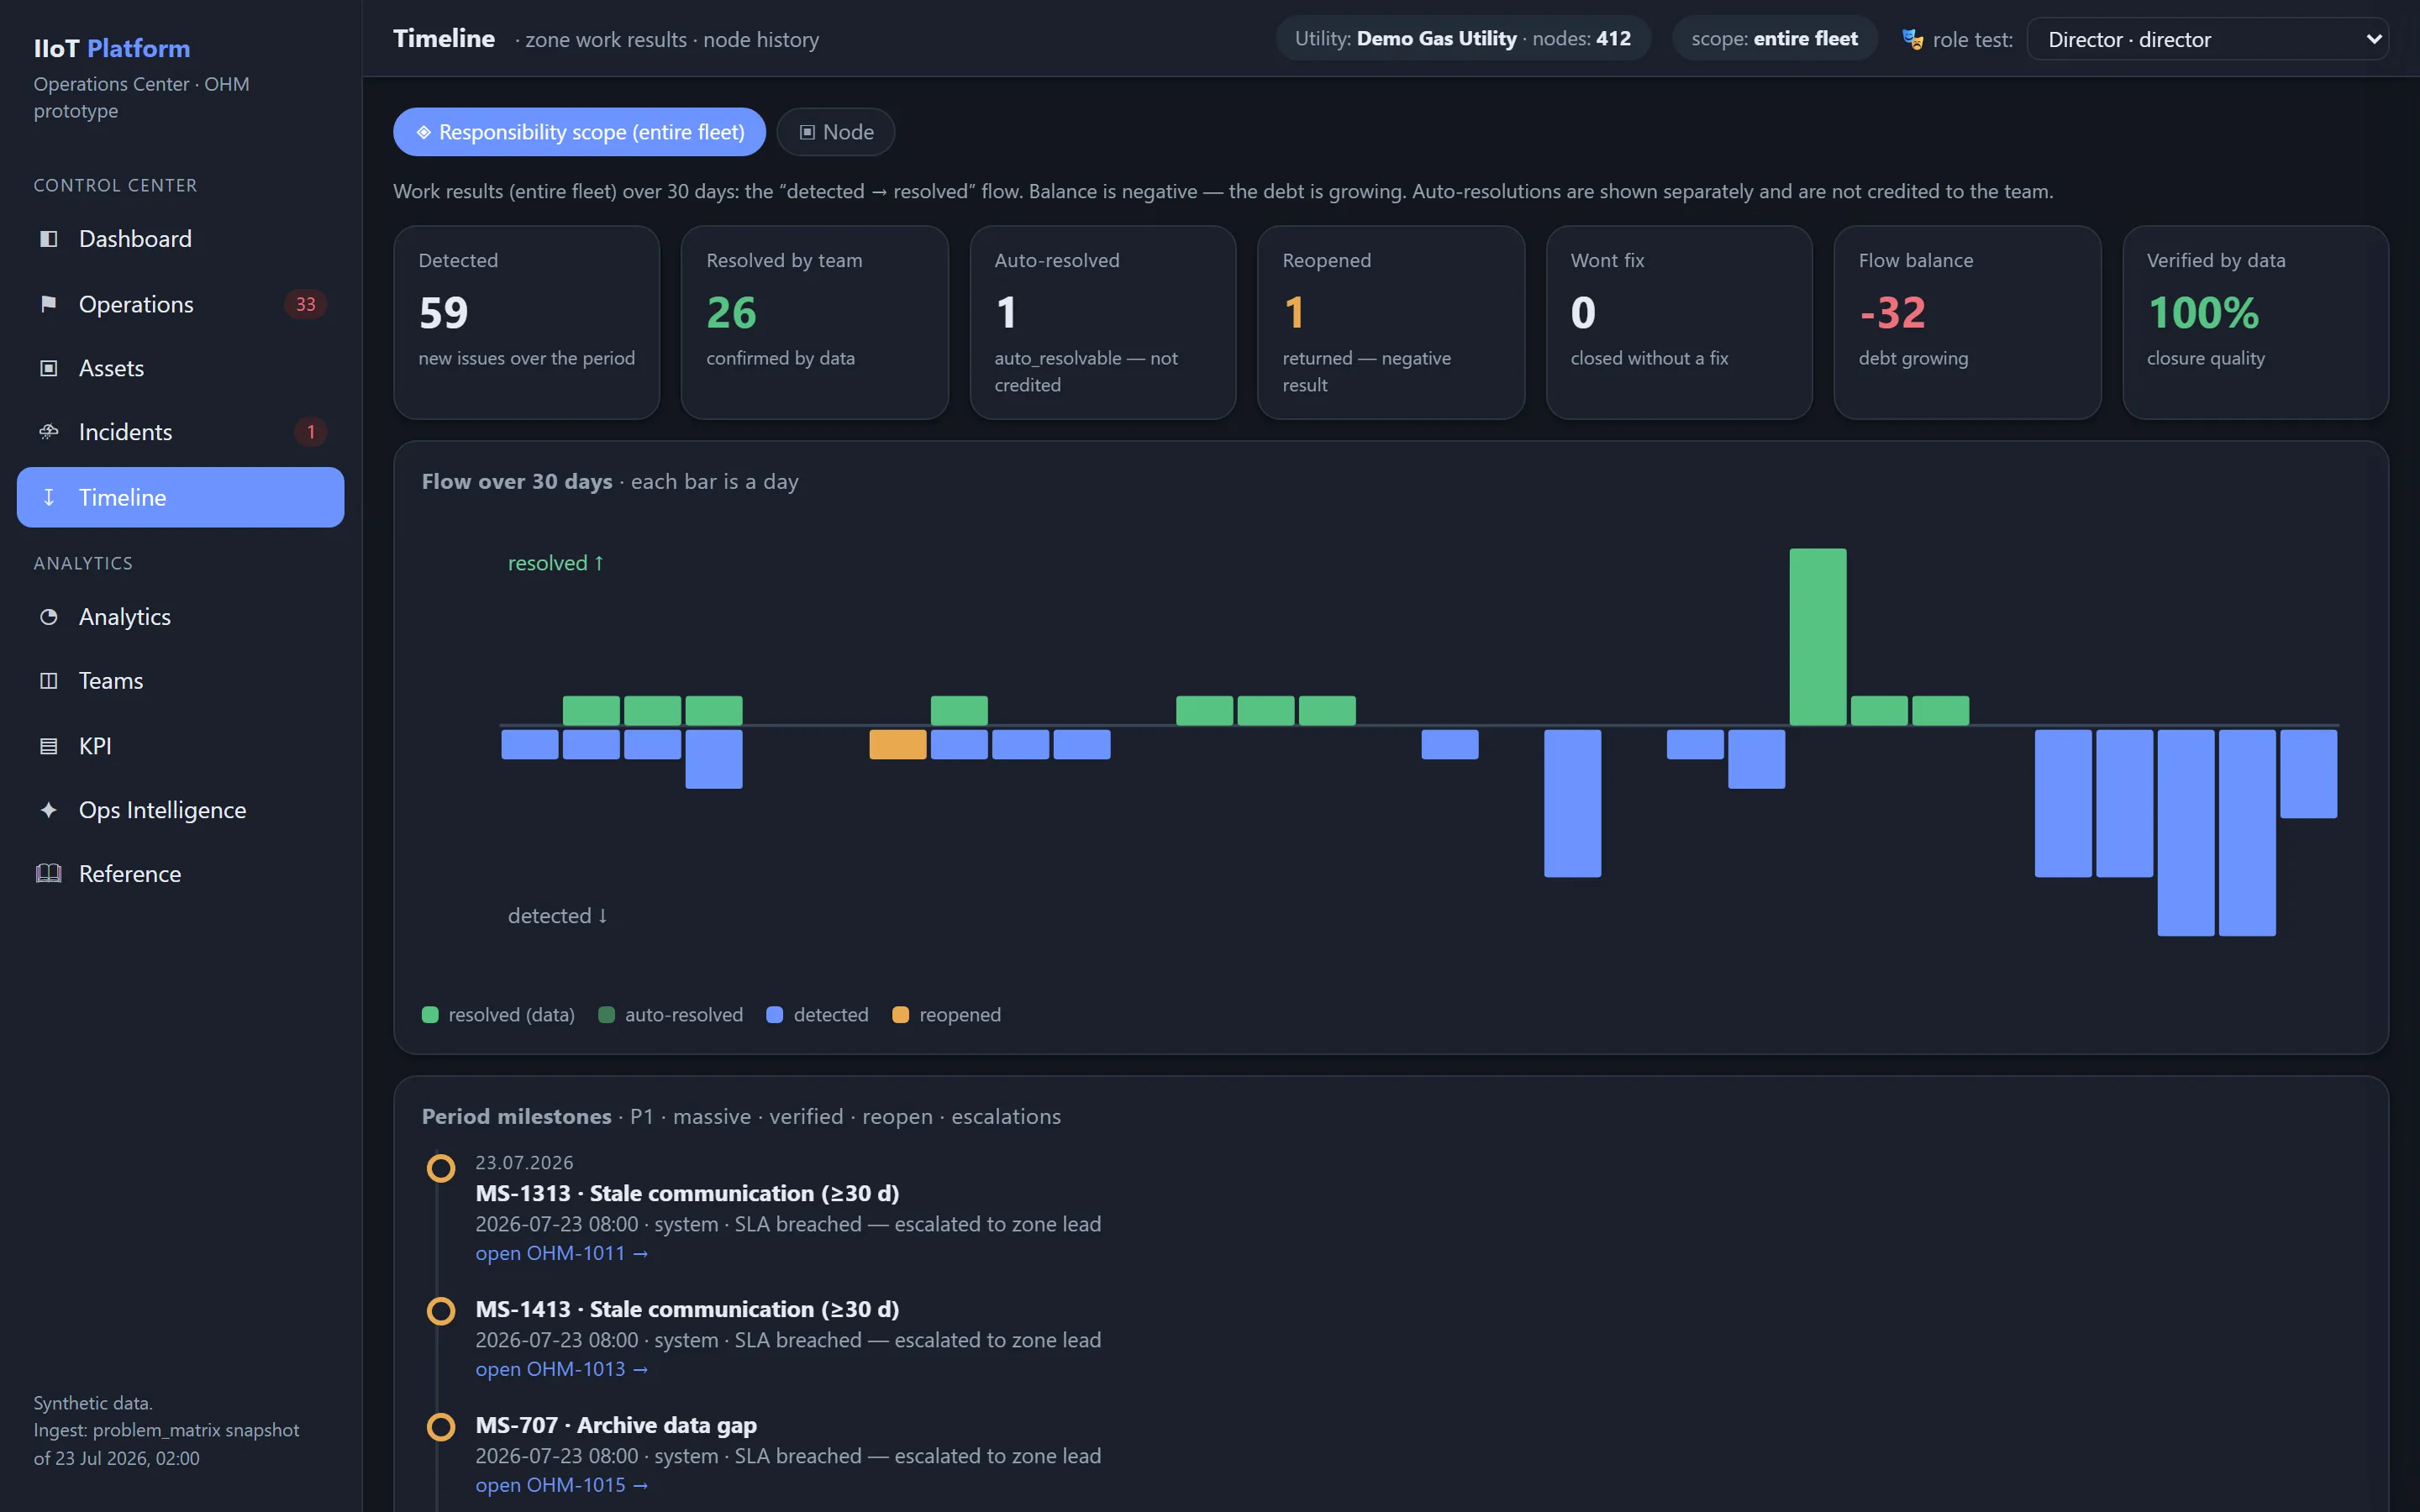
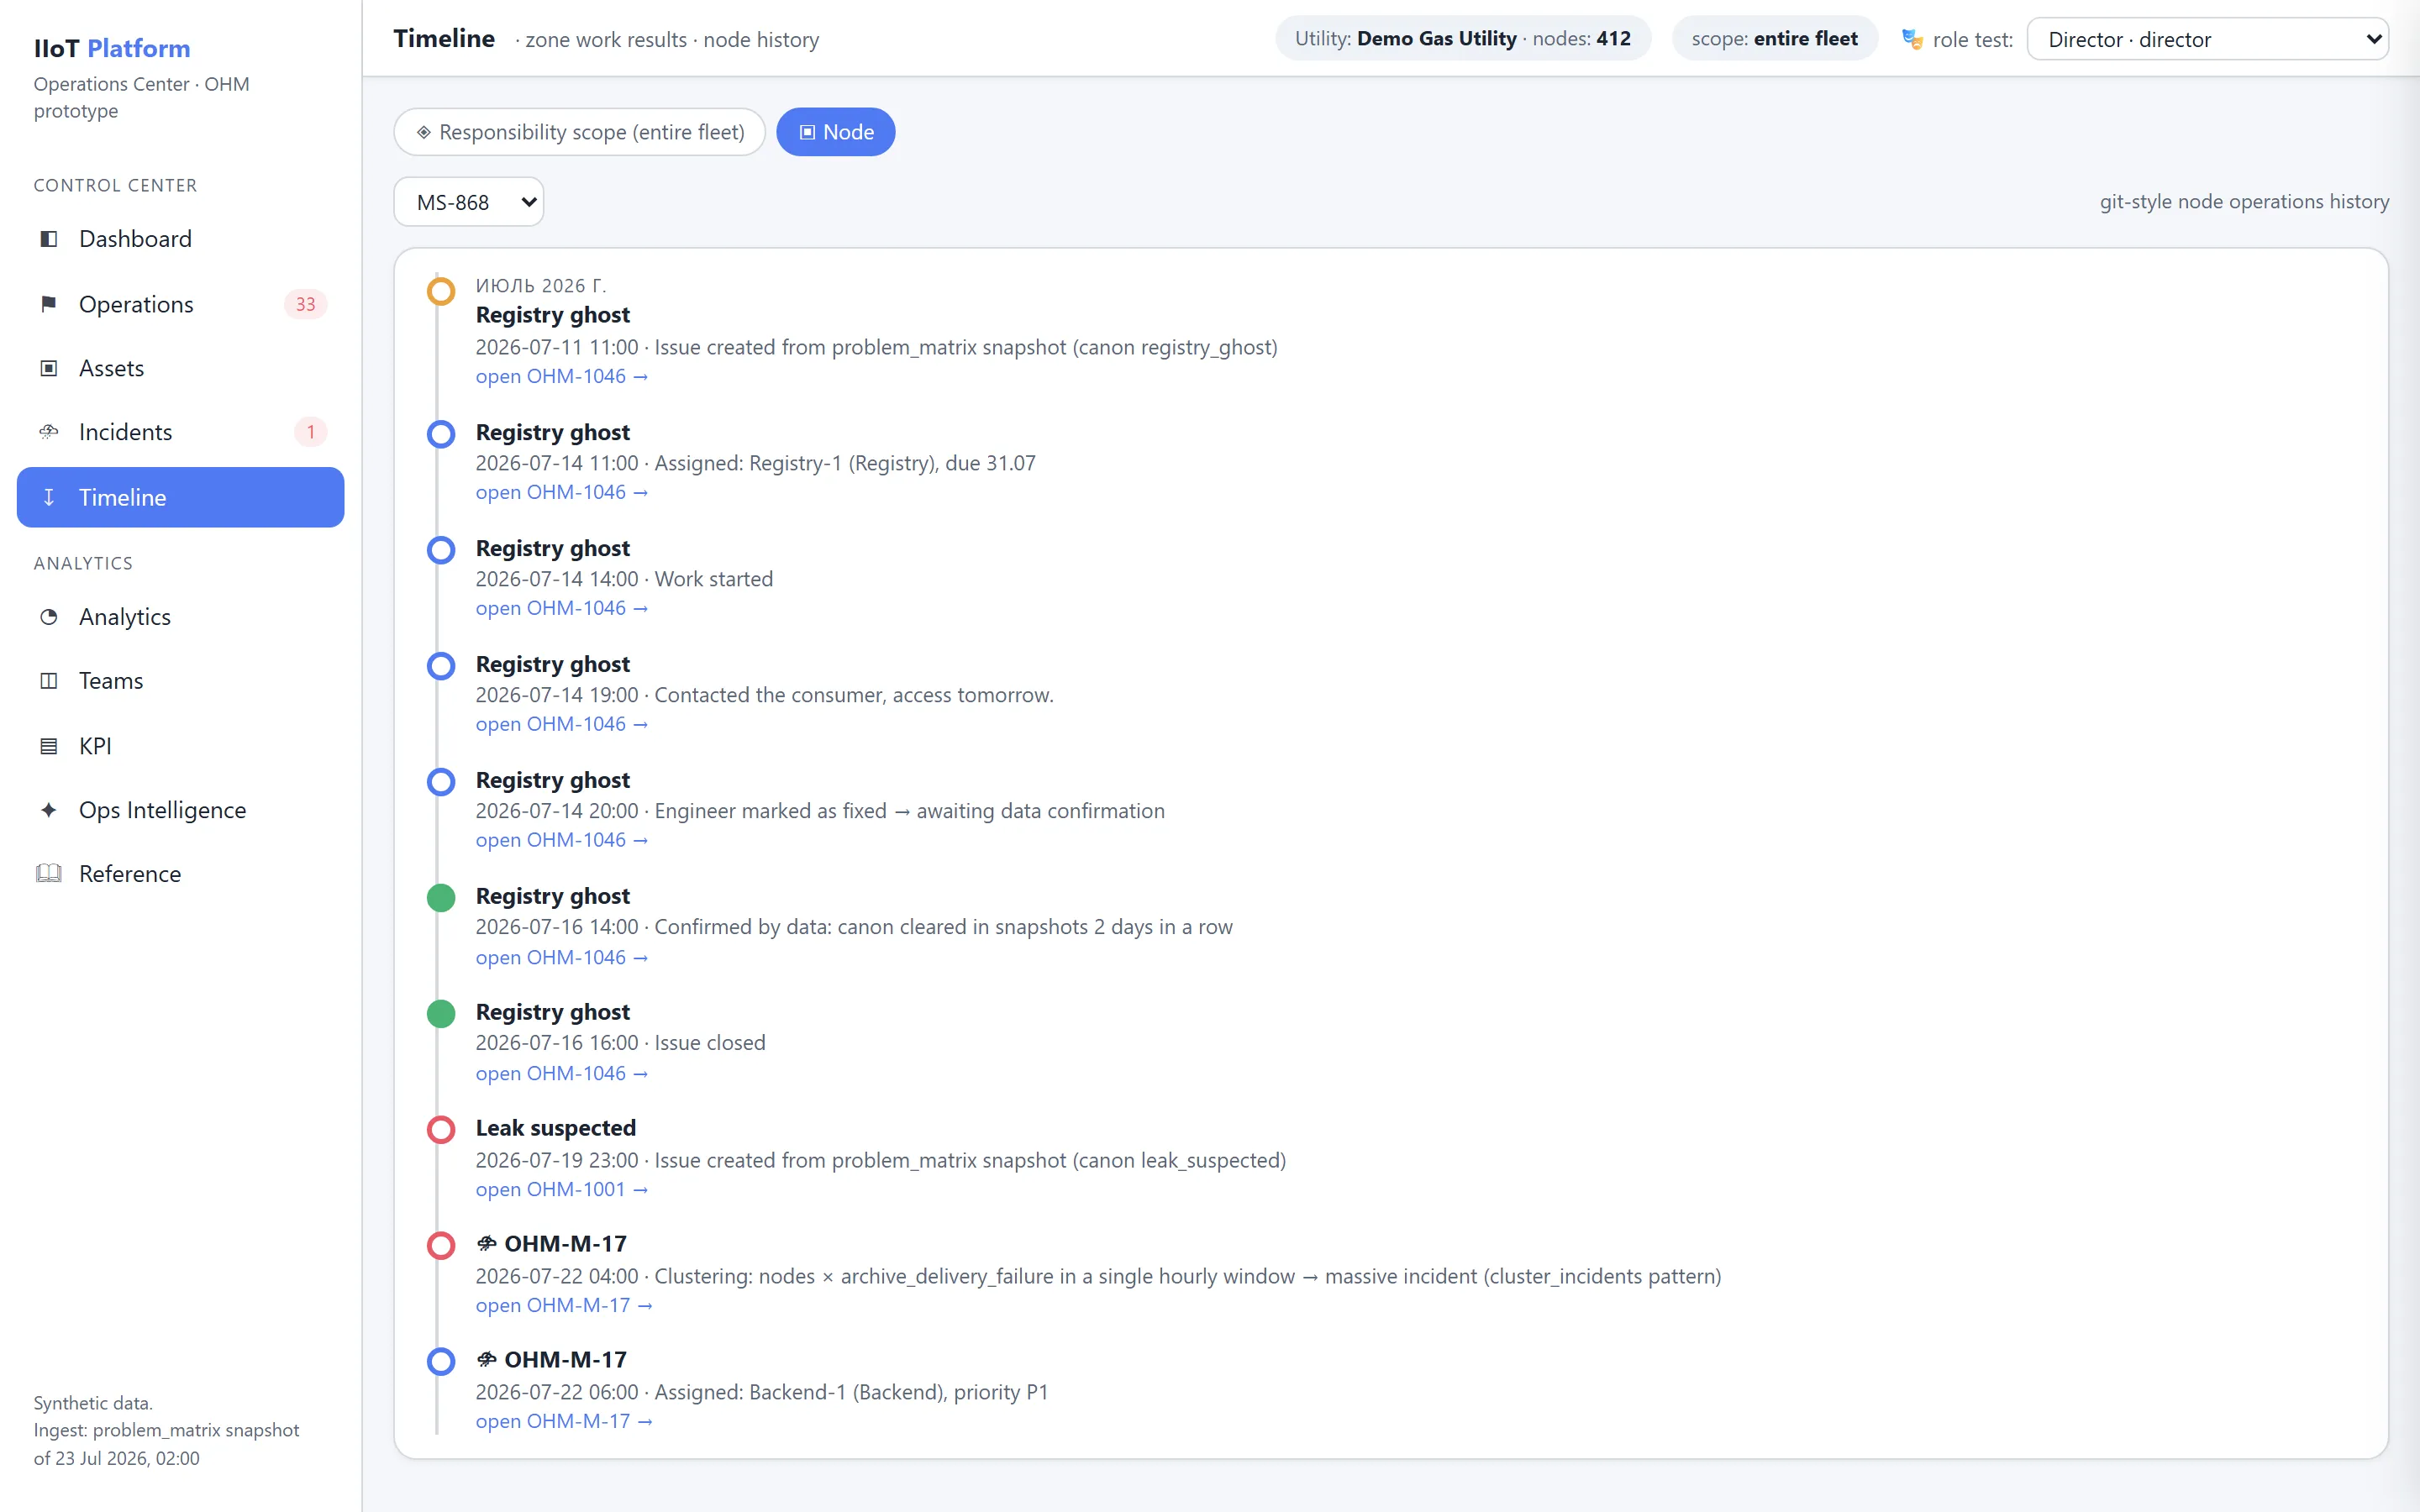
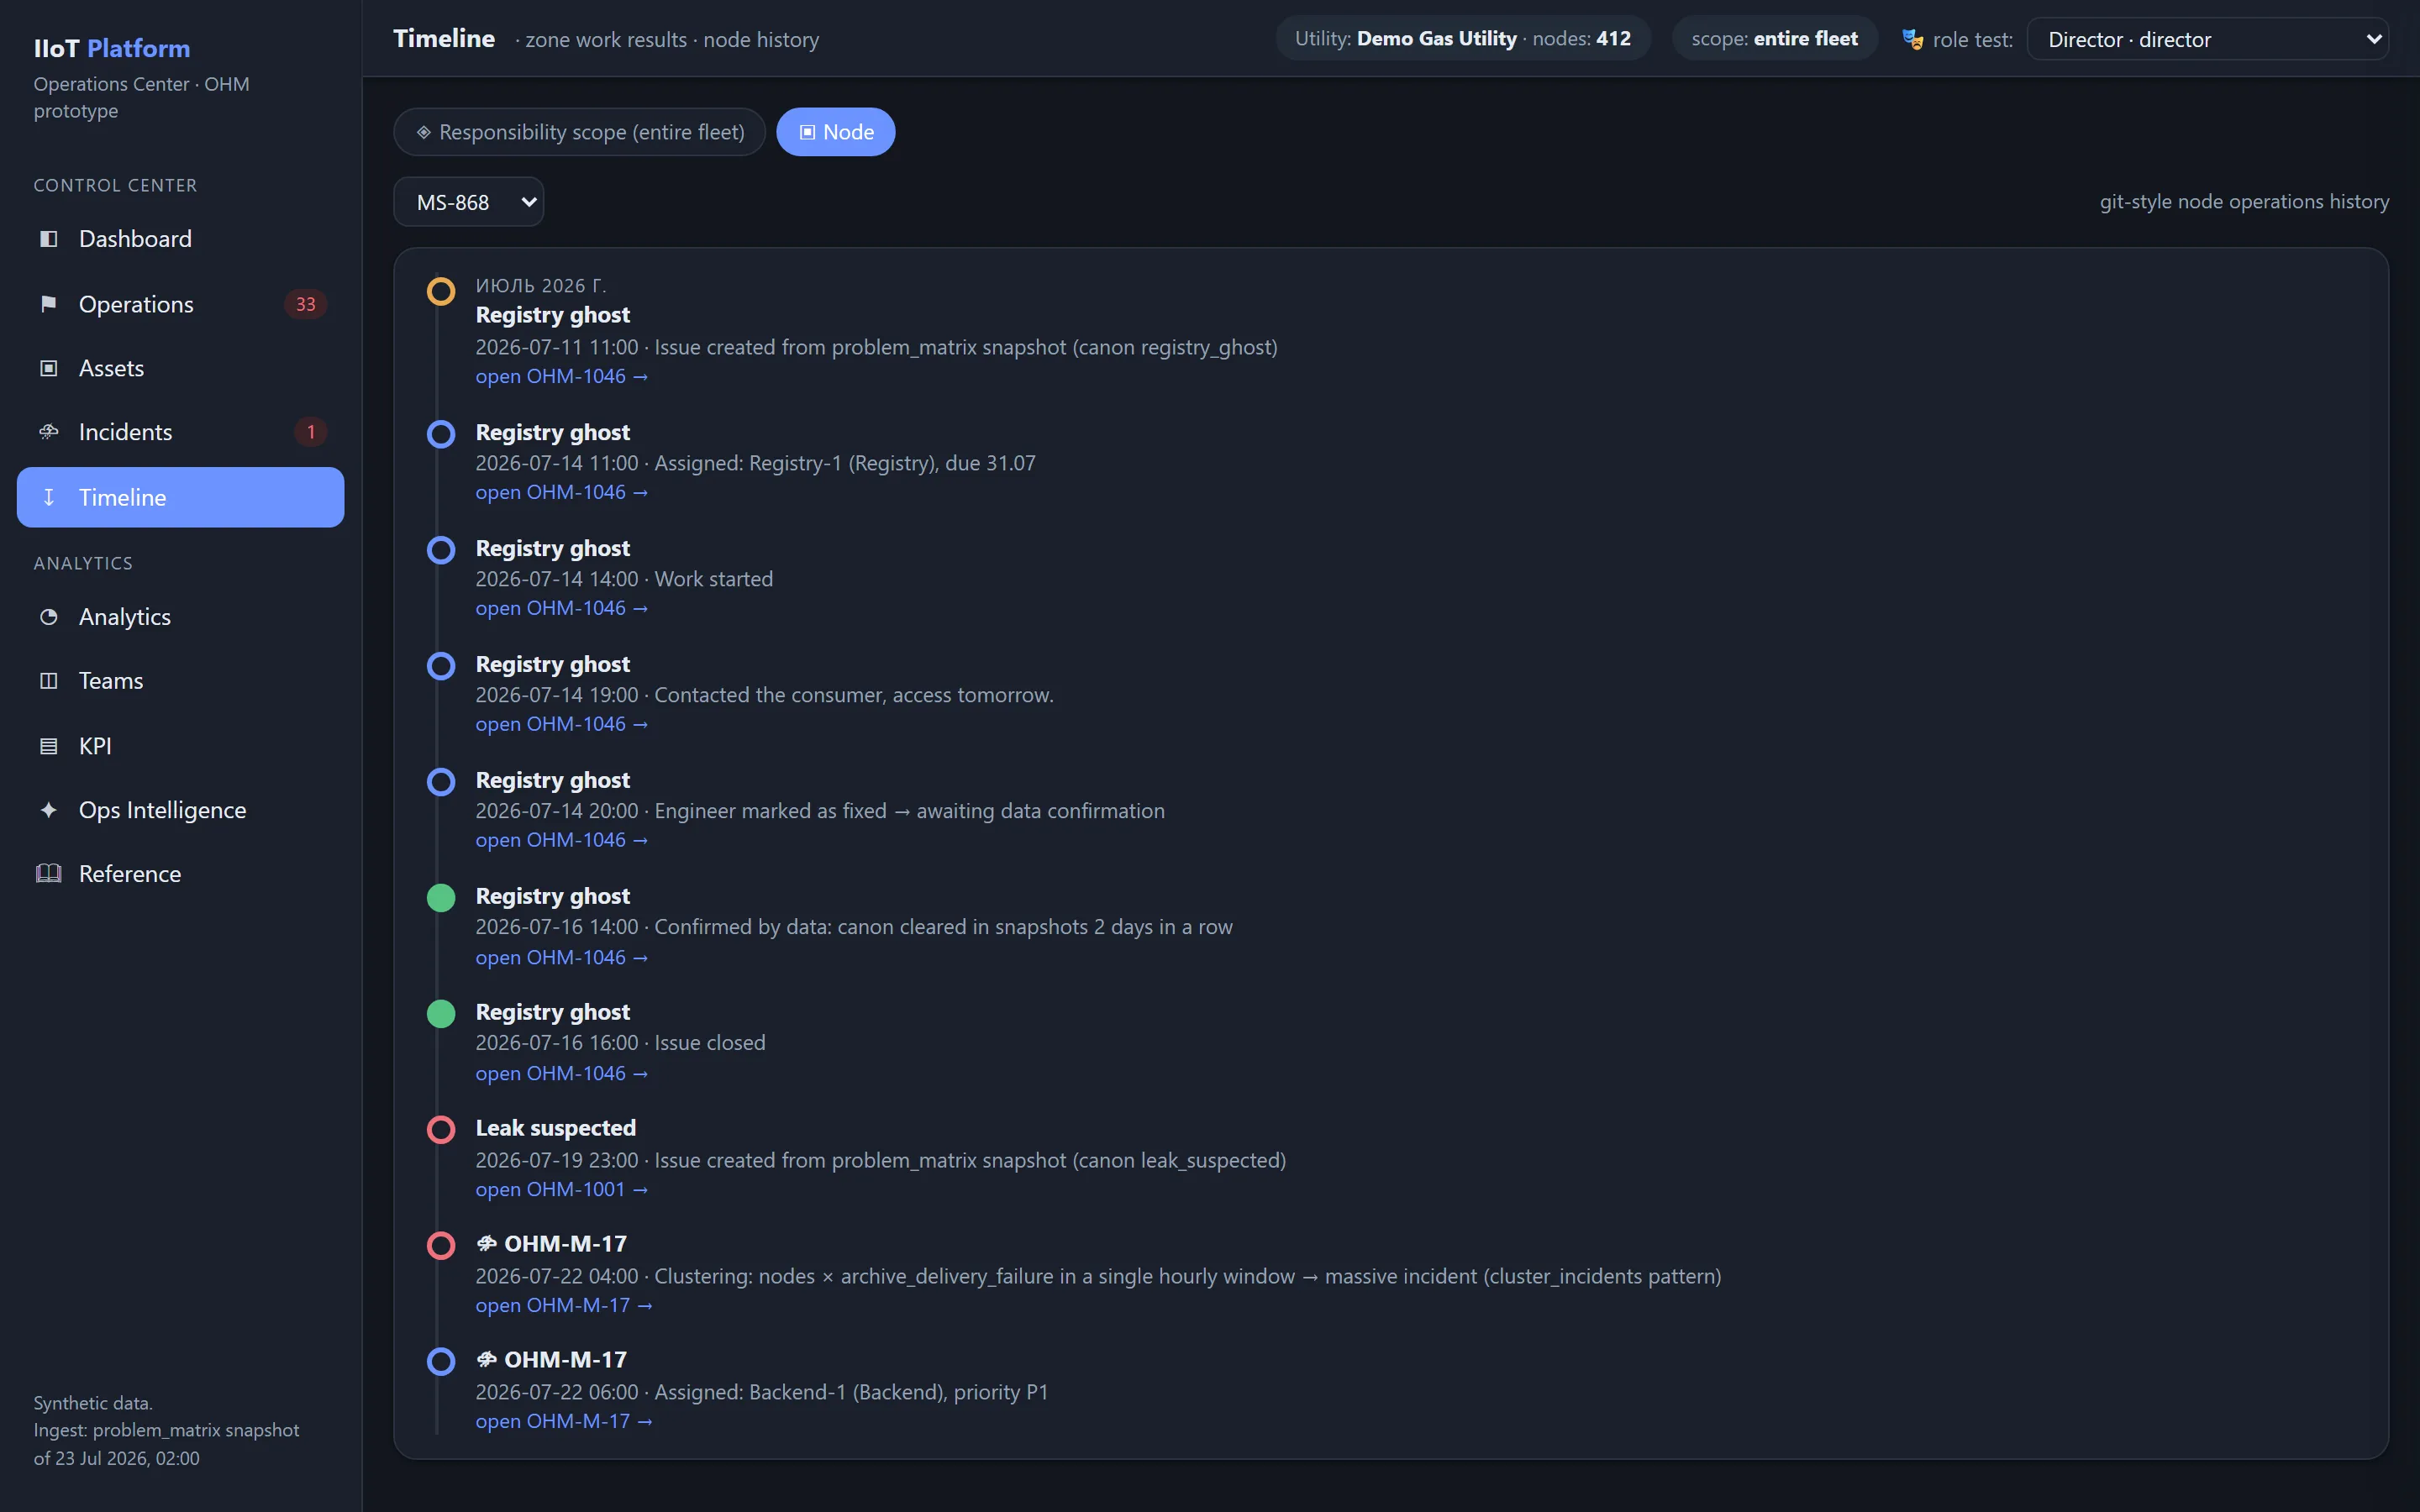
الخطّ الزمني (Timeline)
يمثّل Timeline السجلّ التشغيلي الموحّد:
| الوقت | الحدث |
|---|---|
| 09:14 | اكتُشف Issue |
| 09:16 | أُرفقت Evidence |
| 09:18 | رُبط بـ OHM-2026-001811 |
| 09:23 | أُسنِد إلى Integration-2 |
| 10:04 | بدأت الأعمال |
| 11:42 | صُحّحت التهيئة |
| 12:10 | بانتظار التحقّق |
| 13:00 | أوّل snapshot نظيف |
| اليوم التالي 04:00 | ثاني snapshot نظيف |
| 04:01 | تمّ التحقّق بالبيانات |
| 04:02 | Resolved |
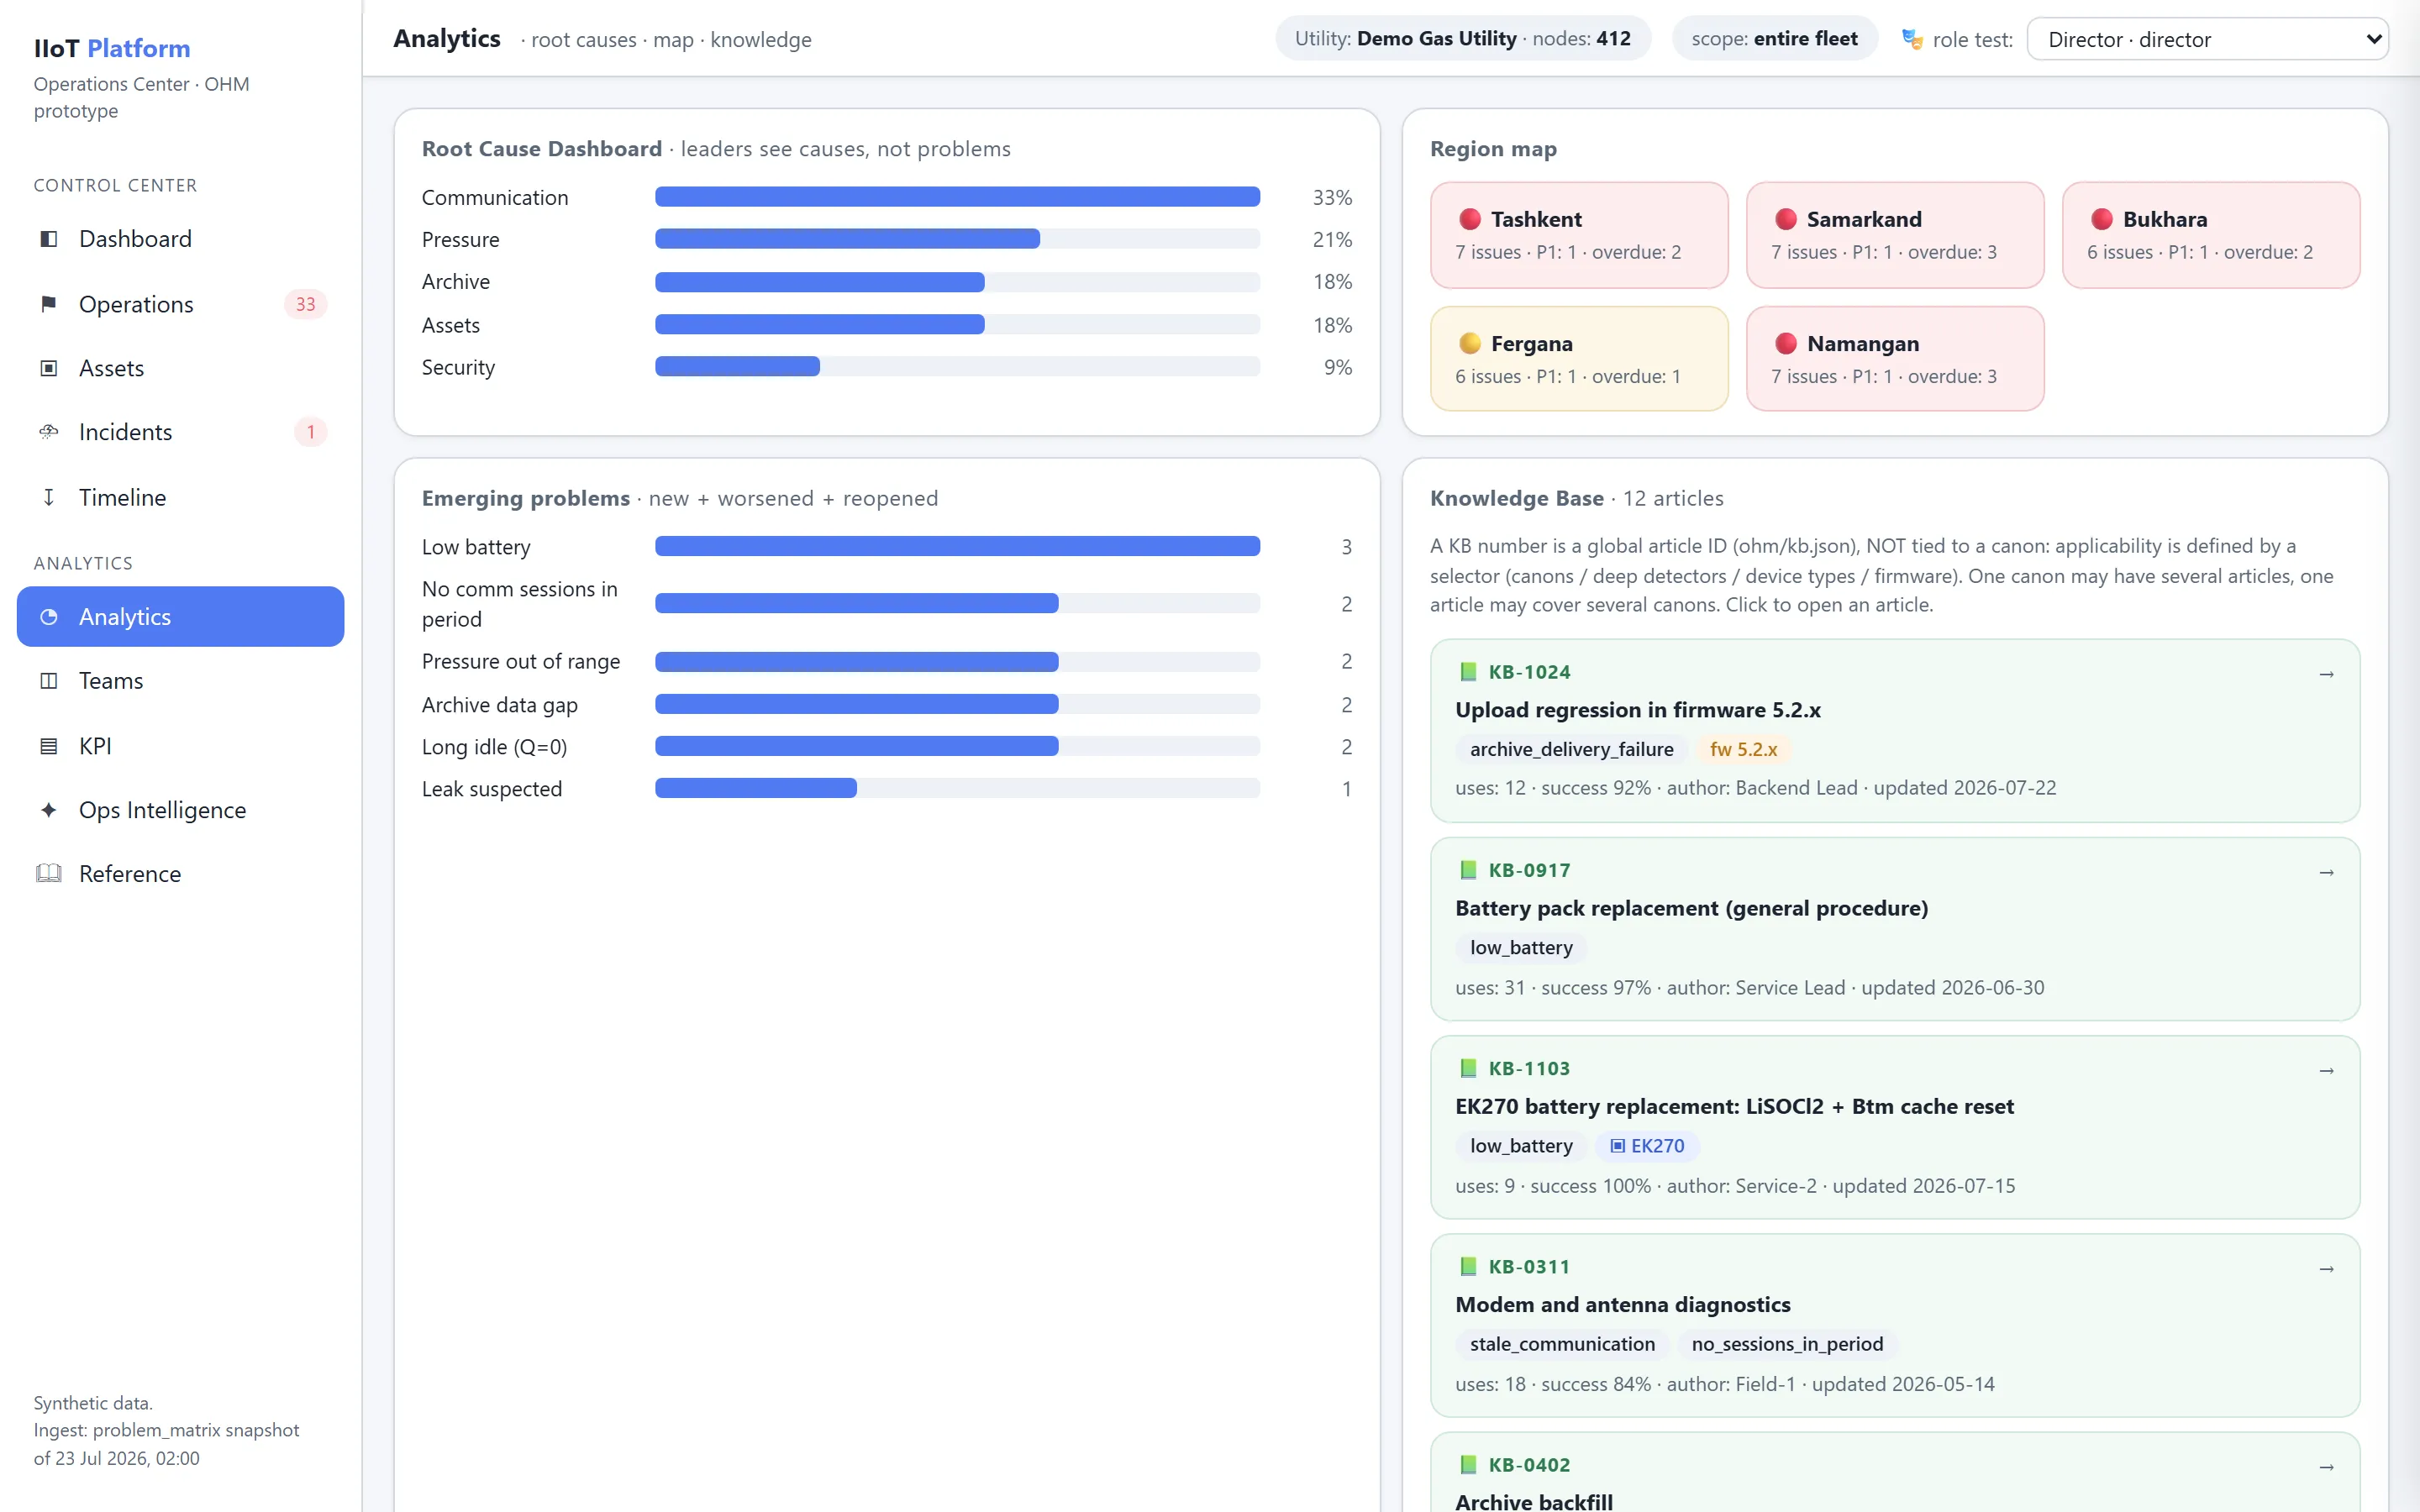
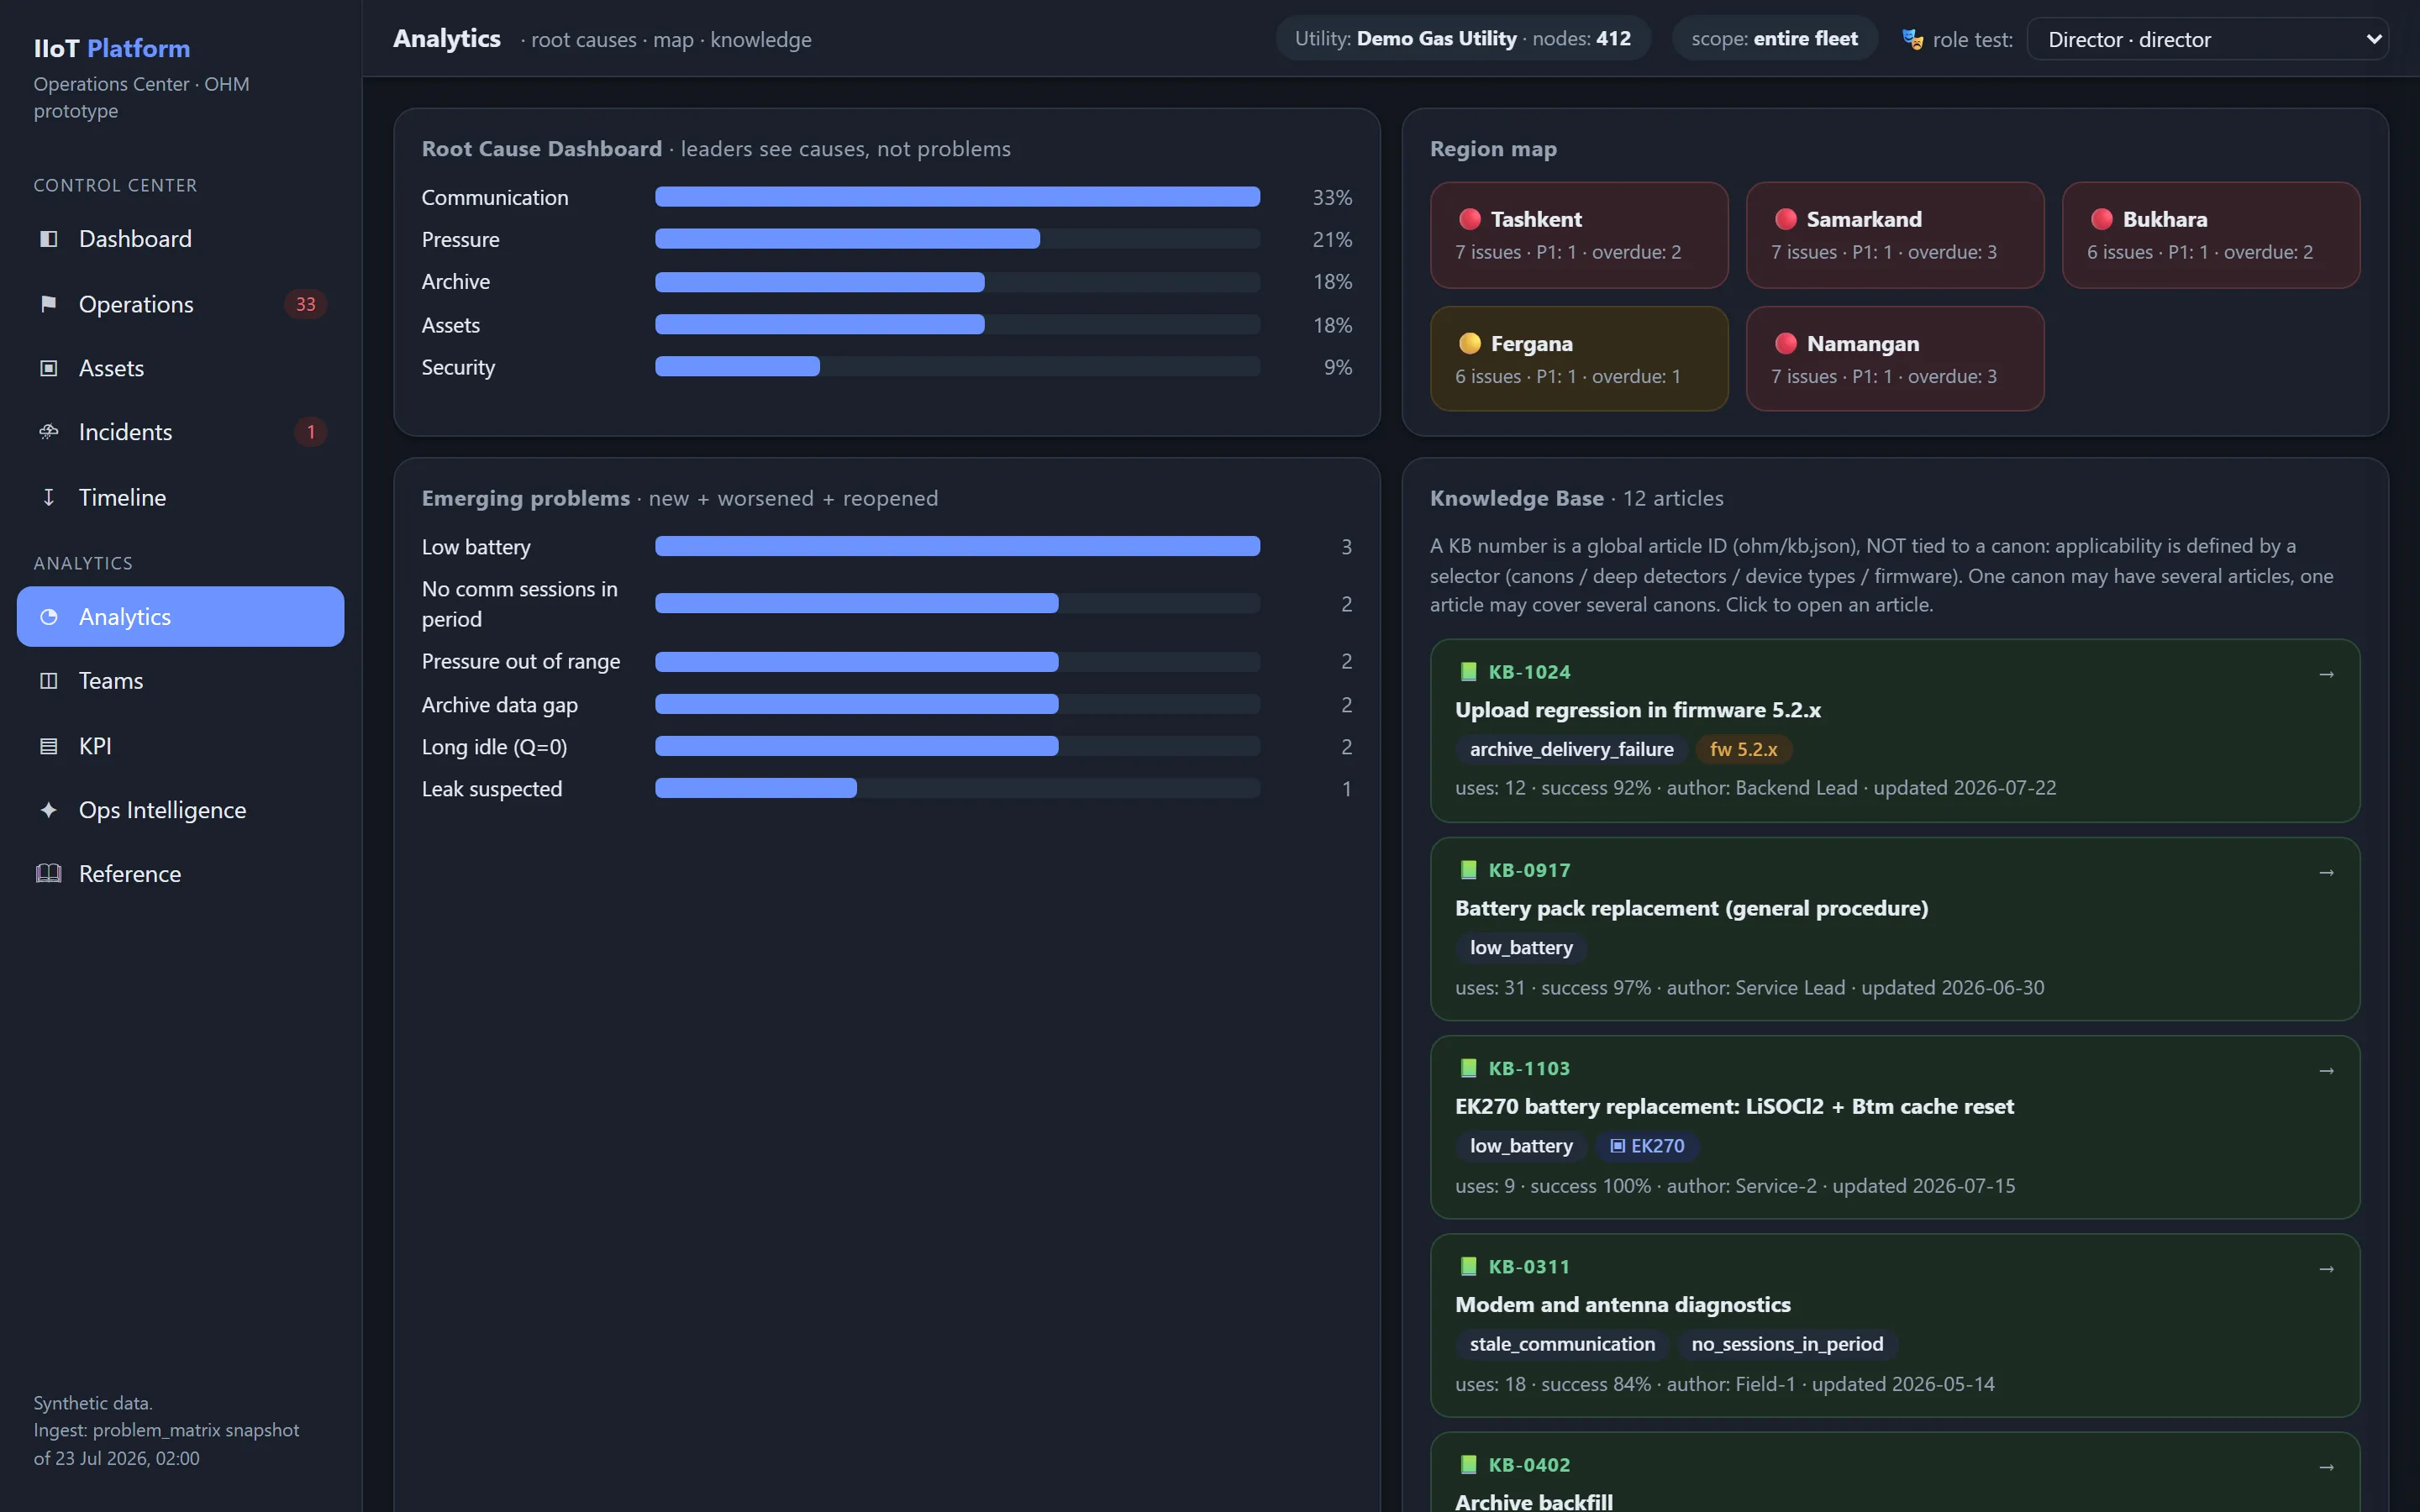
التحليلات (Analytics)
تتضمّن Analytics:
- Root Cause Dashboard؛
- توزيع المشكلات؛
- معدّل التكرار؛
- اتجاهات SLA؛
- جودة الـ detectors؛
- اتجاهات صحّة الأصول؛
- المقارنة بين الأقاليم؛
- أثر الطوبولوجيا؛
- فعالية قاعدة المعرفة (Knowledge Base)؛
- المخاطر المتوقَّعة.
الفرق (Teams)
تعرض Teams:
- capacity؛
- الحِمل المفتوح؛
- الحِمل المتأخّر؛
- حِمل P1؛
- حِمل التحقّق؛
- معدّل الاستغلال؛
- توازن الإسناد؛
- عمر الـ backlog؛
- توقّعات حِمل العمل.
المؤشّرات التي تستند إليها هذه الشاشة موصوفة في قسم KPI وأداء الفرق.
Operations Intelligence
يجمع Operations Intelligence بين:
- المخاطر الناشئة؛
- عناقيد الشذوذ؛
- الأعطال المتوقَّعة؛
- الأسباب الجذرية المحتملة؛
- الحوادث المشابهة؛
- التوصيات؛
- صحّة الـ detectors؛
- ثقة AI؛
- التغييرات غير المفسَّرة.
كيفية توليد هذه التوصيات موصوفة في قسم AI Operations Intelligence.
الـ Scope والتصفية
تستخدم جميع الشاشات scope موحّداً.
أمثلة:
- المؤسسة؛
- الإقليم؛
- الناحية؛
- منطقة المسؤولية؛
- المنفِّذ؛
- نوع الأصل؛
- طراز الجهاز؛
- البرنامج الثابت؛
- المشغّل؛
- البوّابة؛
- الـ canon؛
- الأولوية؛
- الحالة؛
- المدى الزمني.
يُطبَّق الـ scope على جانب الخادم، وهو ليس مجرّد مرشّح في الواجهة.
وهذا مهمّ من أجل:
- الأمن؛
- الفصل بين المسؤوليات؛
- صحّة قيم KPI؛
- الإدارة الإقليمية؛
- التوسّع؛
- منع تسرّب البيانات بين الأقسام.
مواضيع ذات صلة
هل كانت هذه الصفحة مفيدة؟
شكرًا على ملاحظاتك!