Postes de travail et écrans
Postes de travail par rôle pour les directeurs, les responsables de zone, les ingénieurs, les métrologues et la sécurité, écrans principaux de l'Operations Center et manière dont le scope appliqué côté serveur détermine ce que voit chaque profil.
Postes de travail par rôle
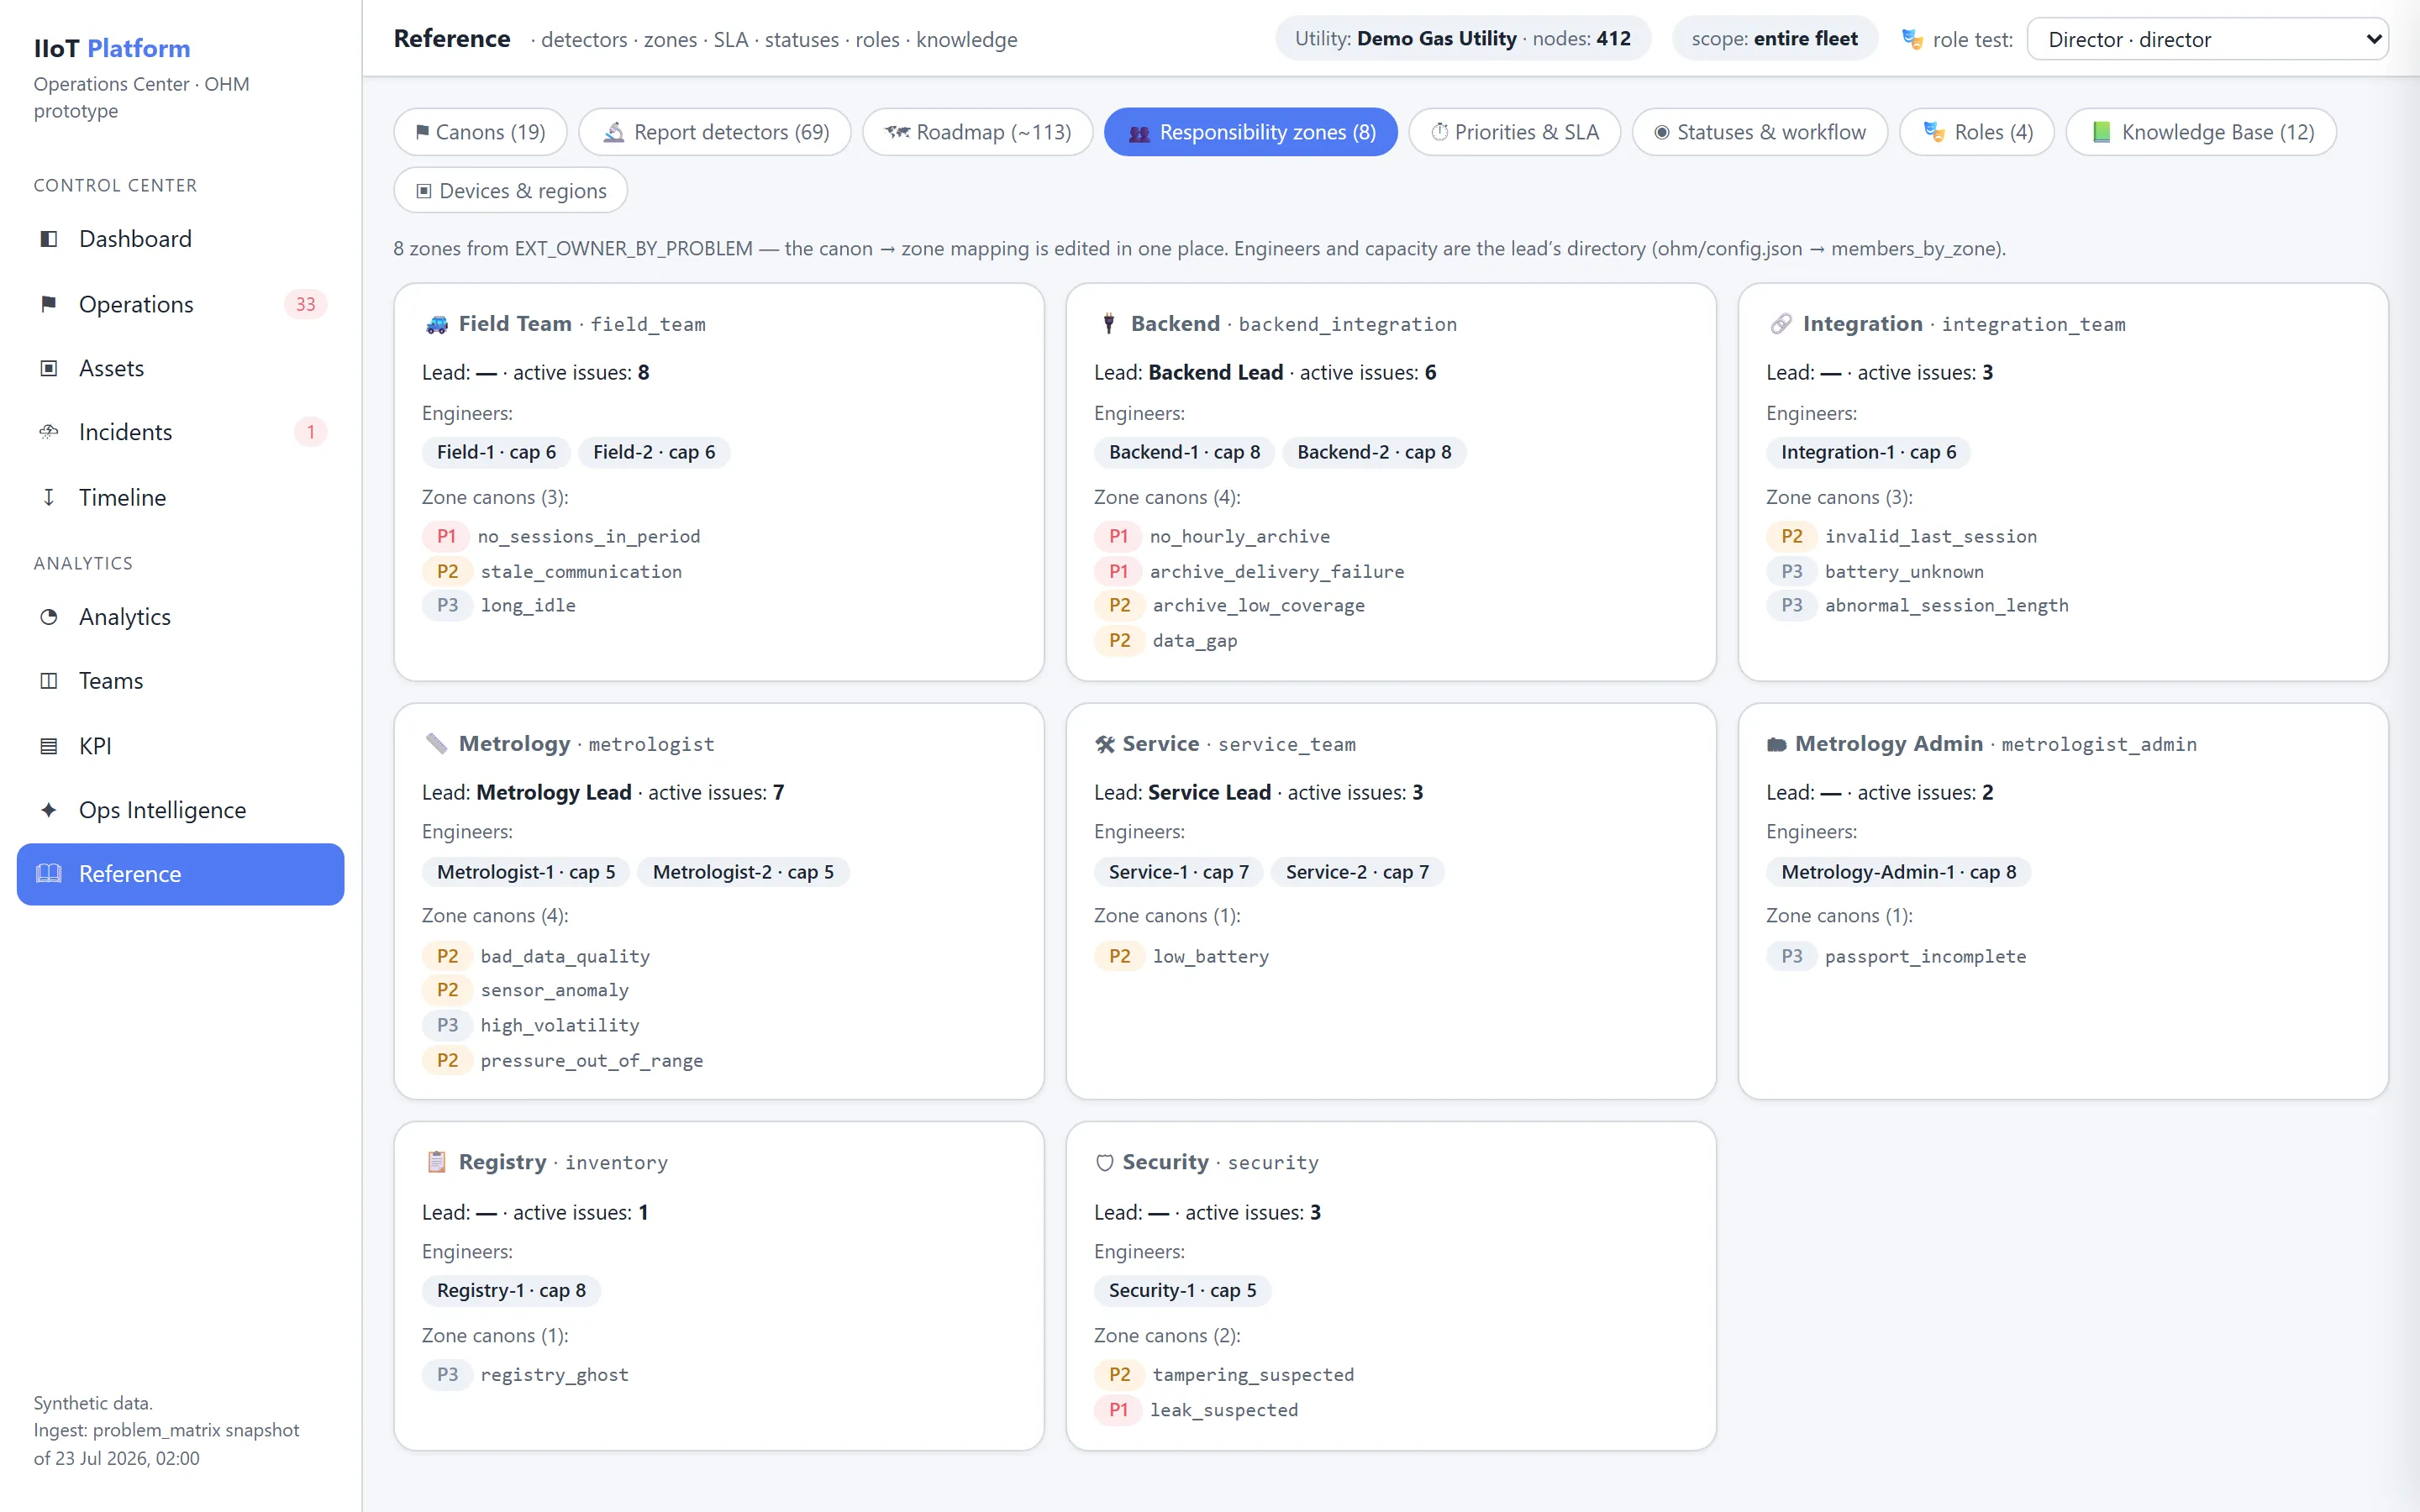
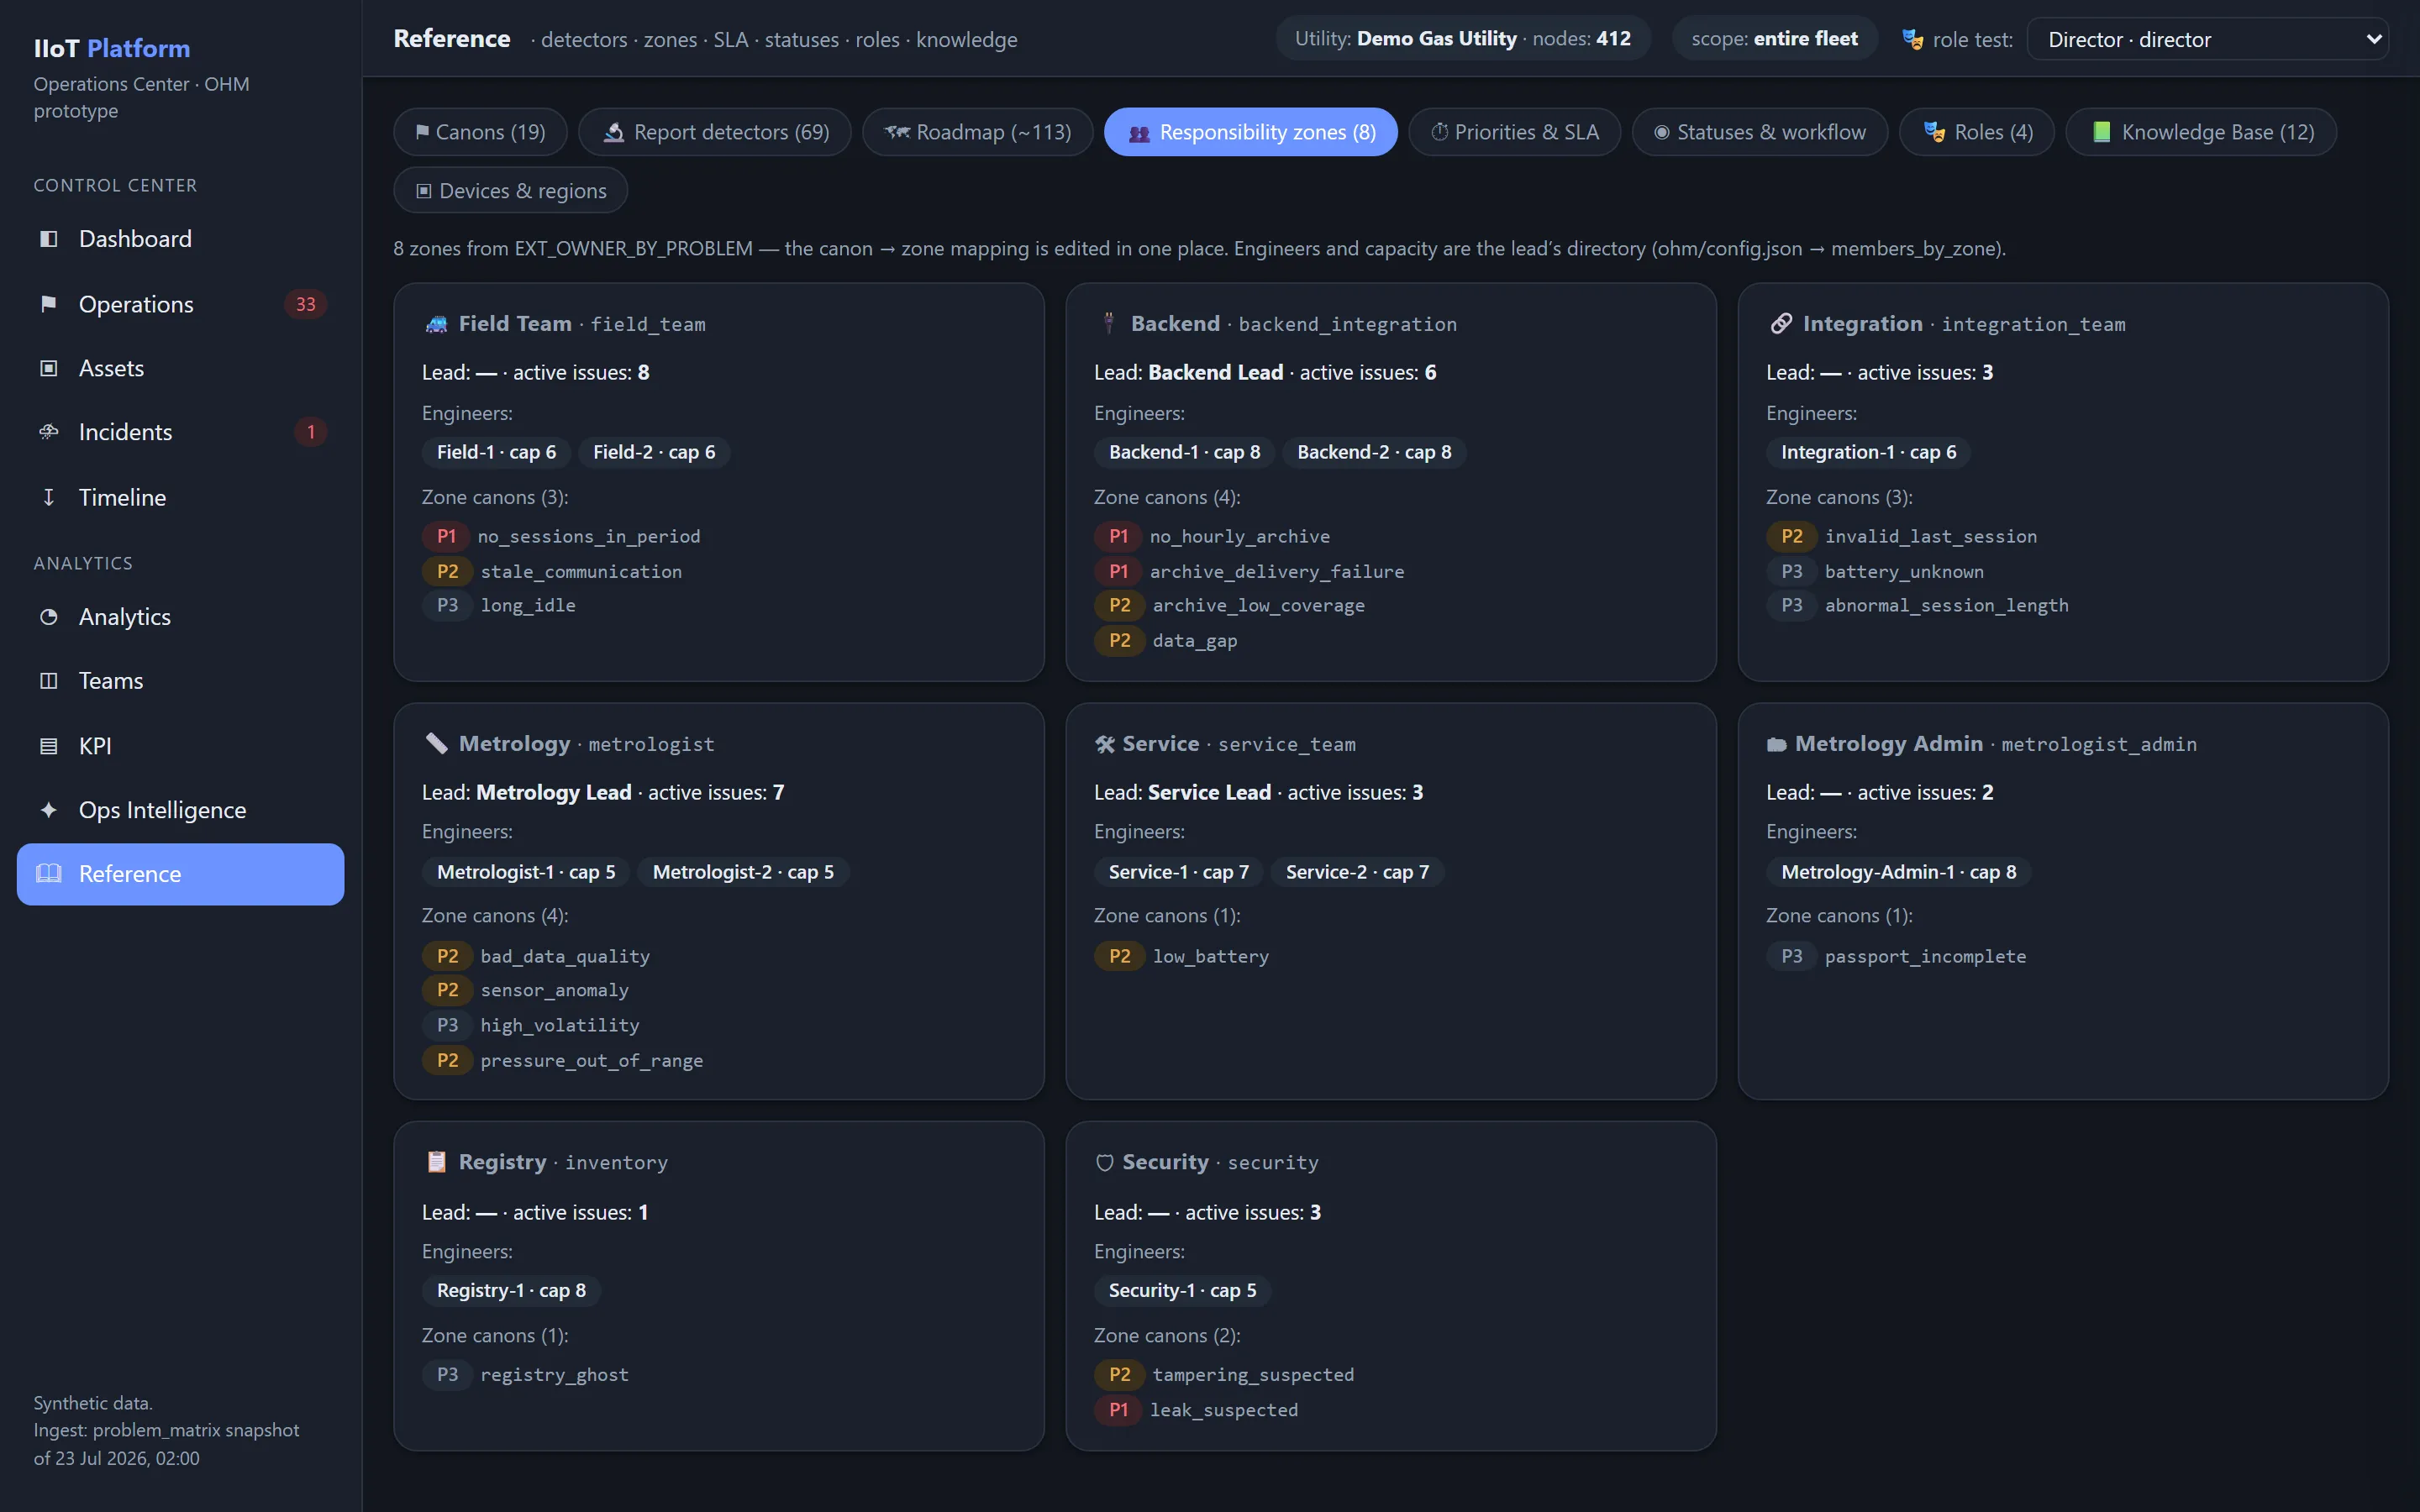
OHM adapte l’interface, les indicateurs et les jeux de données au rôle de l’utilisateur.
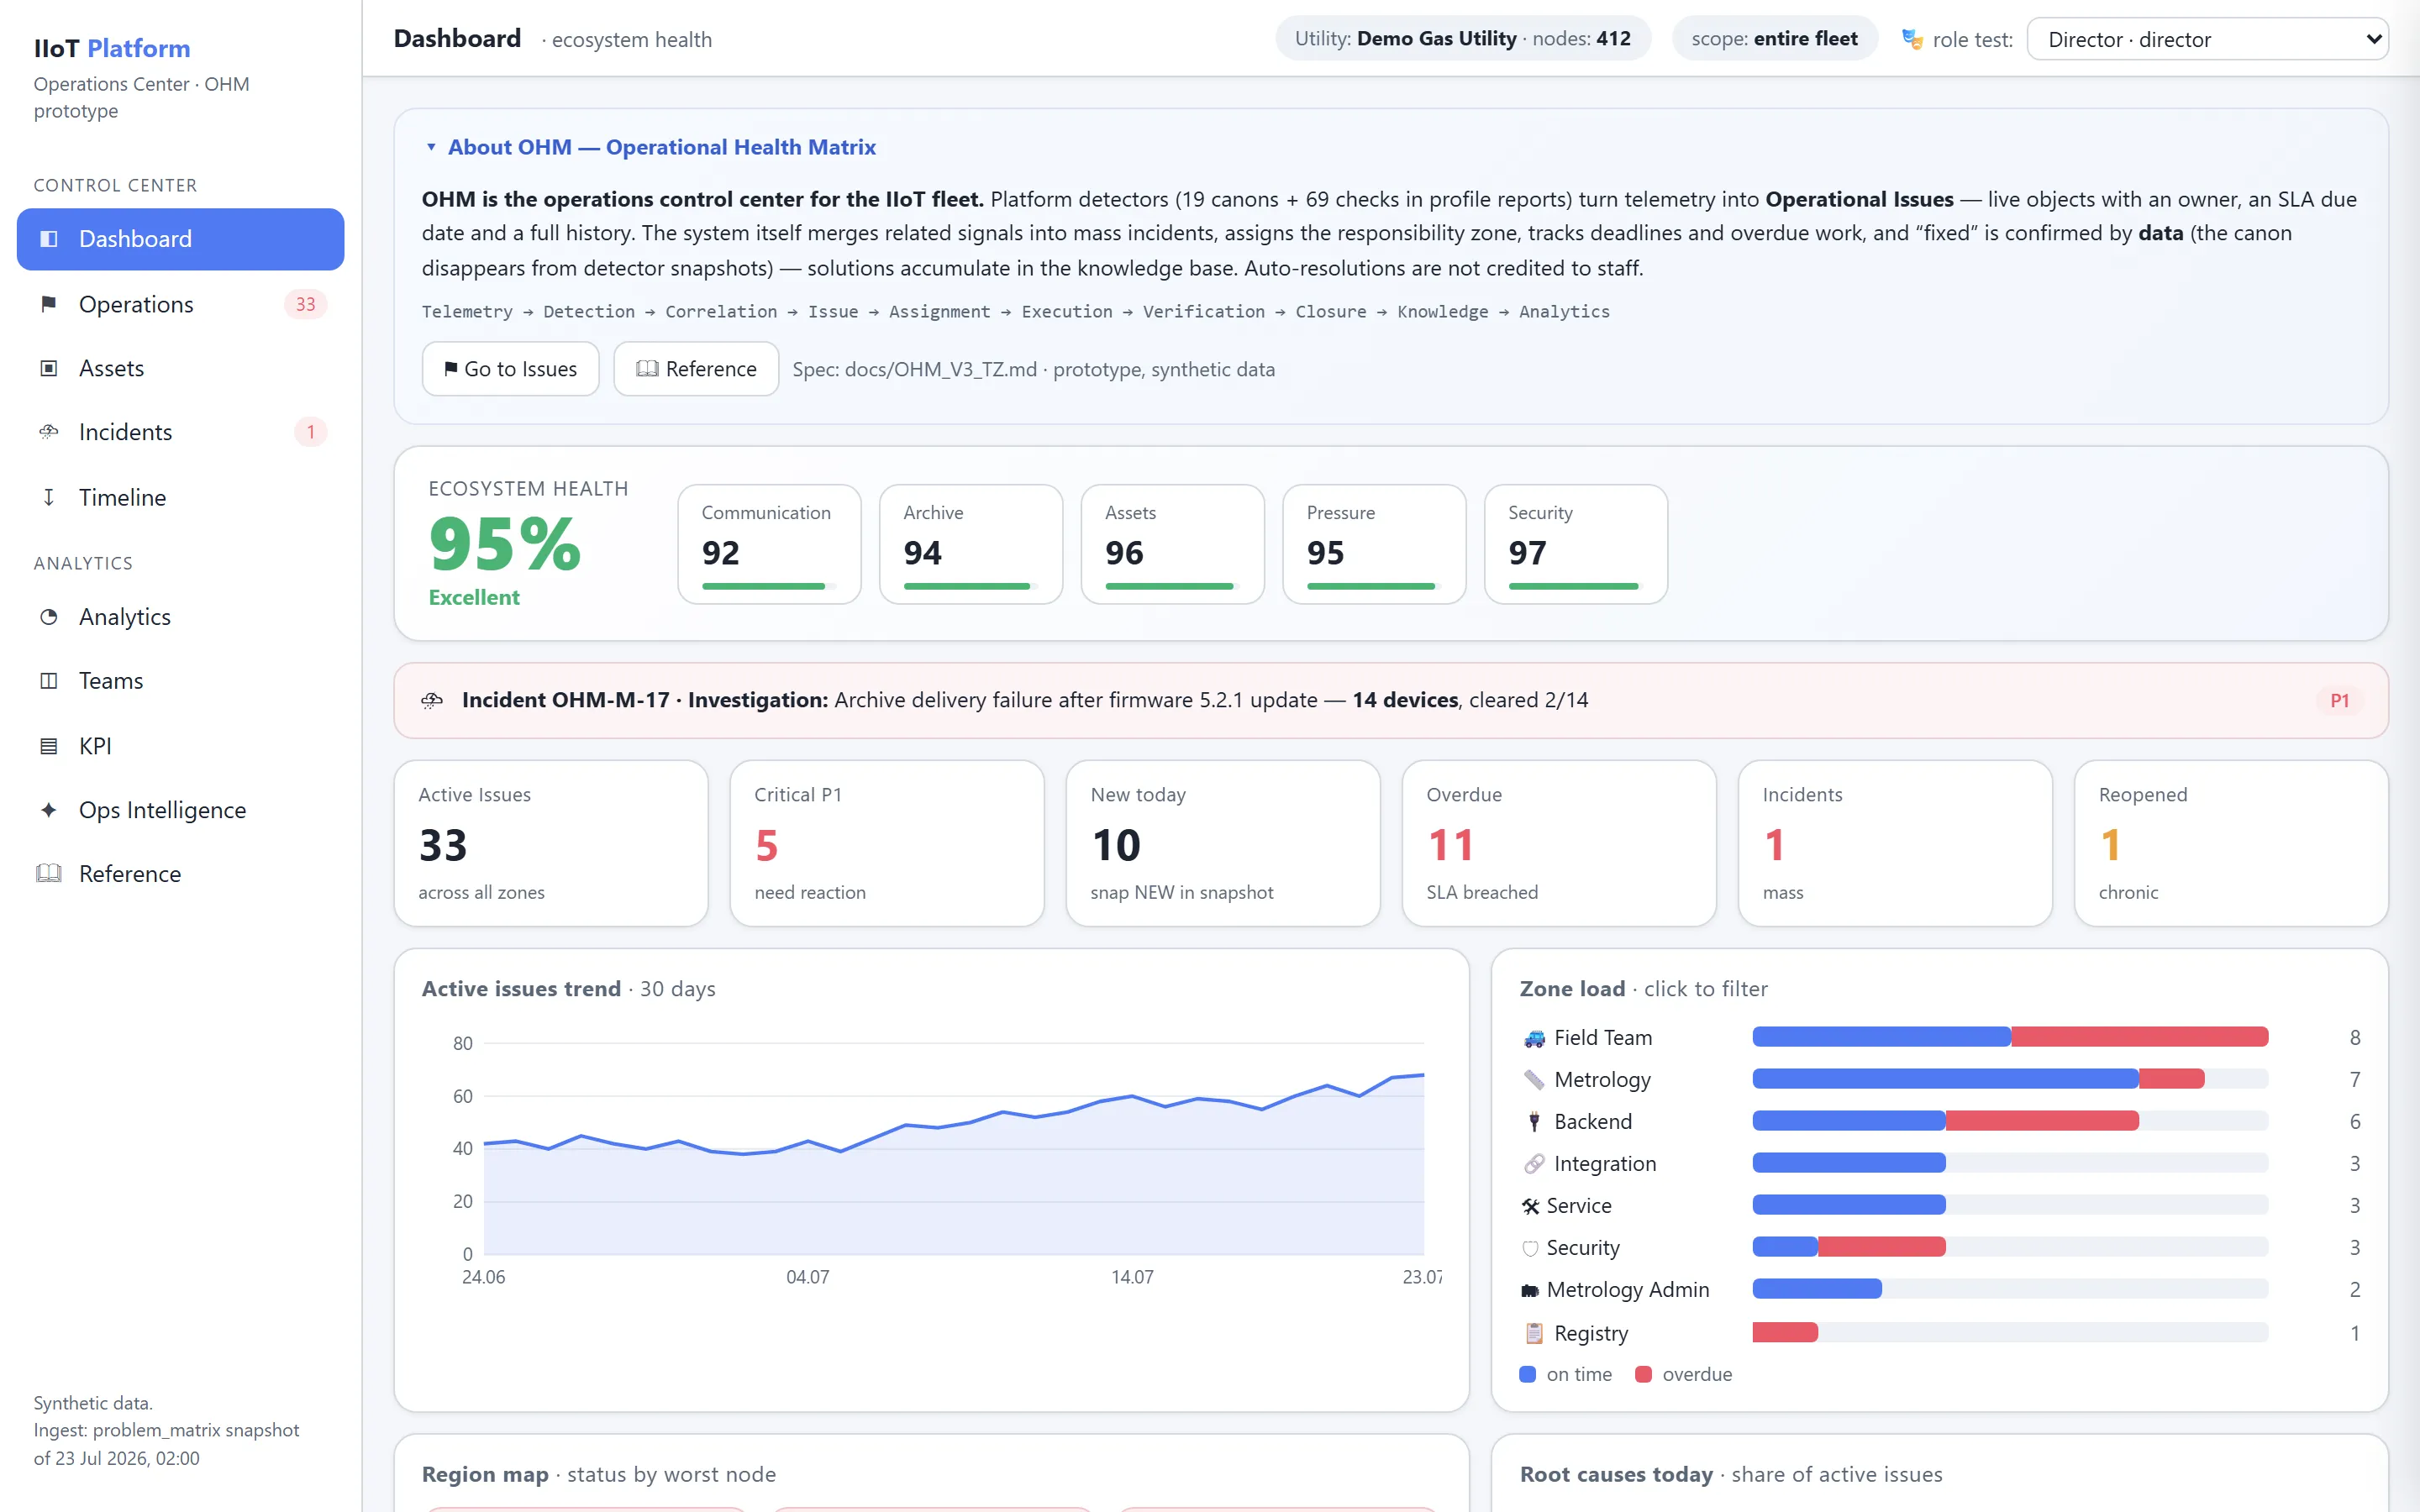
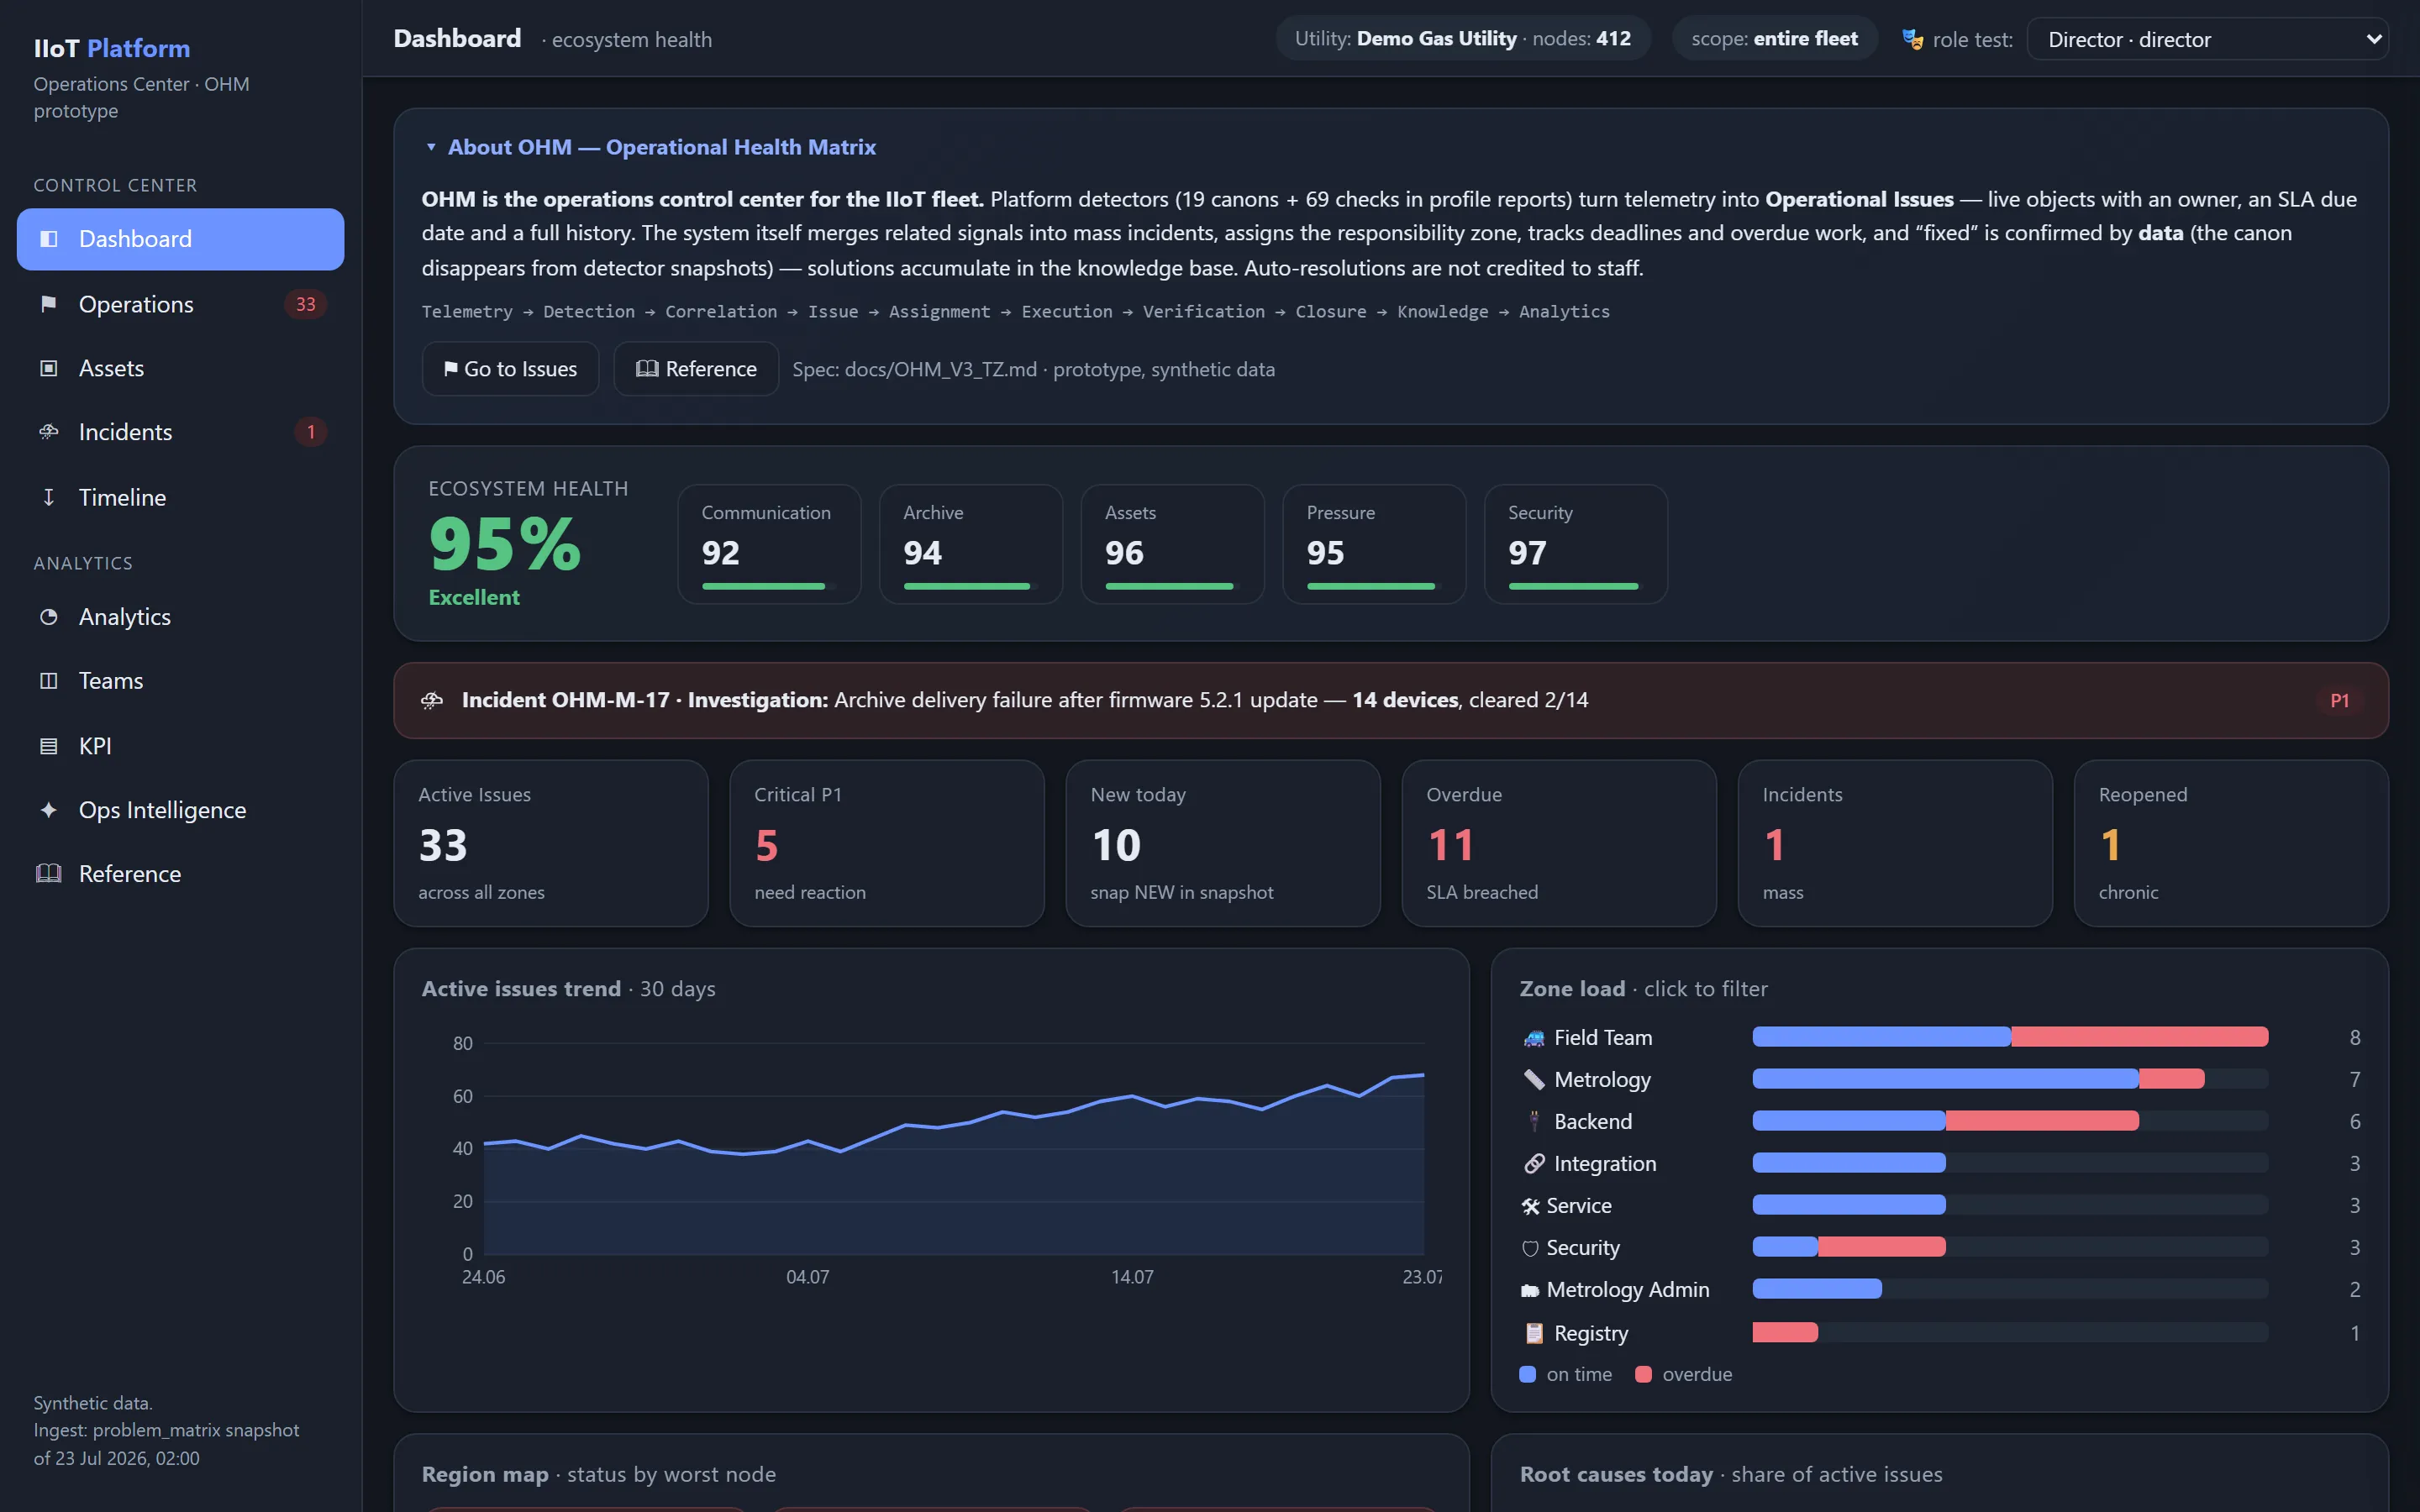
Directeur
Voit :
- Ecosystem Health ;
- Issues critiques ;
- incidents massifs ;
- violations de SLA ;
- répartition par région ;
- causes racines (Root Causes) ;
- dynamique du backlog ;
- risques clés ;
- charge des services ;
- problèmes anticipés.
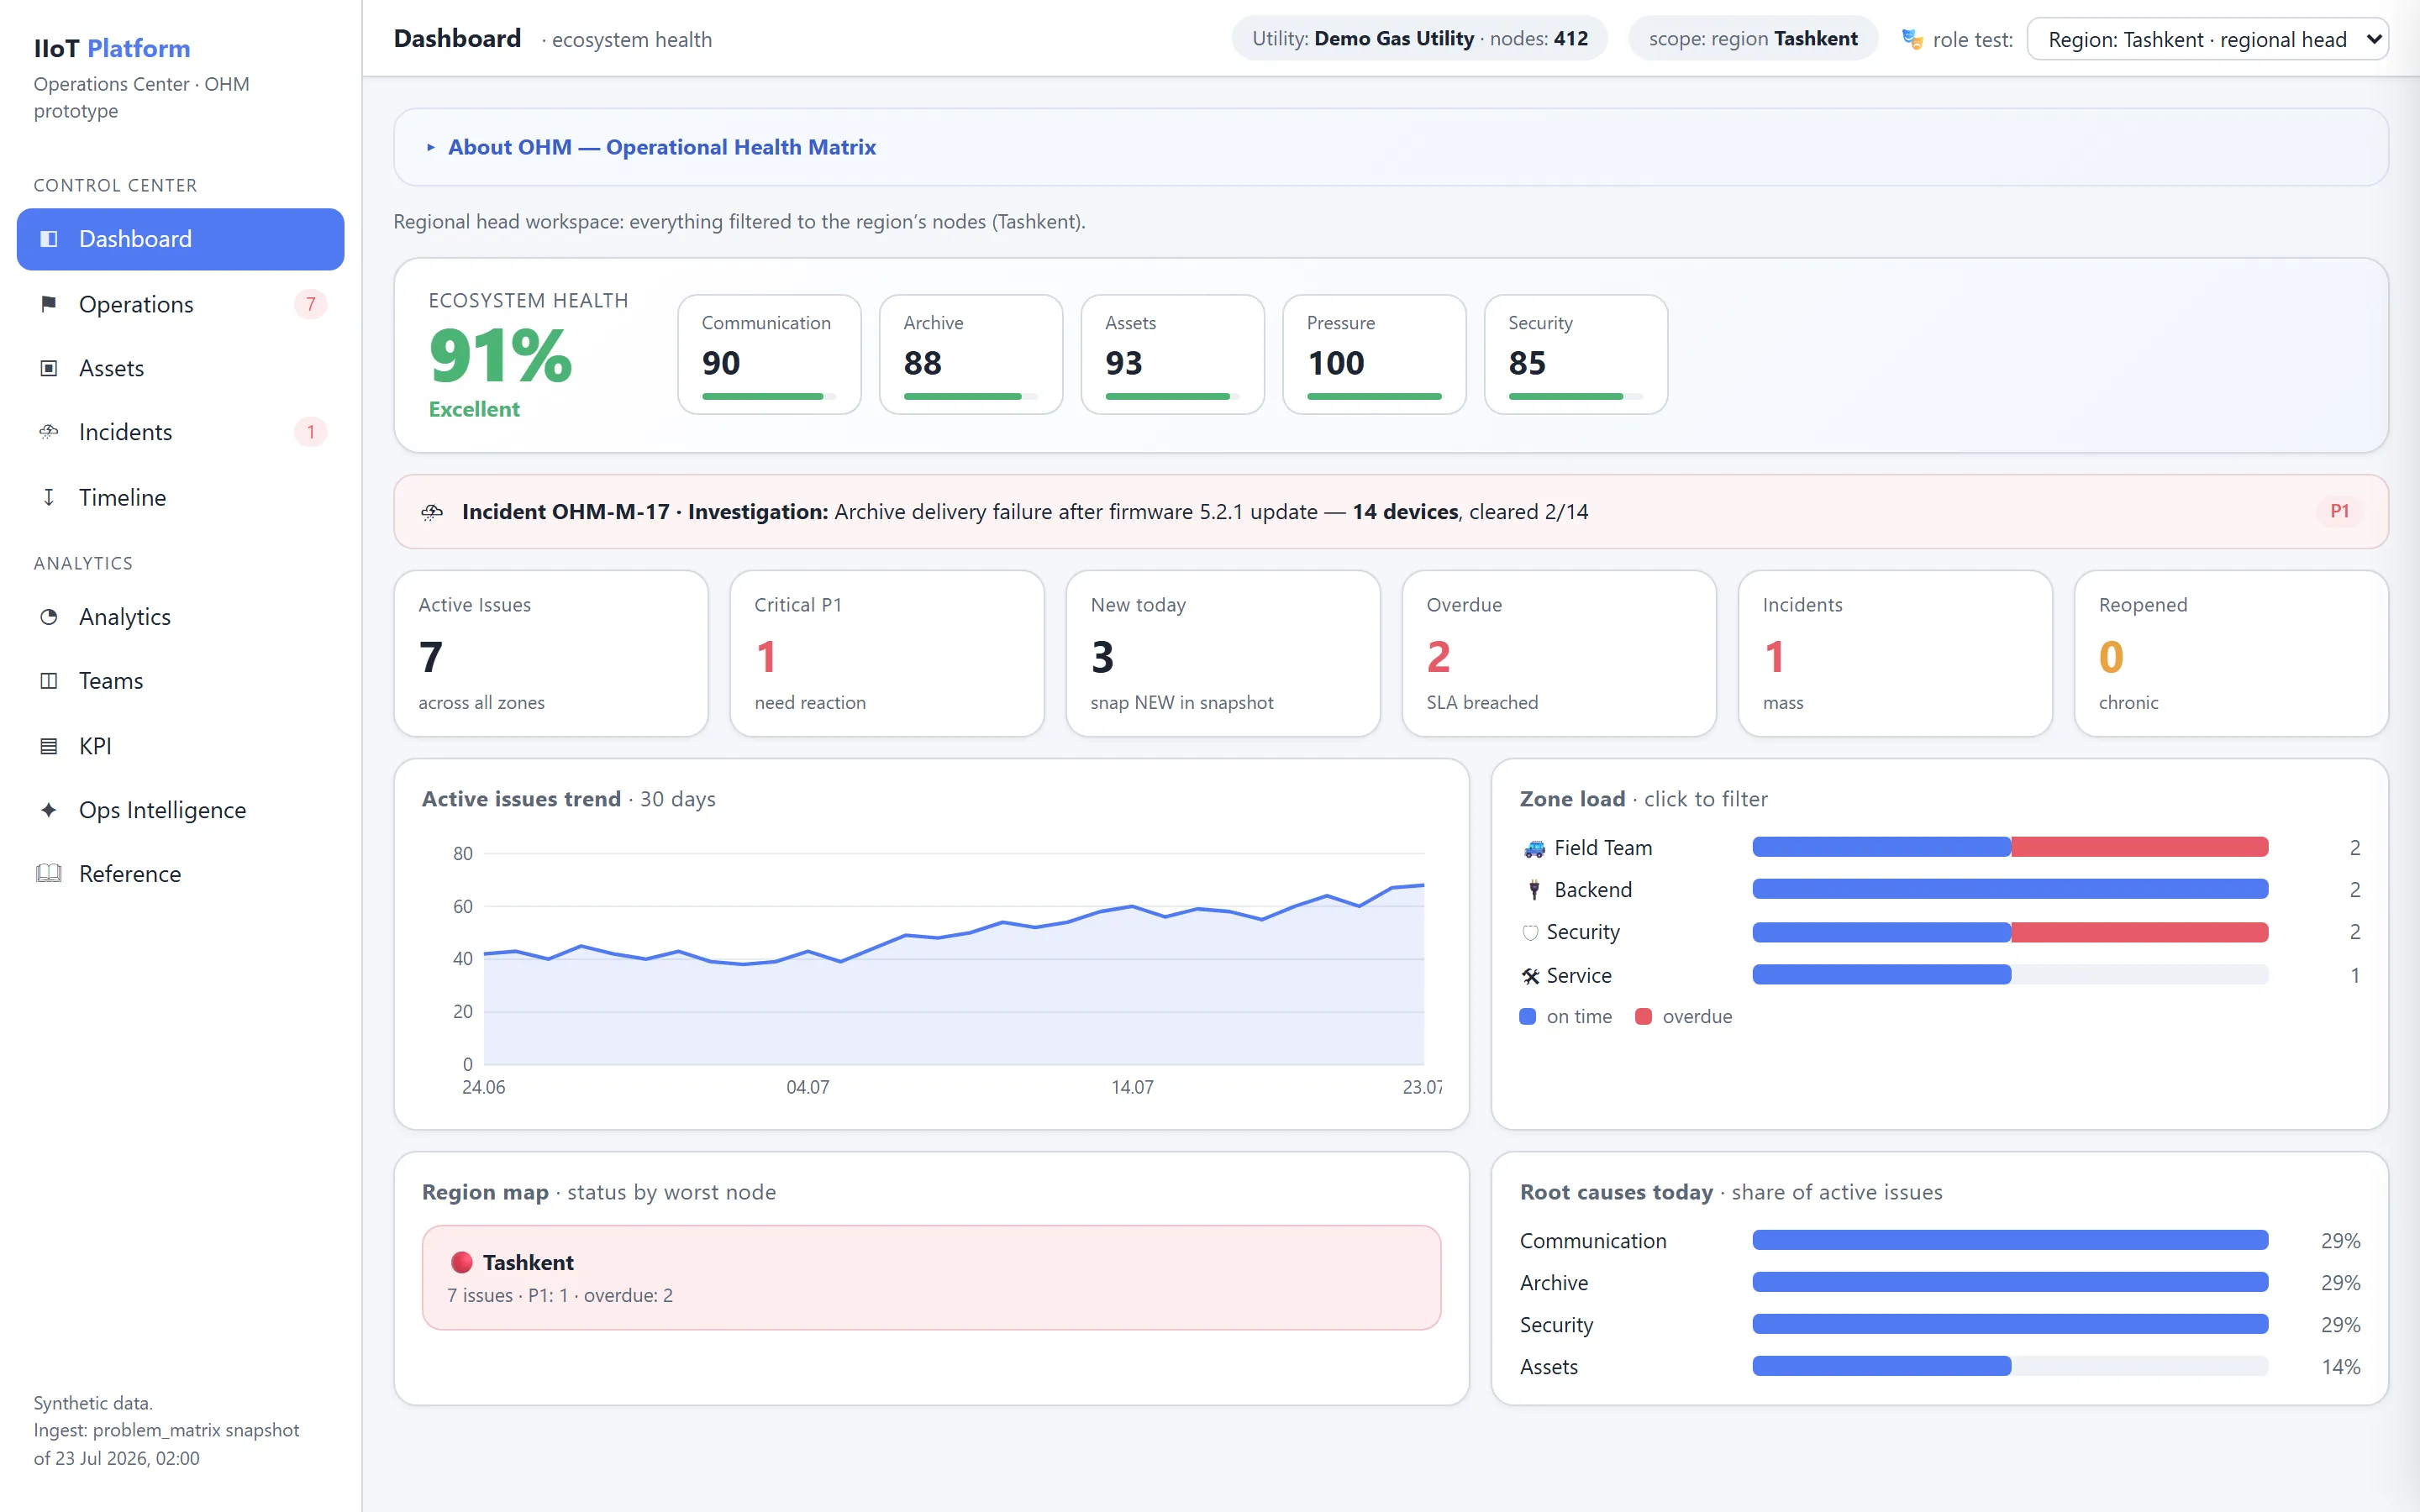
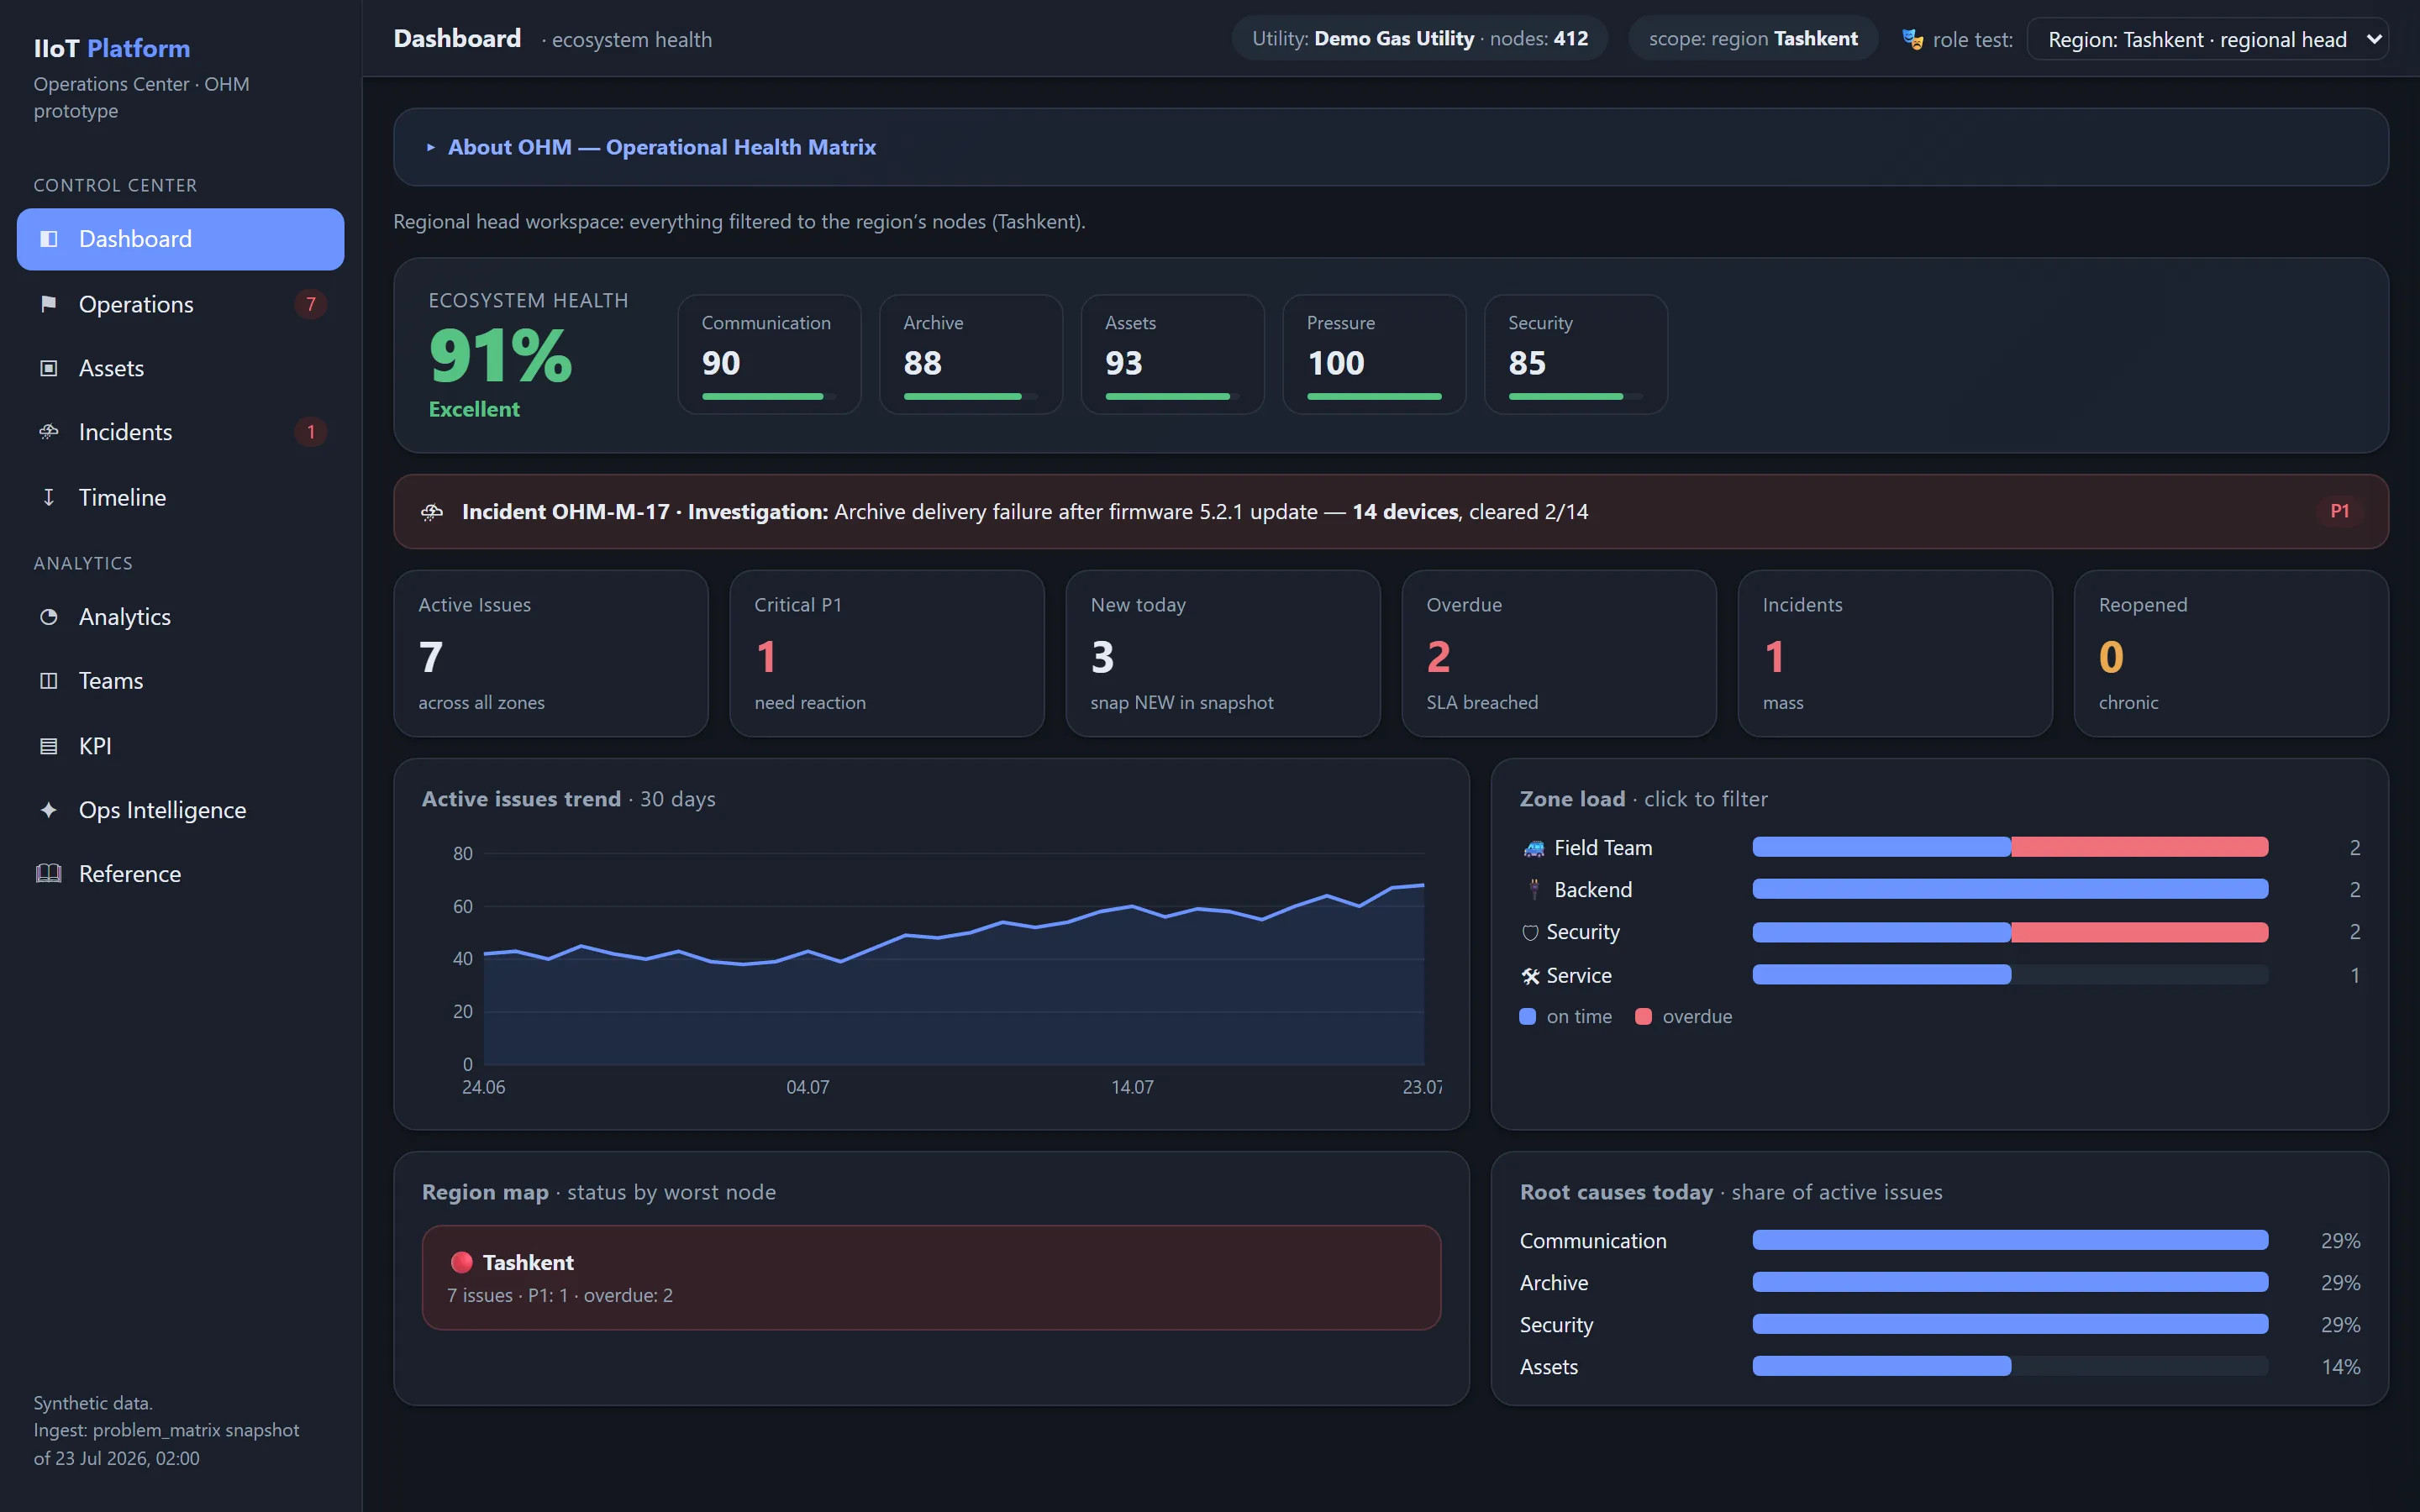
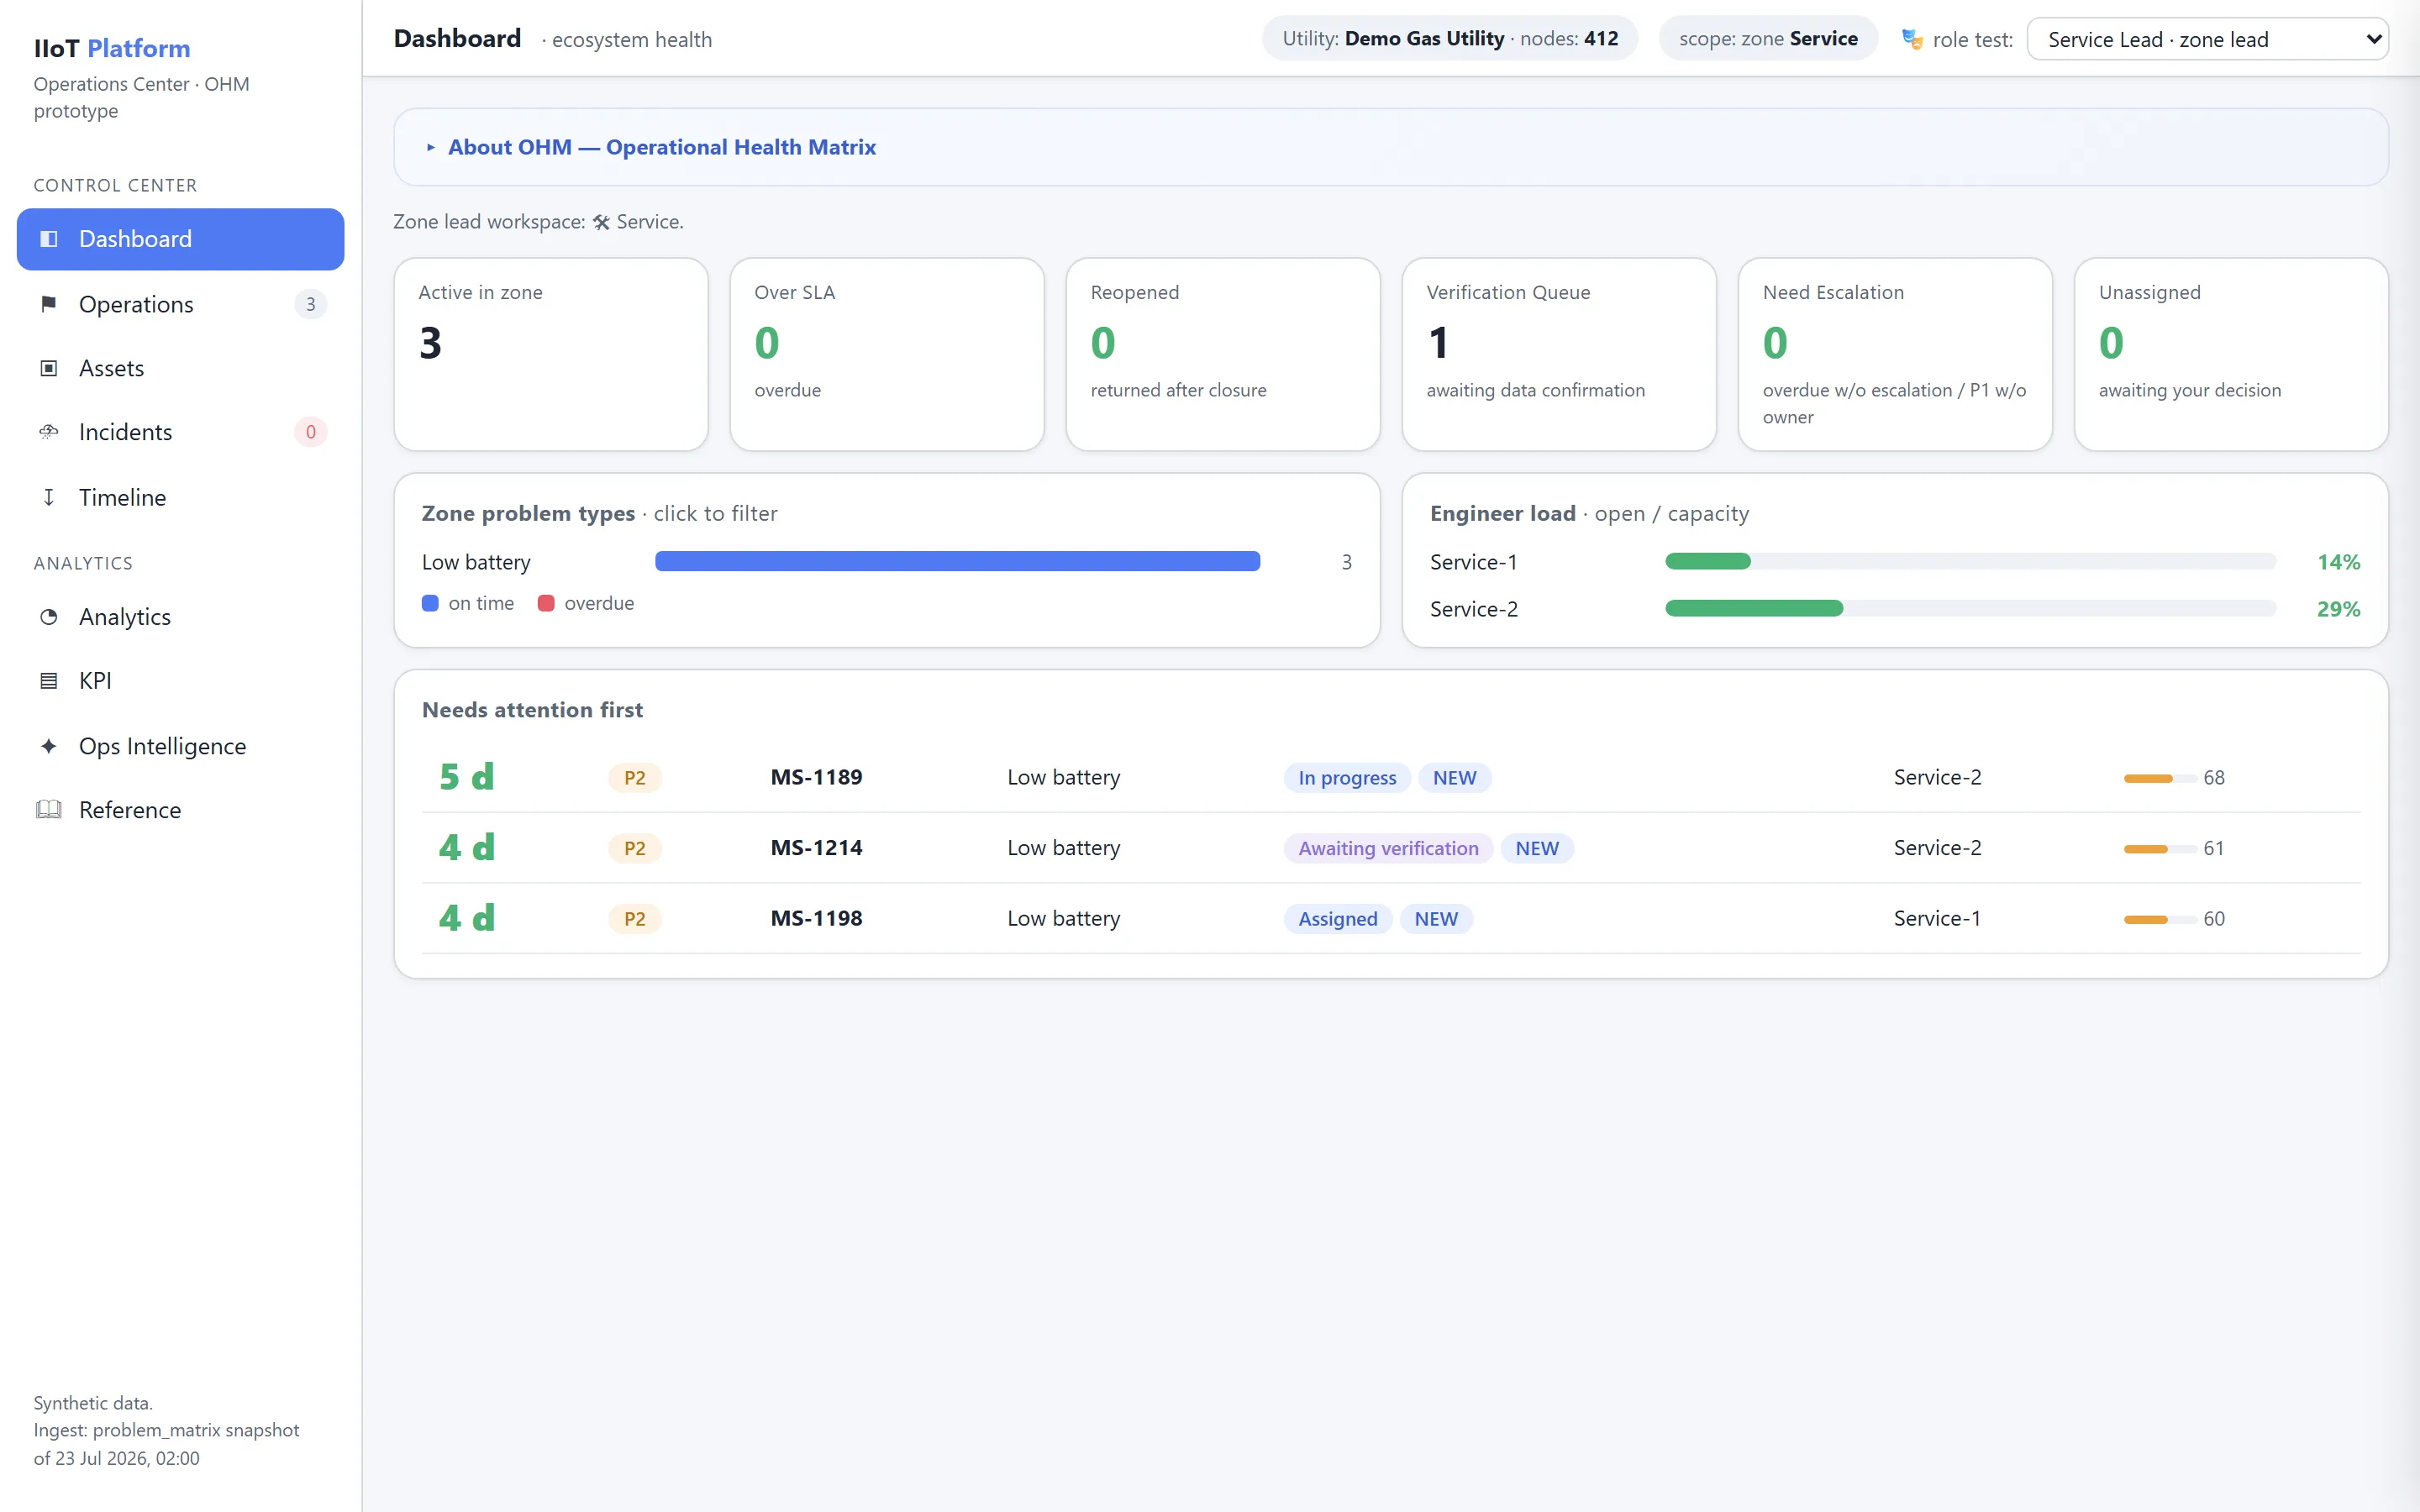
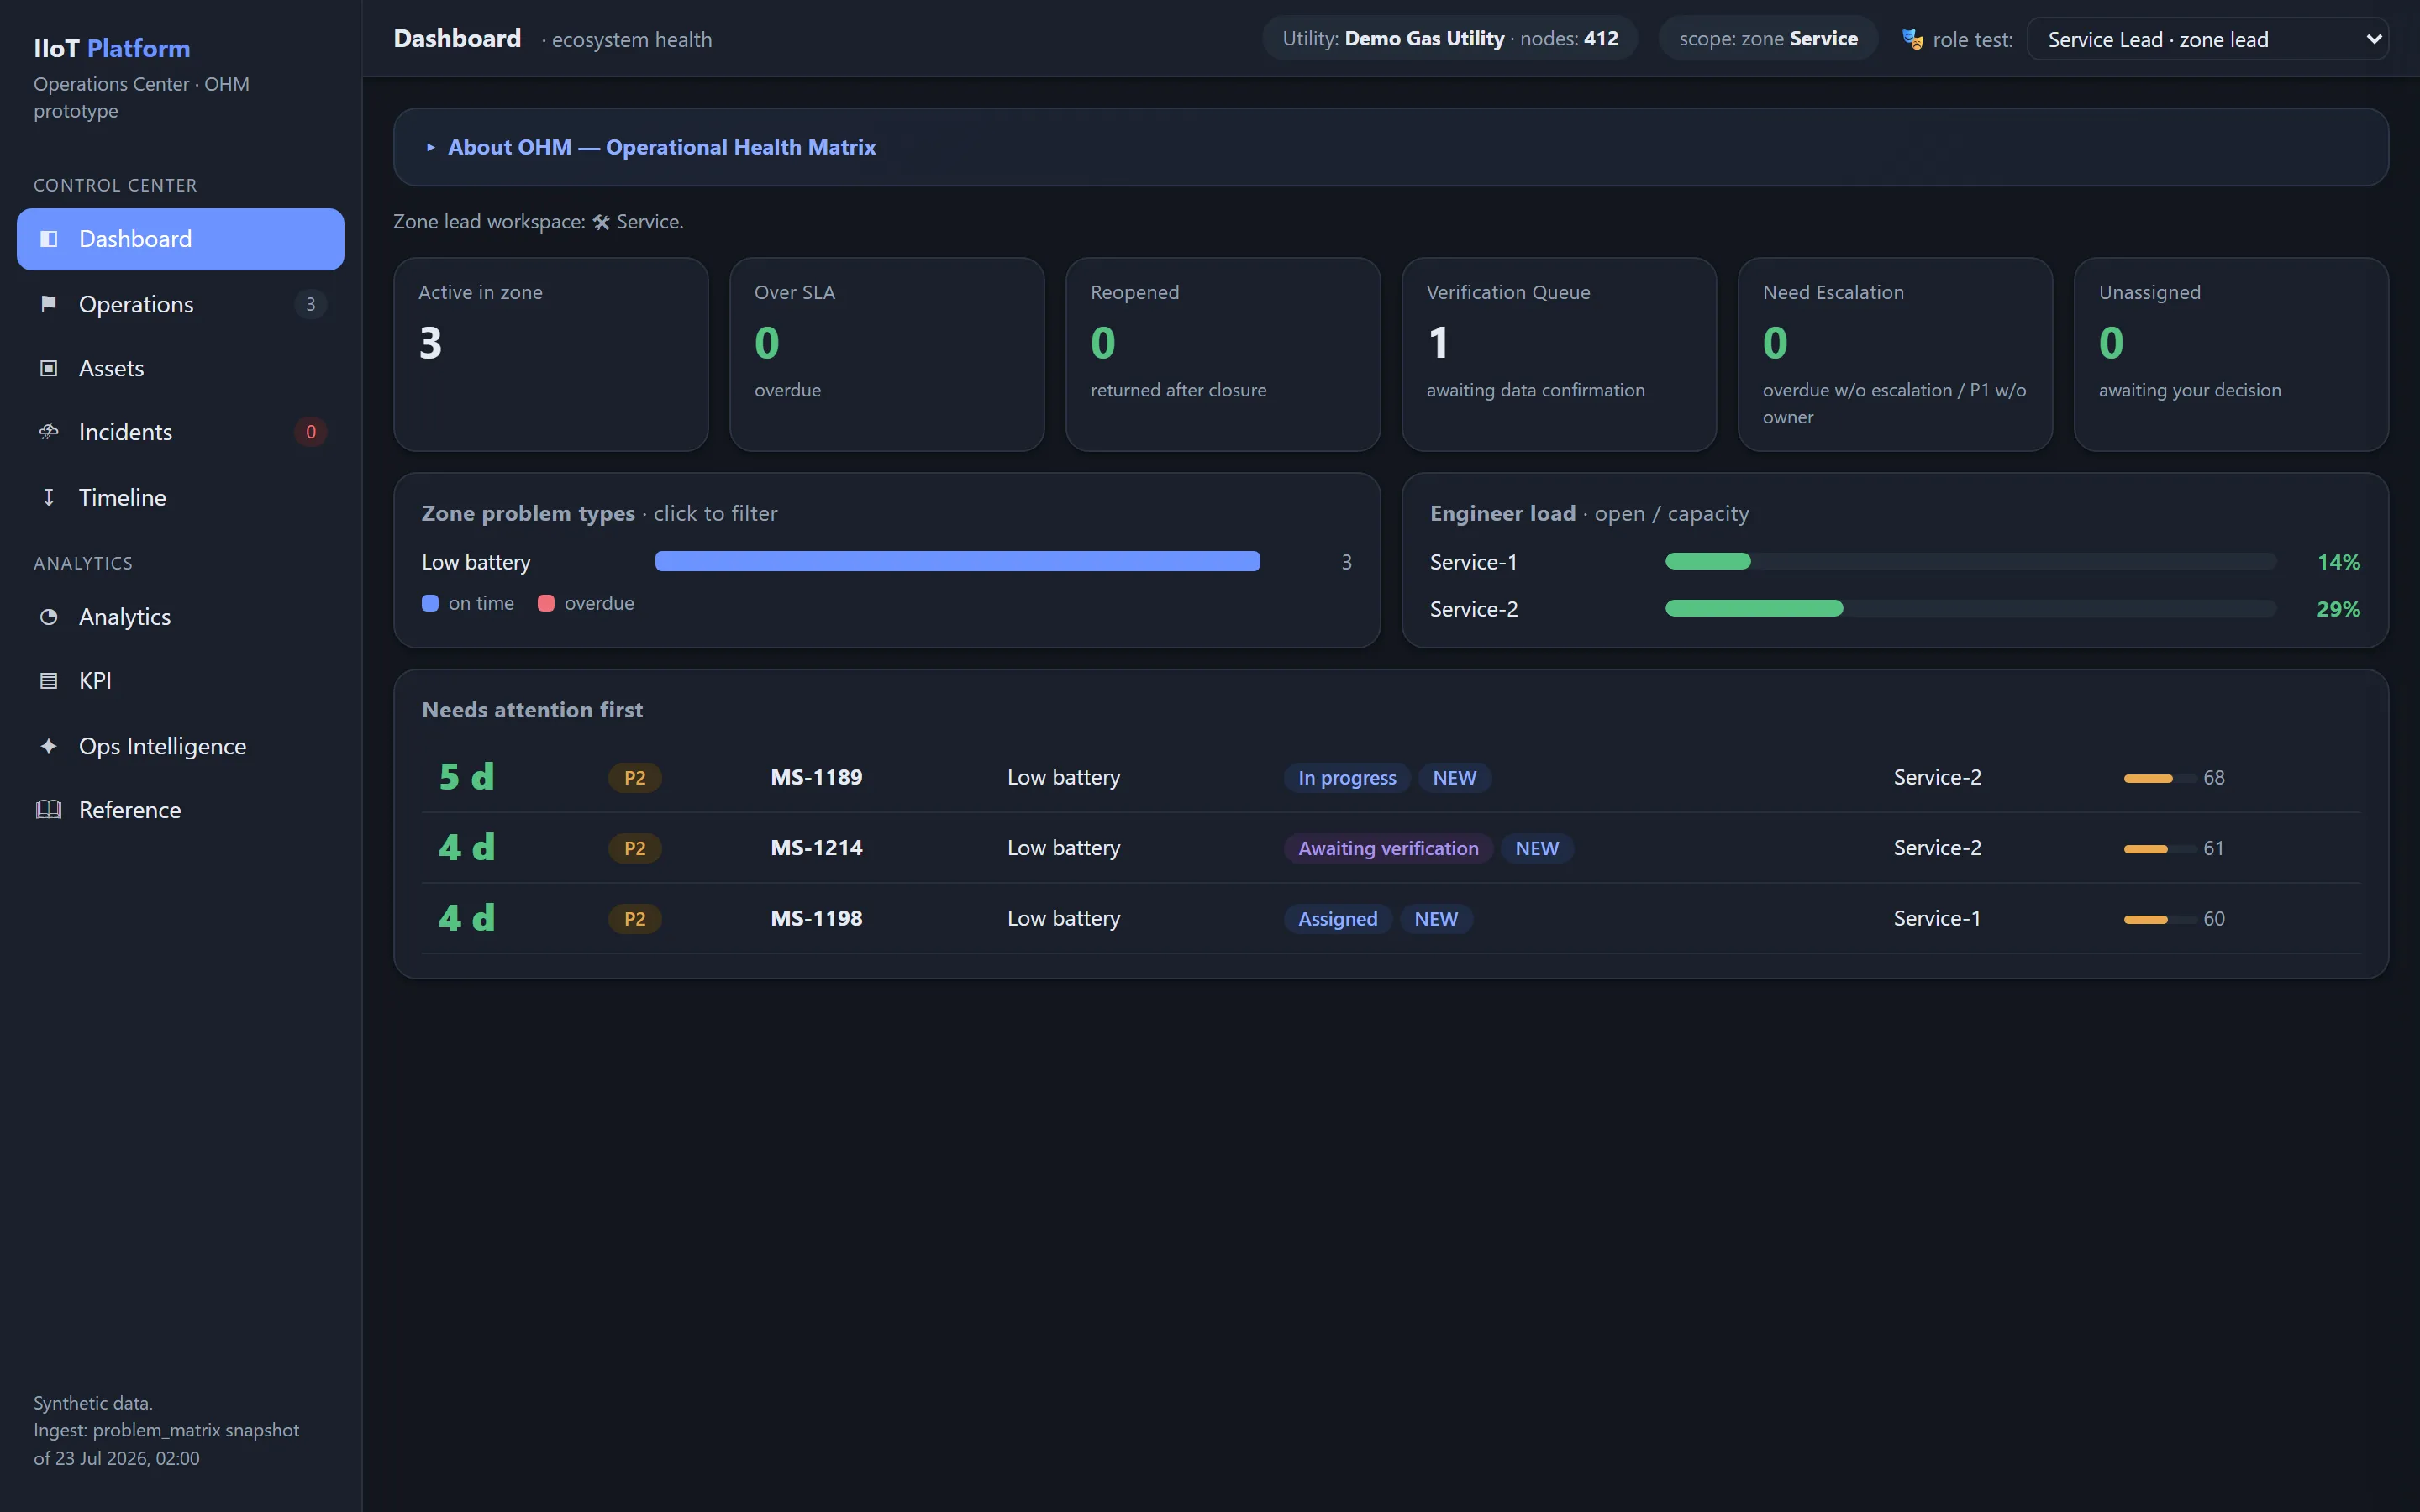
Responsable de zone
Voit :
- Issues de sa zone ;
- travaux non affectés ;
- Over SLA ;
- Reopened ;
- Verification Queue ;
- Need Escalation ;
- charge des intervenants ;
- capacité de l’équipe (capacity) ;
- efficacité des résolutions ;
- problèmes chroniques ;
- causes racines typiques.
Intervenant
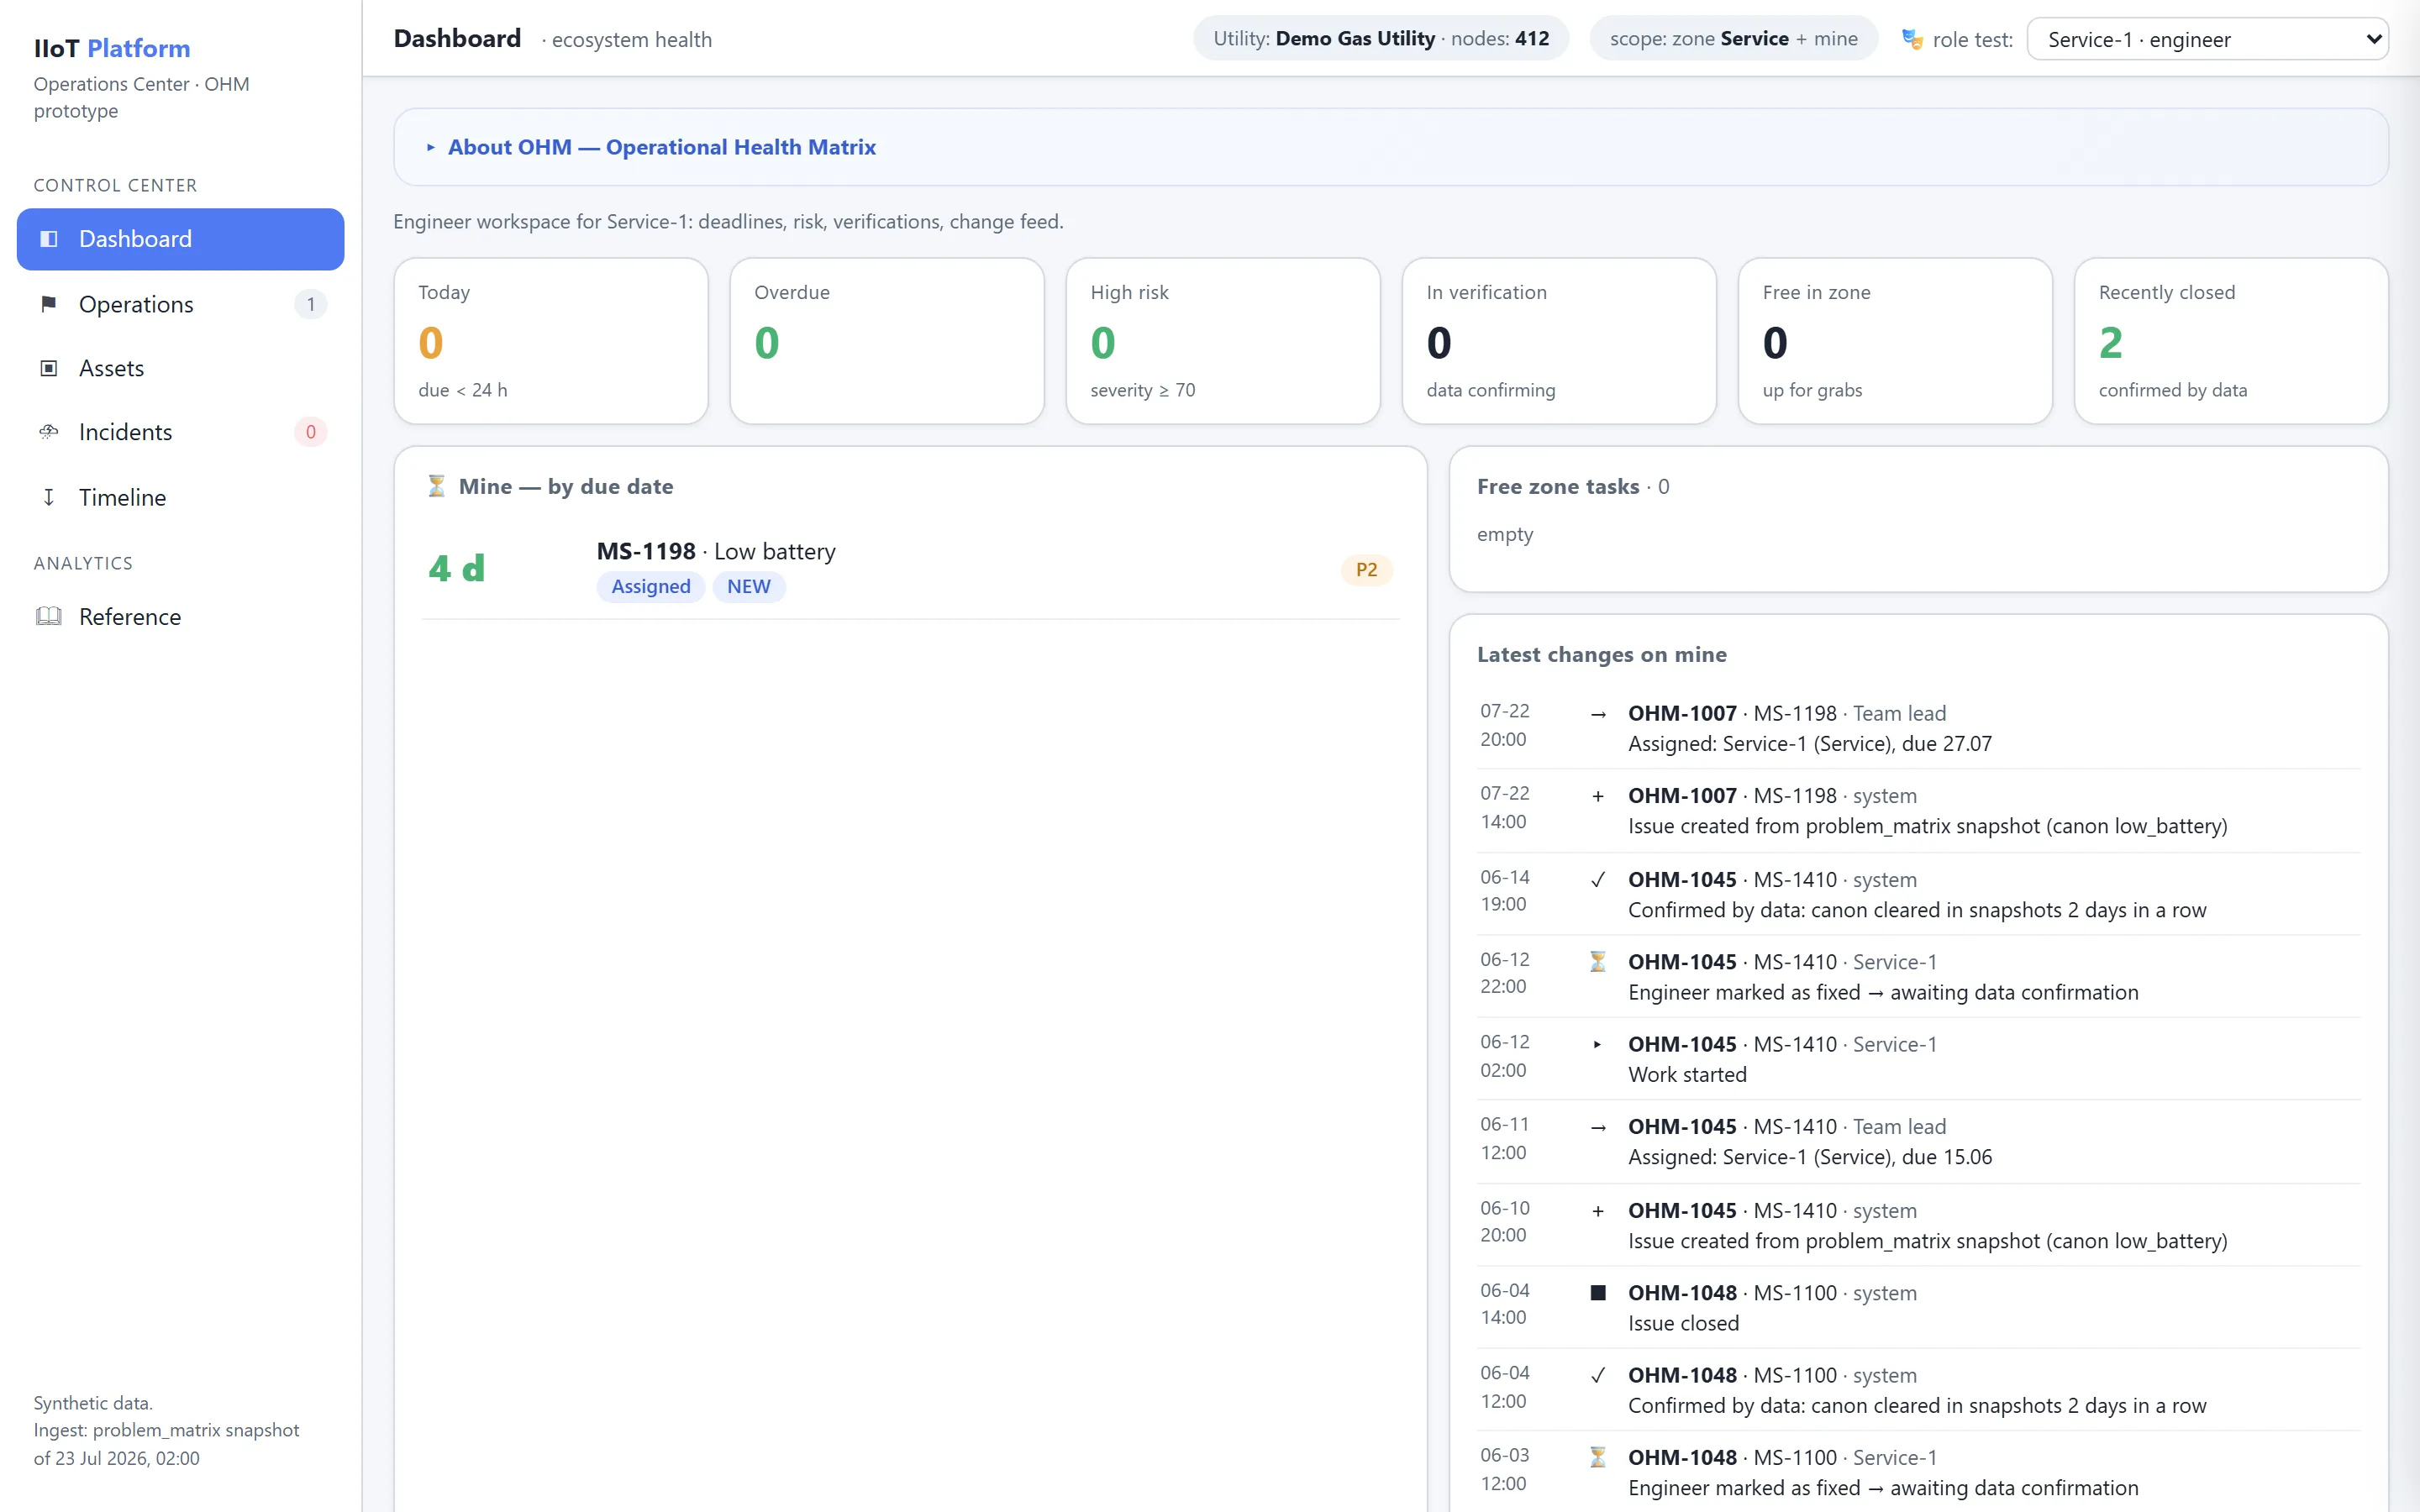
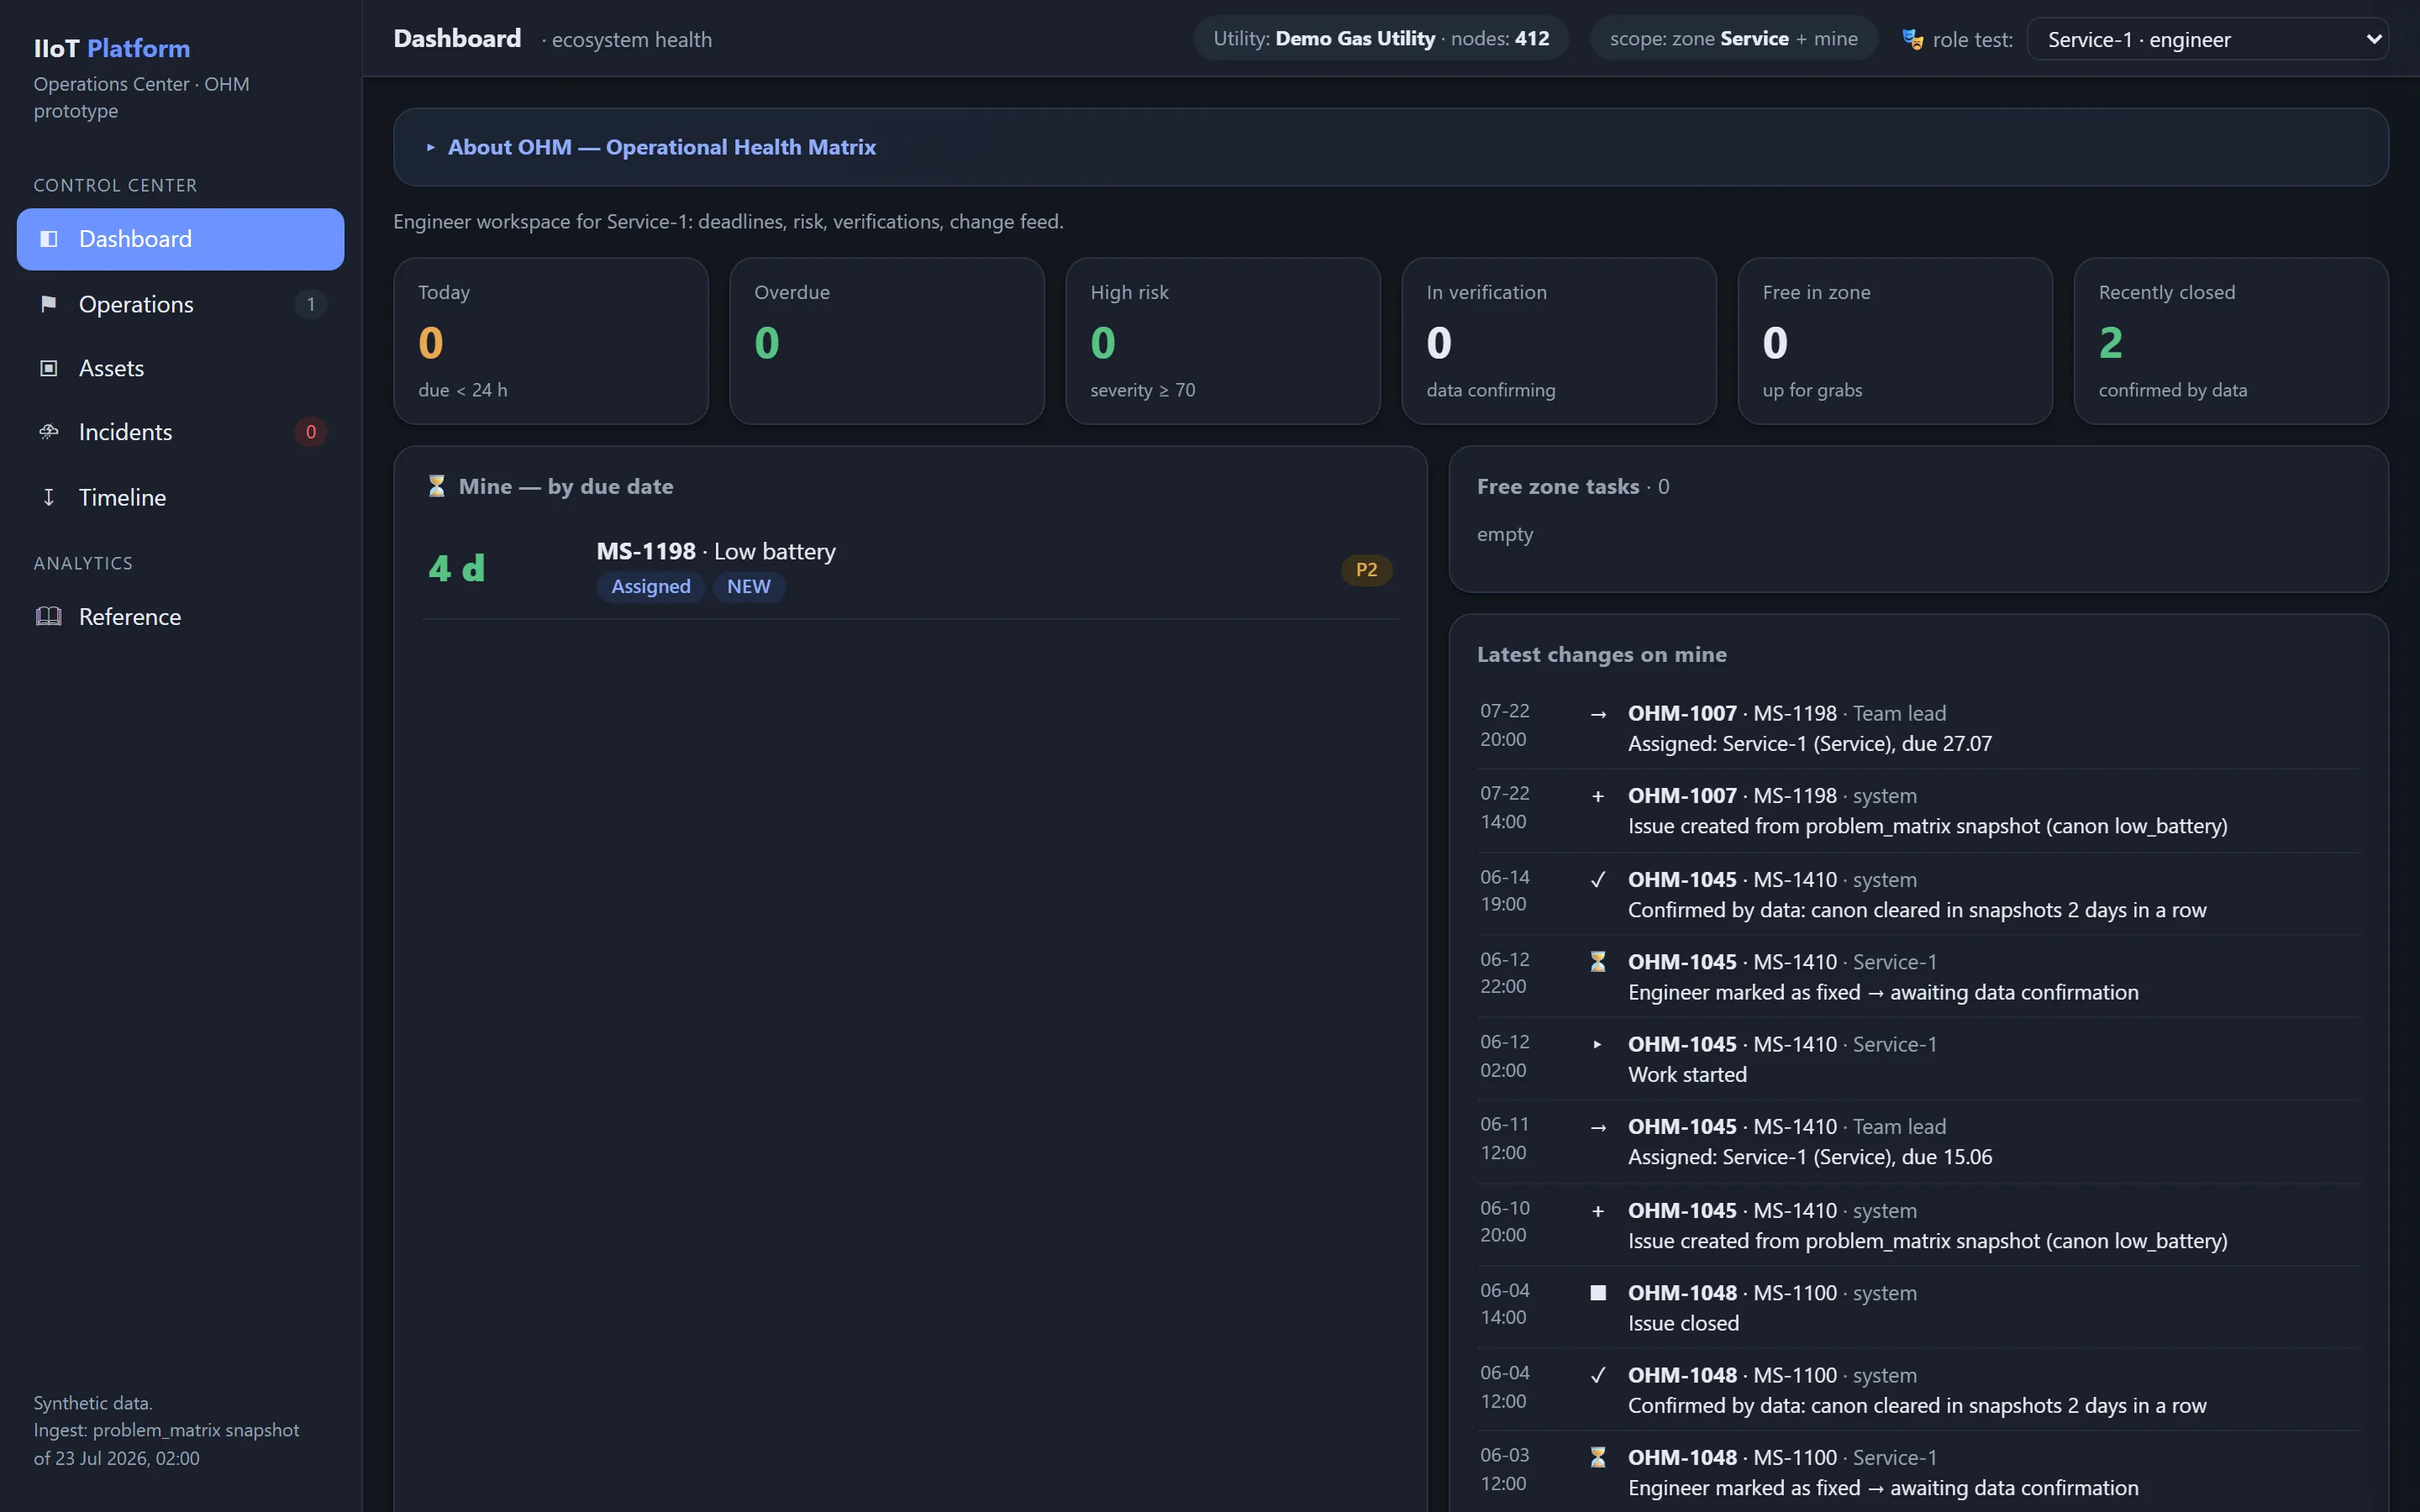
Voit :
- mes tâches actives (Tasks) ;
- échéance et
Due in; - tâches en retard ;
- tâches à risque élevé ;
- tâches en attente de vérification ;
- commentaires ;
- changements récents ;
- articles KB recommandés ;
- cas similaires clôturés avec succès.
Métrologue
Voit en complément :
- problèmes de passeport ;
- cohérence physique des données ;
- anomalies des capteurs ;
- vérification des actions métrologiques ;
- Evidence provenant des rapports spécialisés ;
- historique des remplacements et des étalonnages.
Rôle sécurité
Ne voit que le contexte autorisé :
- signaux d’intégrité ;
- actions anormales ;
- changements de configuration ;
- incidents de sécurité confirmés ;
- journal des accès ;
- chaîne d’Evidence.
Les données sensibles et les Evidence forensiques sont restreintes par des politiques d’accès.
Écrans principaux
Tableau de bord (Dashboard)
Le Dashboard présente la santé de l’écosystème et le contexte opérationnel :
- Overall Health Score ;
- Communication Health ;
- Archive Health ;
- Asset Health ;
- Pressure Health ;
- Security Health ;
- Critical Issues ;
- New Today ;
- Overdue ;
- Massive Incidents ;
- SLA Violations ;
- Root Cause Distribution ;
- carte régionale ;
- tendance ;
- Operations Feed.
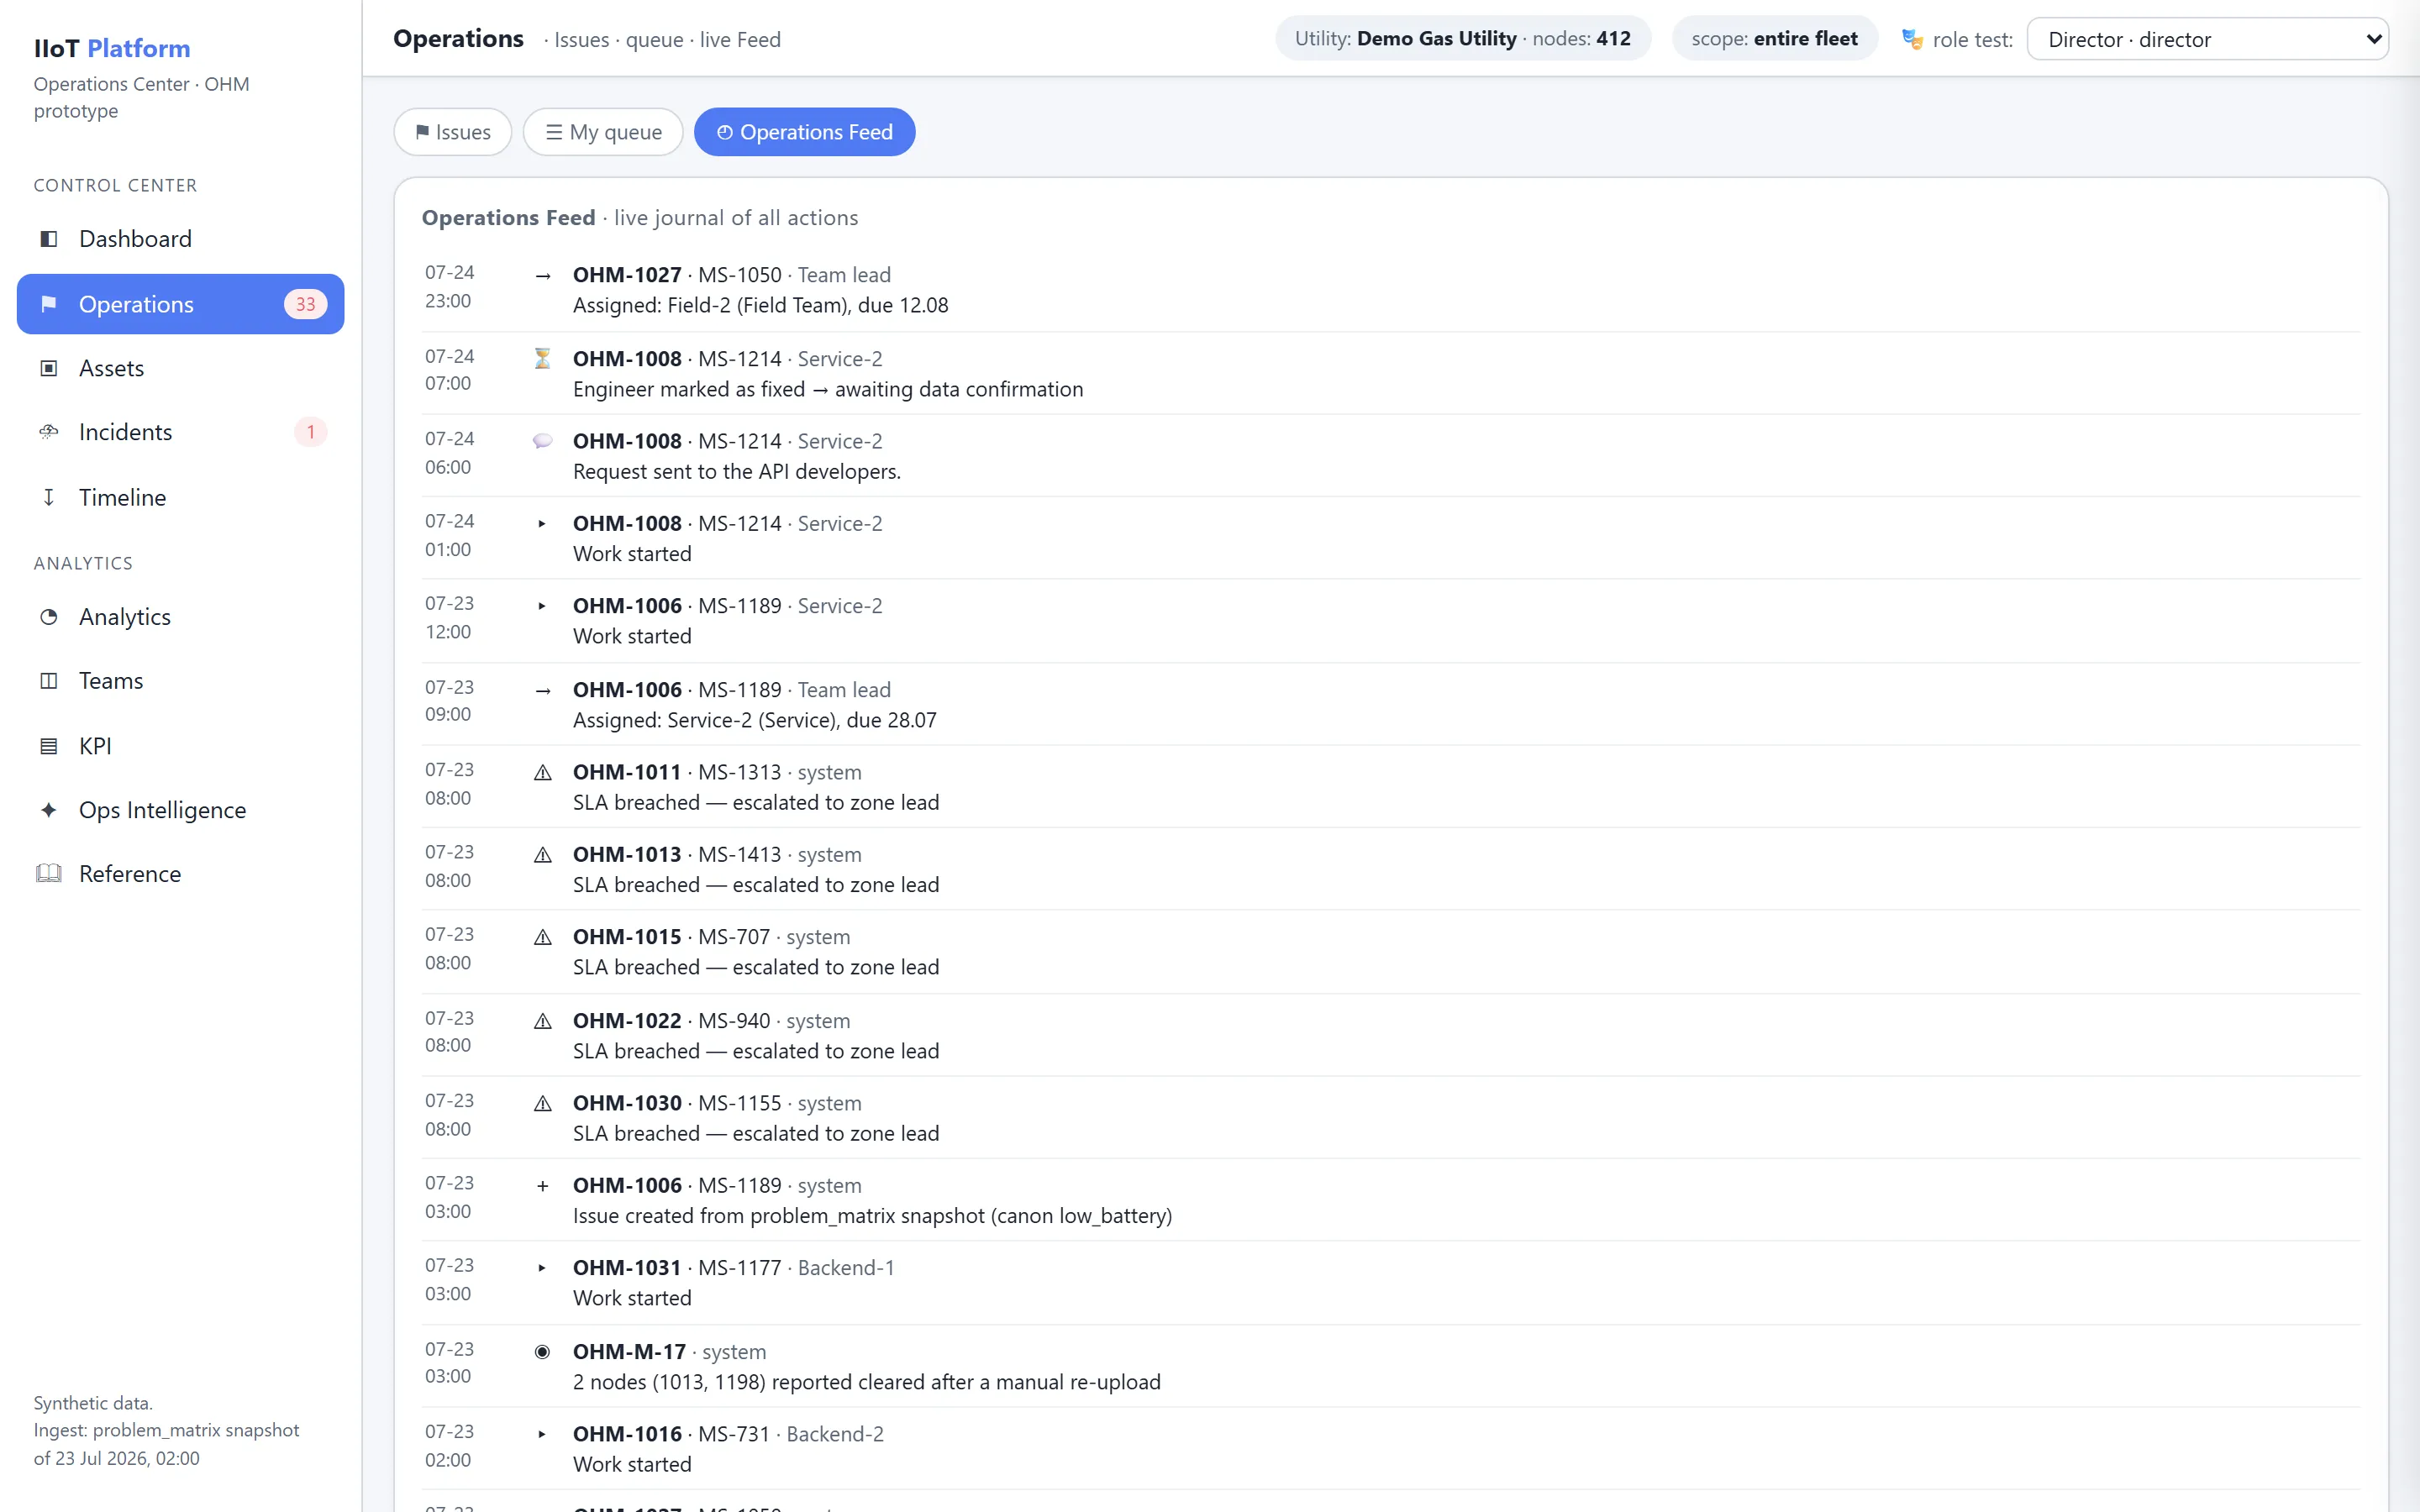
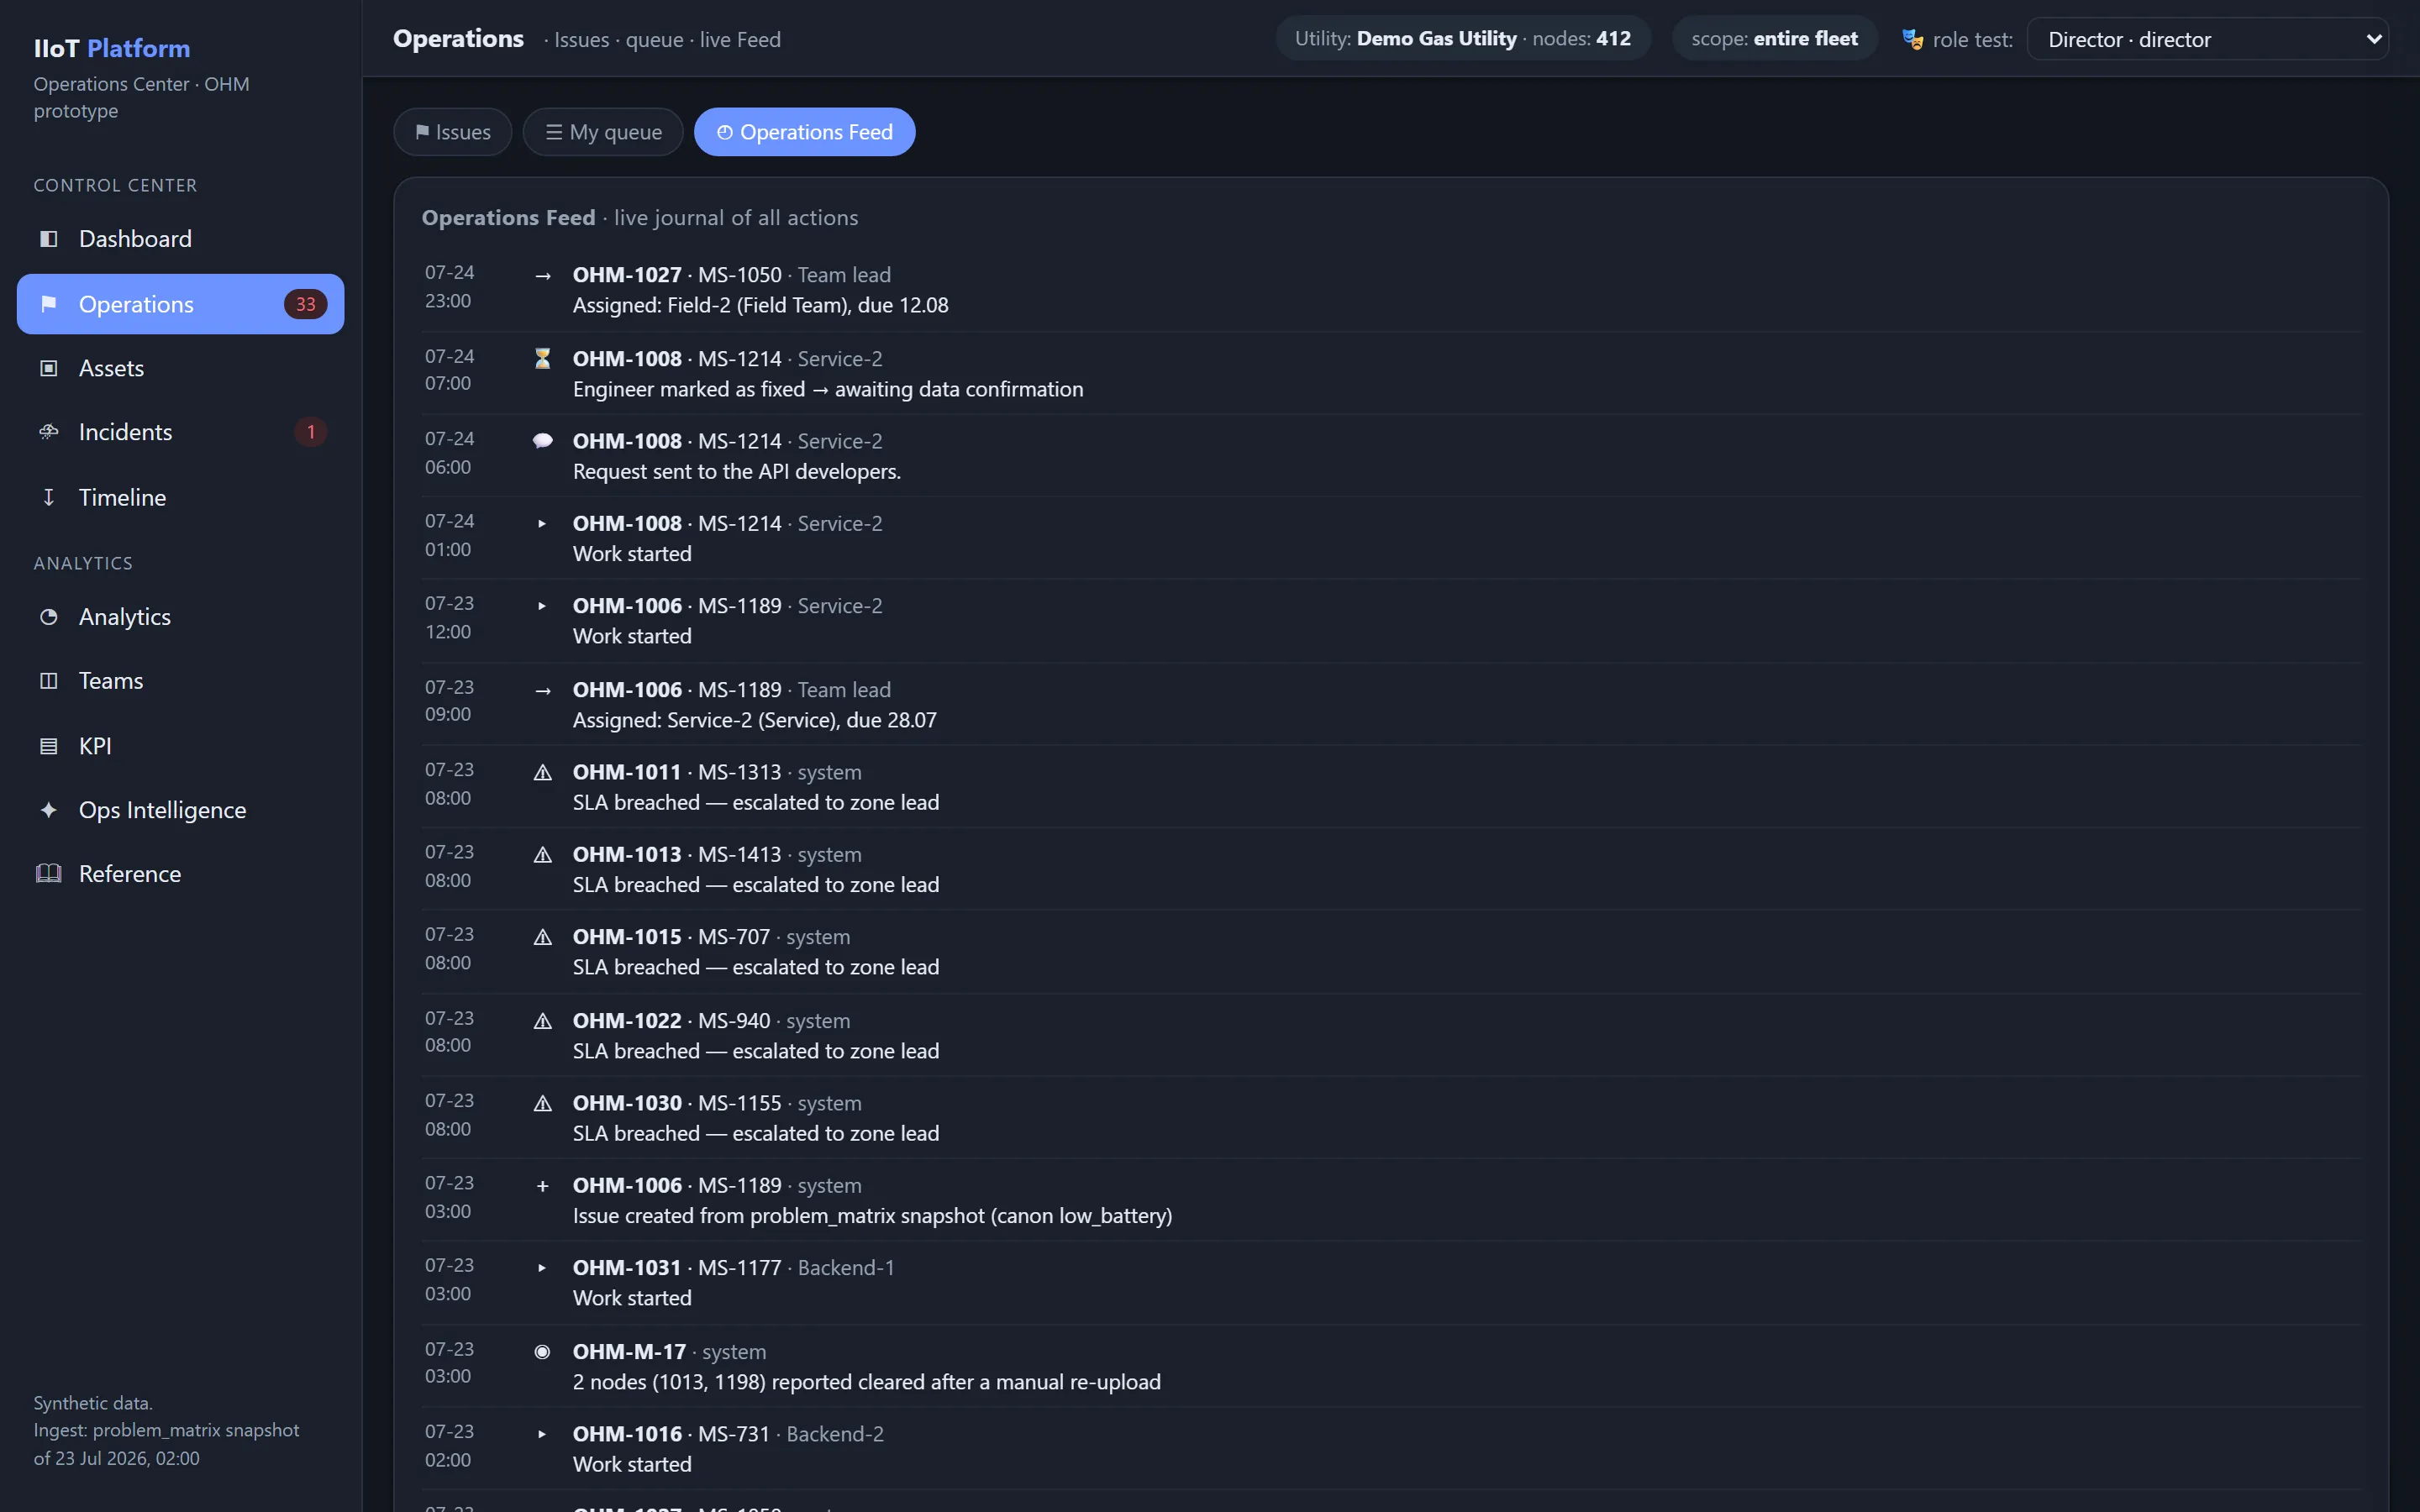
Opérations (Operations)
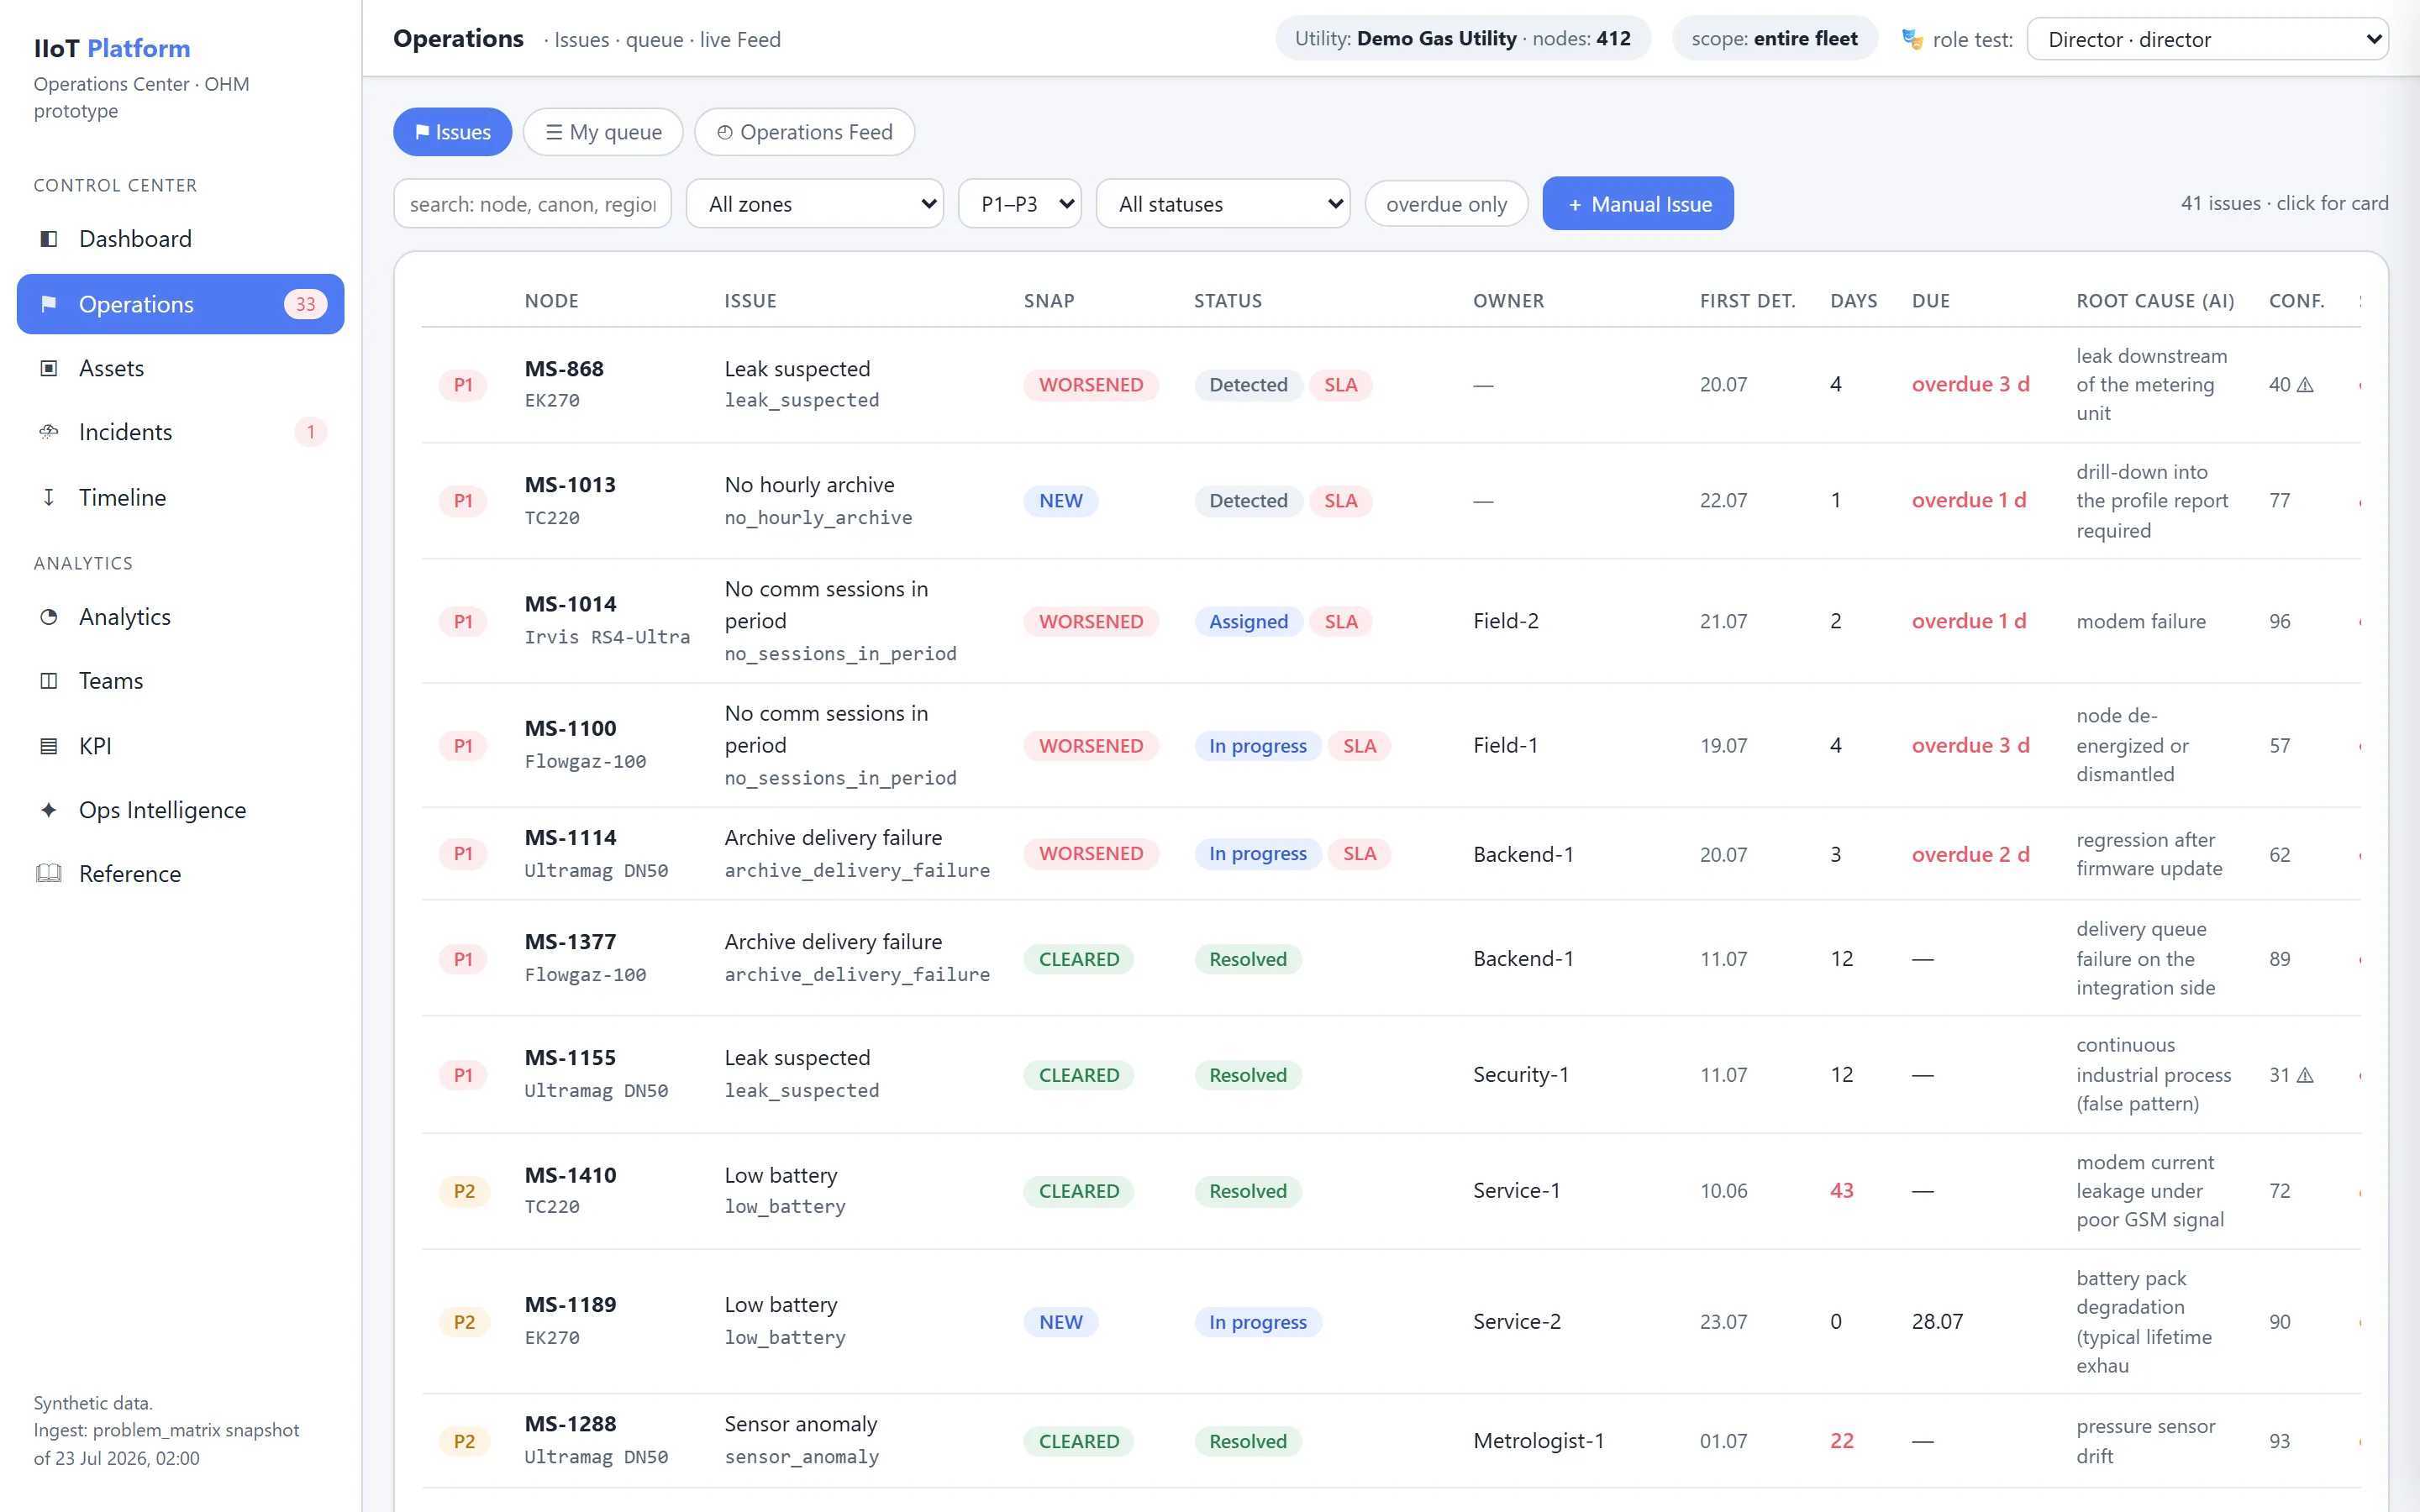
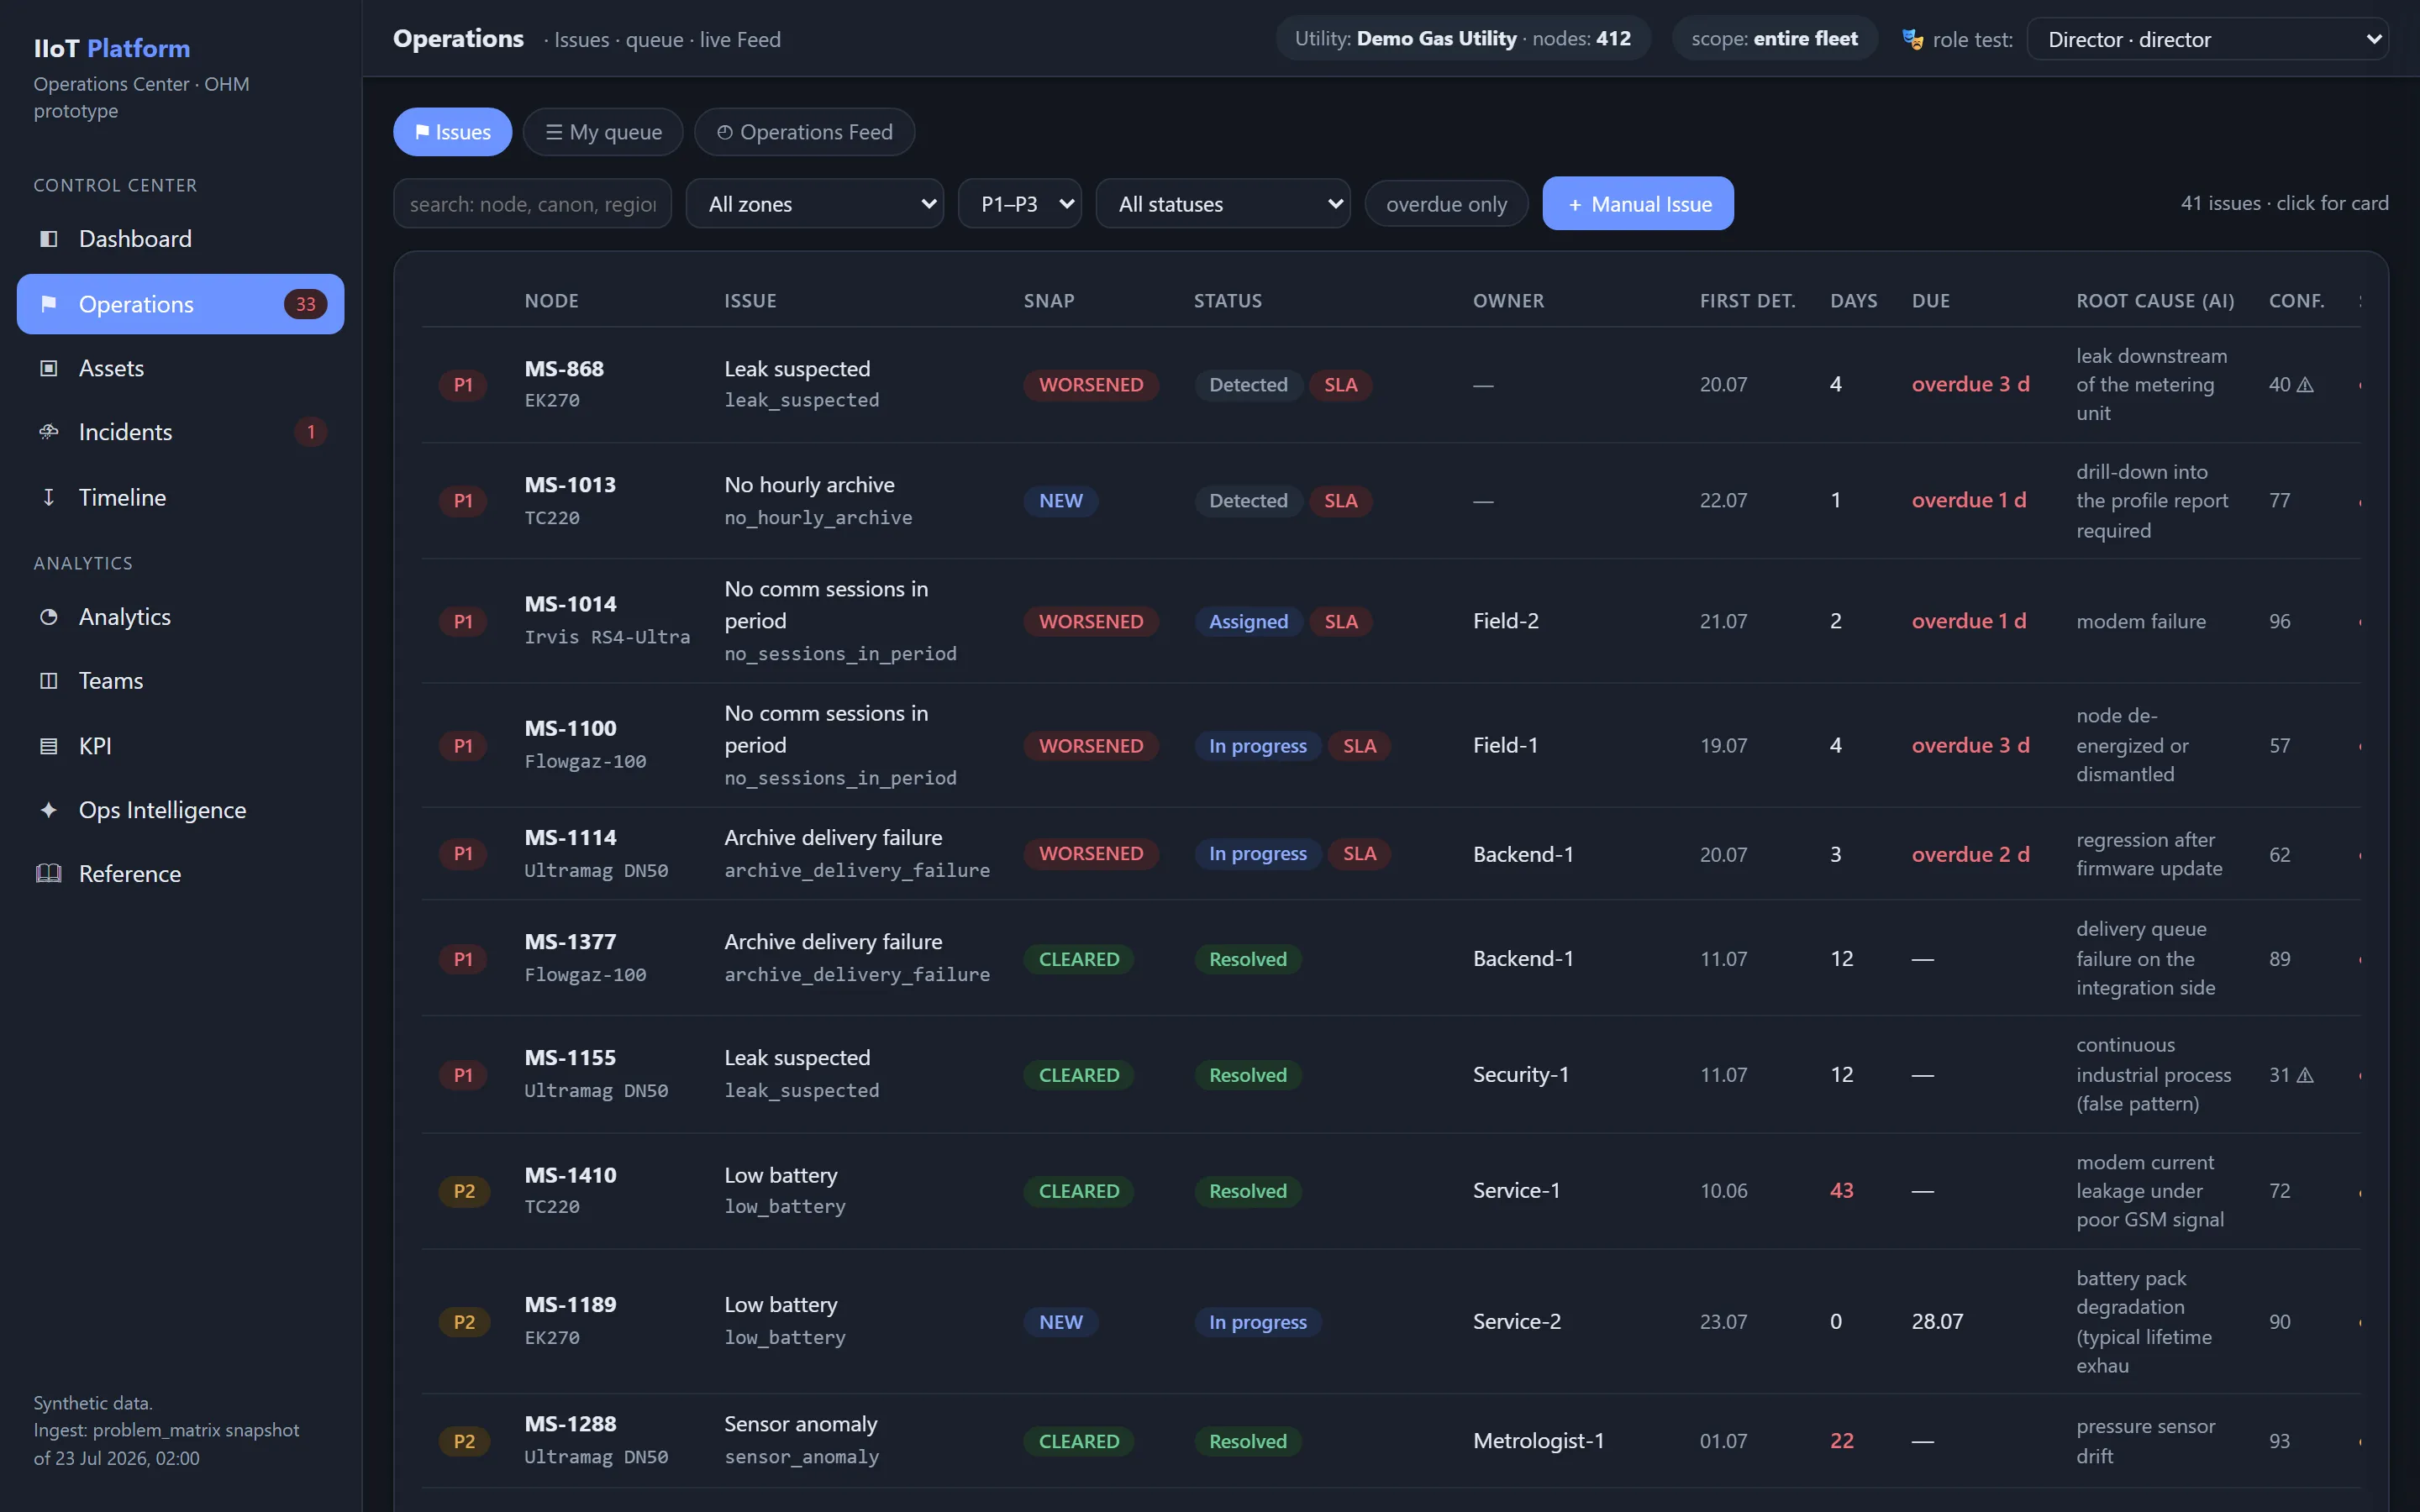
La liste de travail principale contient :
- ID ;
- priorité ;
- statut du Snapshot ;
- statut du workflow ;
- Canon ;
- Asset ;
- région ;
- cause racine ;
- niveau de confiance ;
- première détection ;
- ancienneté ;
- intervenant ;
- échéance ;
- SLA ;
- nombre de réouvertures ;
- ID de l’incident massif ;
- dépendances bloquantes.
Fiche Issue
La fiche Issue regroupe :
- passeport du problème ;
- Assets affectés ;
- Evidence ;
- workflow ;
- cause racine ;
- impact ;
- tâches ;
- commentaires ;
- Timeline ;
- Issues liées ;
- dépendances ;
- Knowledge Articles ;
- actions ;
- résultat de la vérification ;
- Audit Trail.
La fiche Issue complète et son cycle de vie sont décrits dans Operational Issues.
Actifs (Assets)
La fiche de l’Asset présente :
- identifiants ;
- type et modèle ;
- région ;
- configuration ;
- firmware ;
- statut de télémétrie ;
- Health Score ;
- sous-scores ;
- Issues actives ;
- historique ;
- problèmes récurrents ;
- Assets liés ;
- travaux réalisés ;
- documents.
Le modèle de santé sur lequel reposent ces scores est décrit dans Asset Health.
Incidents massifs (Massive Incidents)
L’écran des incidents massifs présente :
- ampleur ;
- fenêtre temporelle ;
- signature commune ;
- Assets affectés ;
- versions et dépendances partagées ;
- cause racine présumée ;
- progression du rétablissement ;
- Issues isolées résiduelles ;
- analyse post-incident.
La corrélation et le cycle de vie des incidents sont décrits dans Incidents massifs.
Chronologie (Timeline)
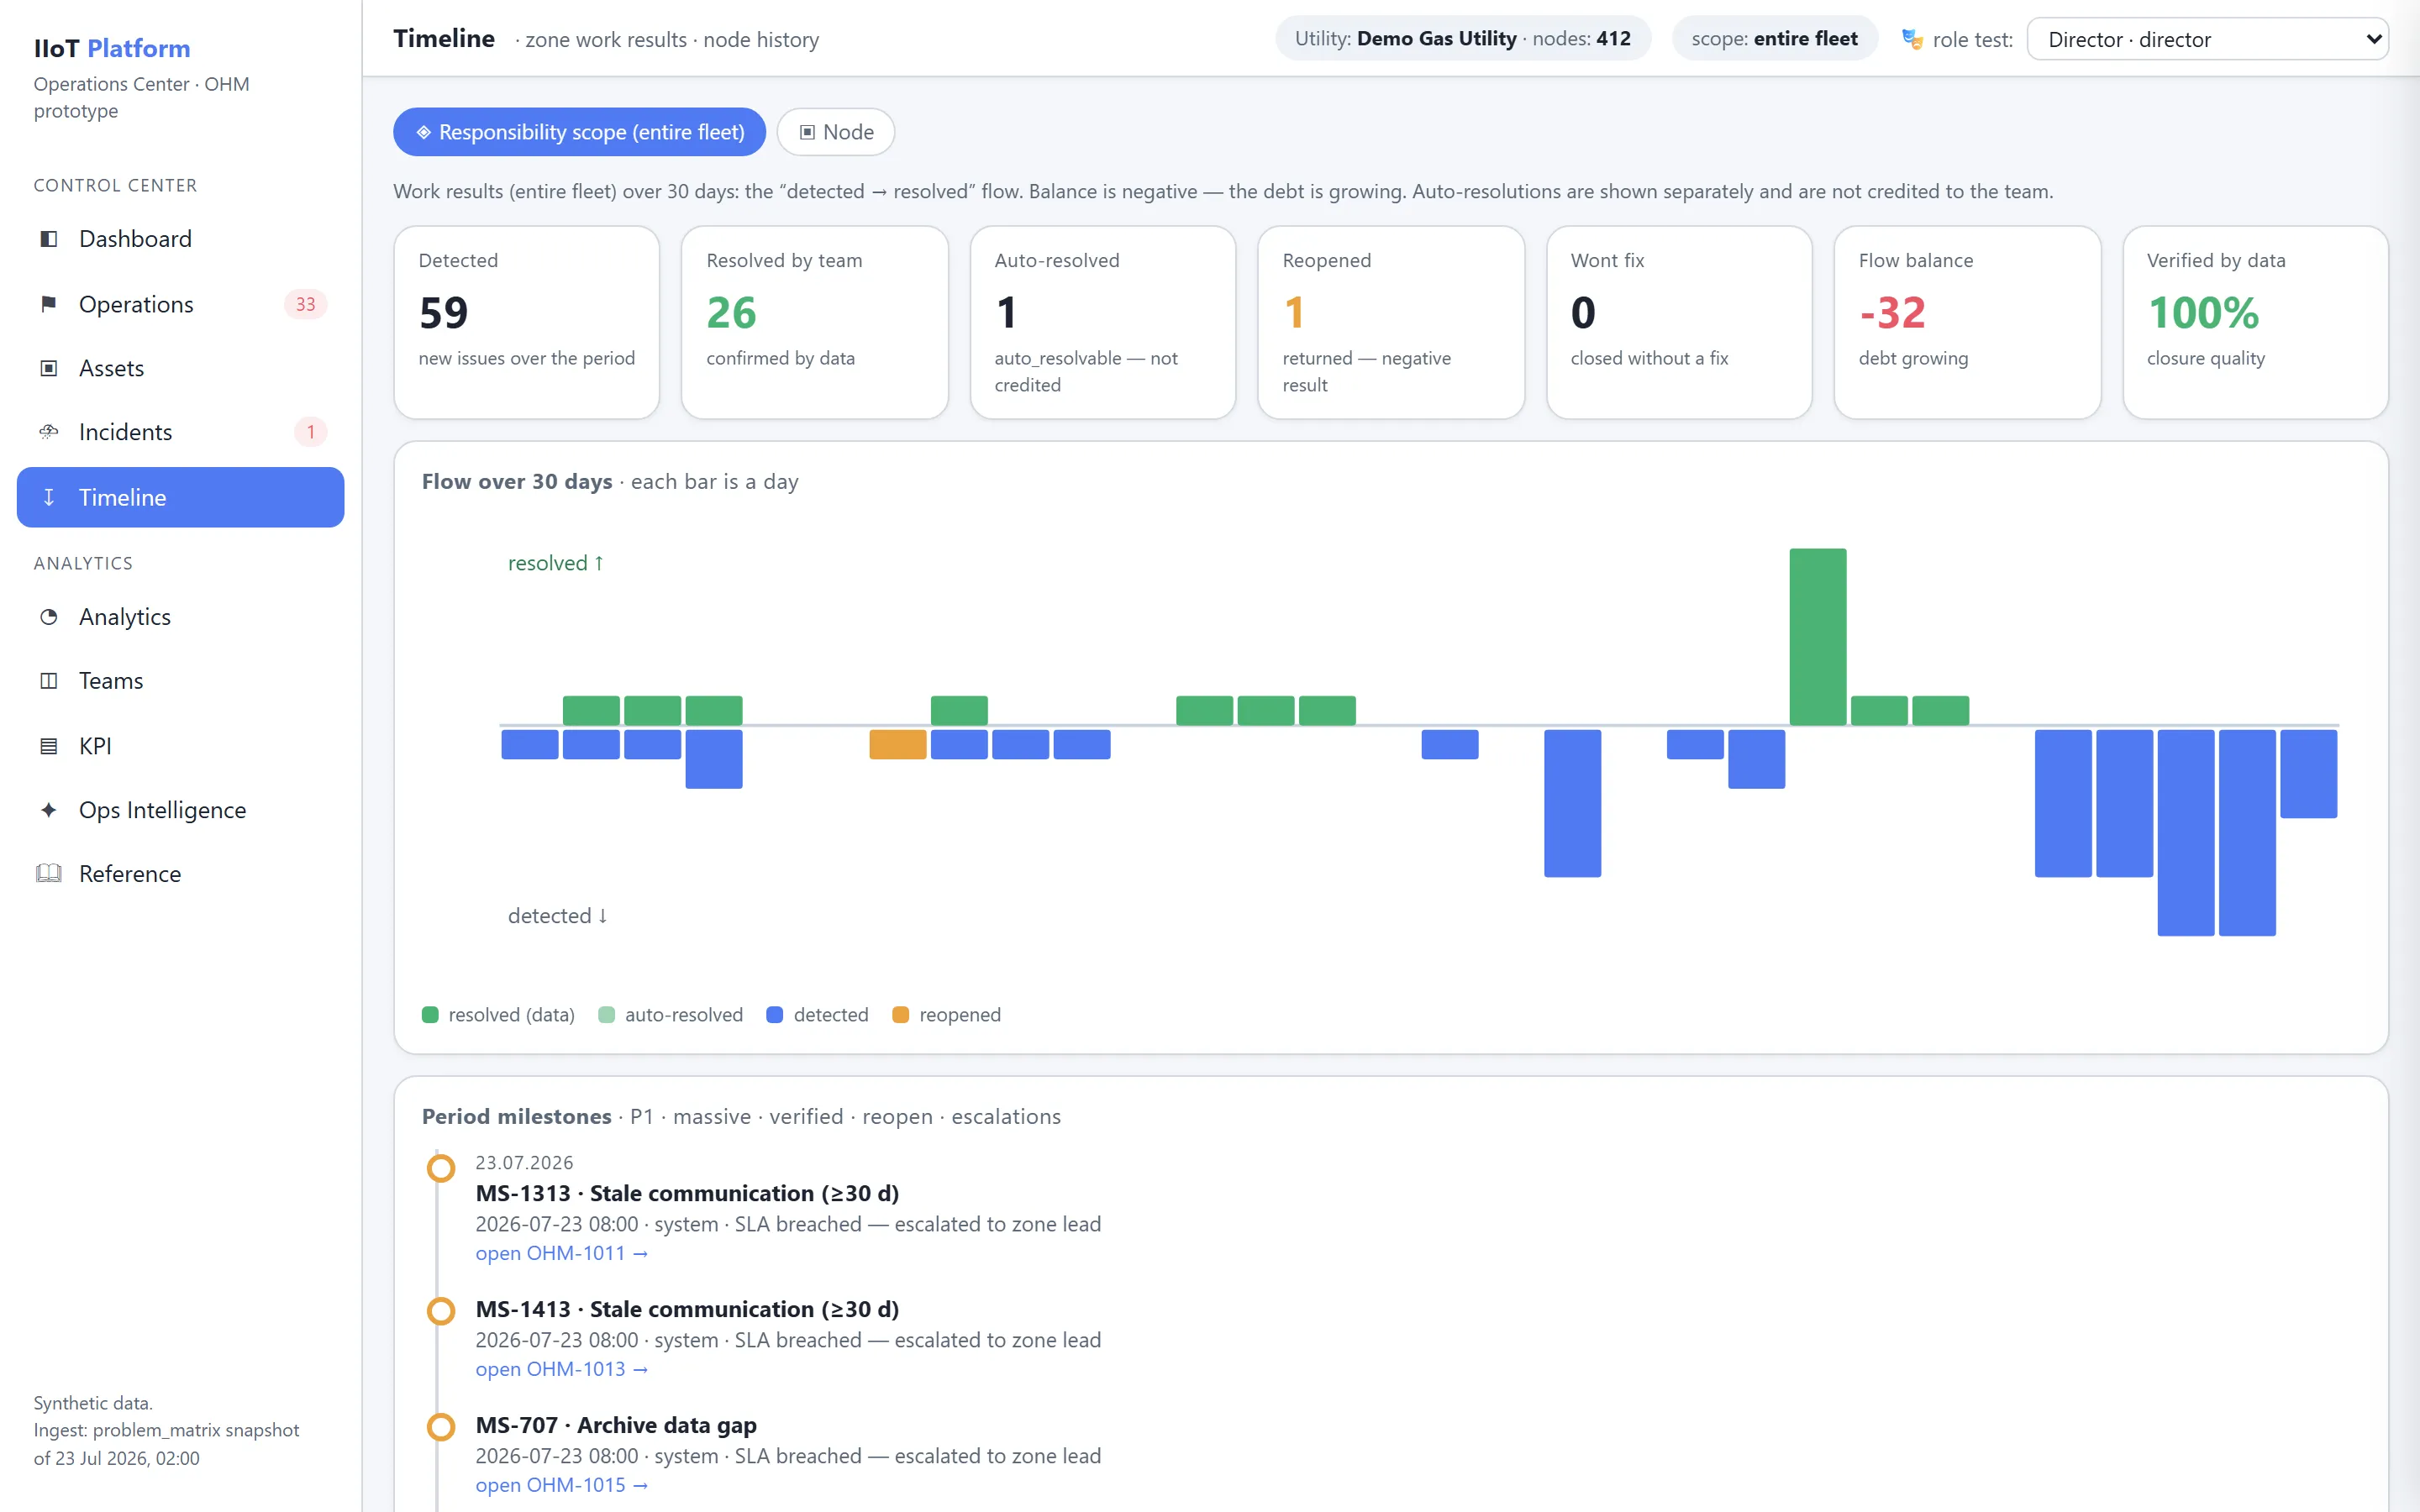
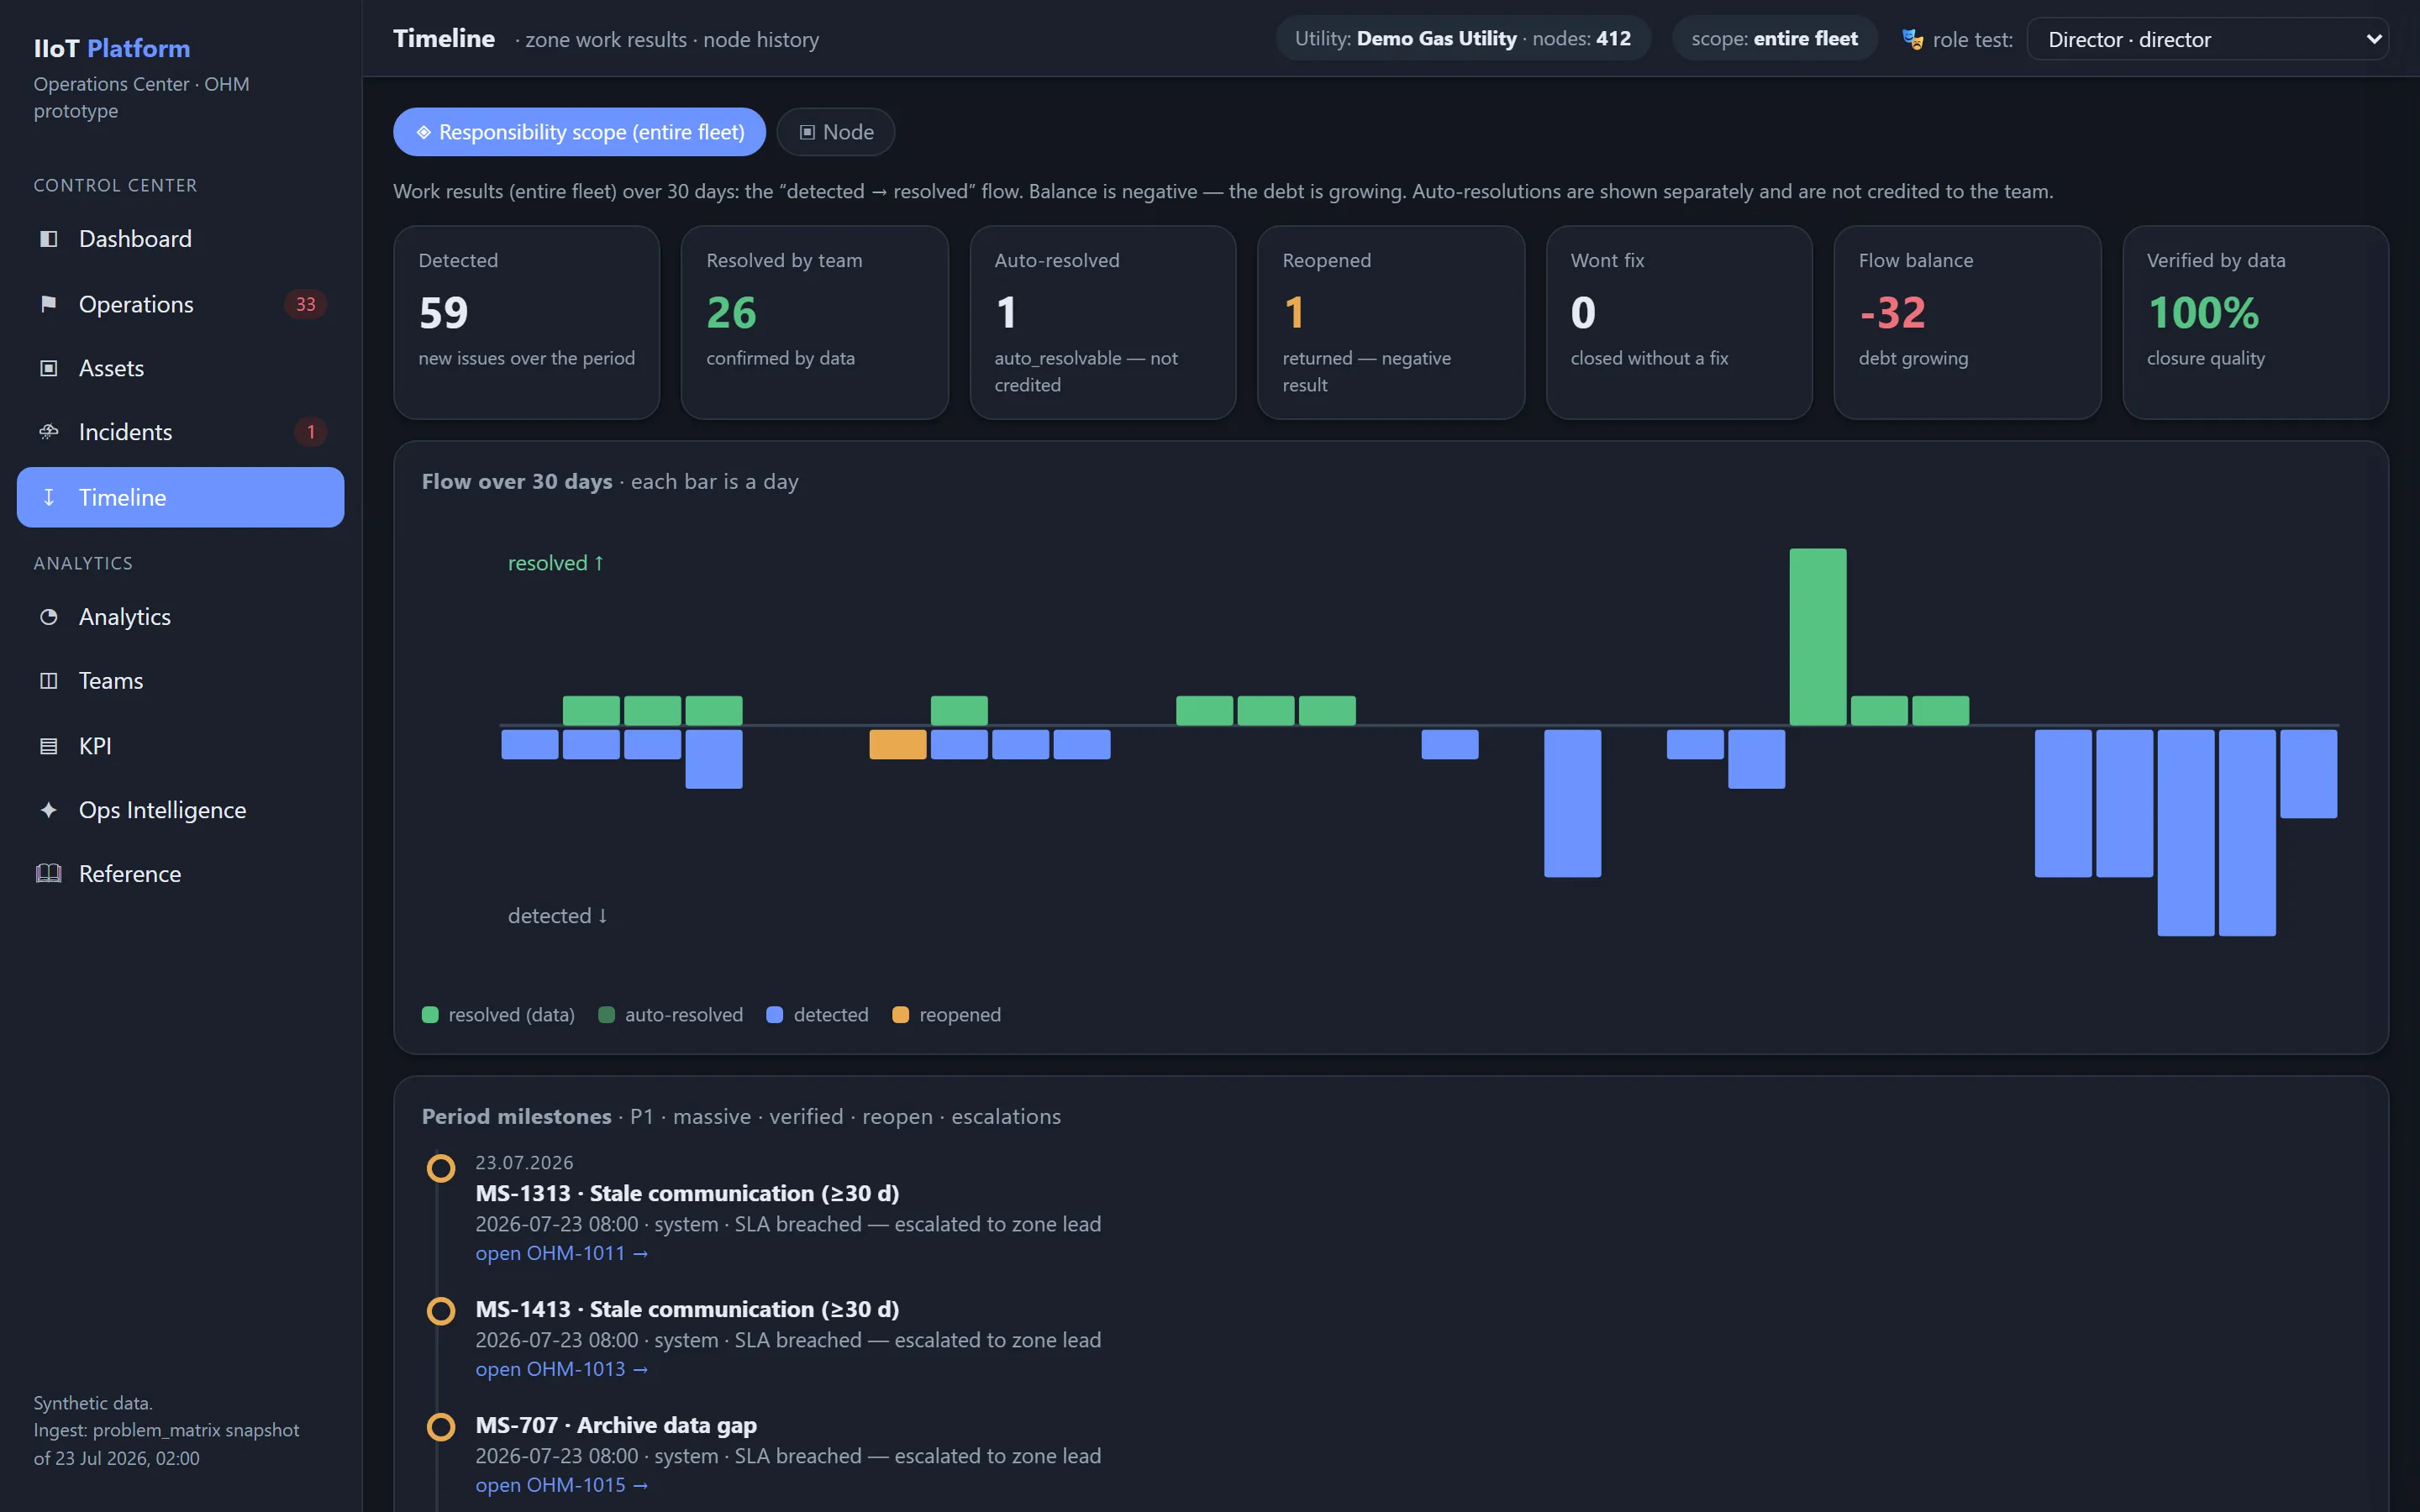
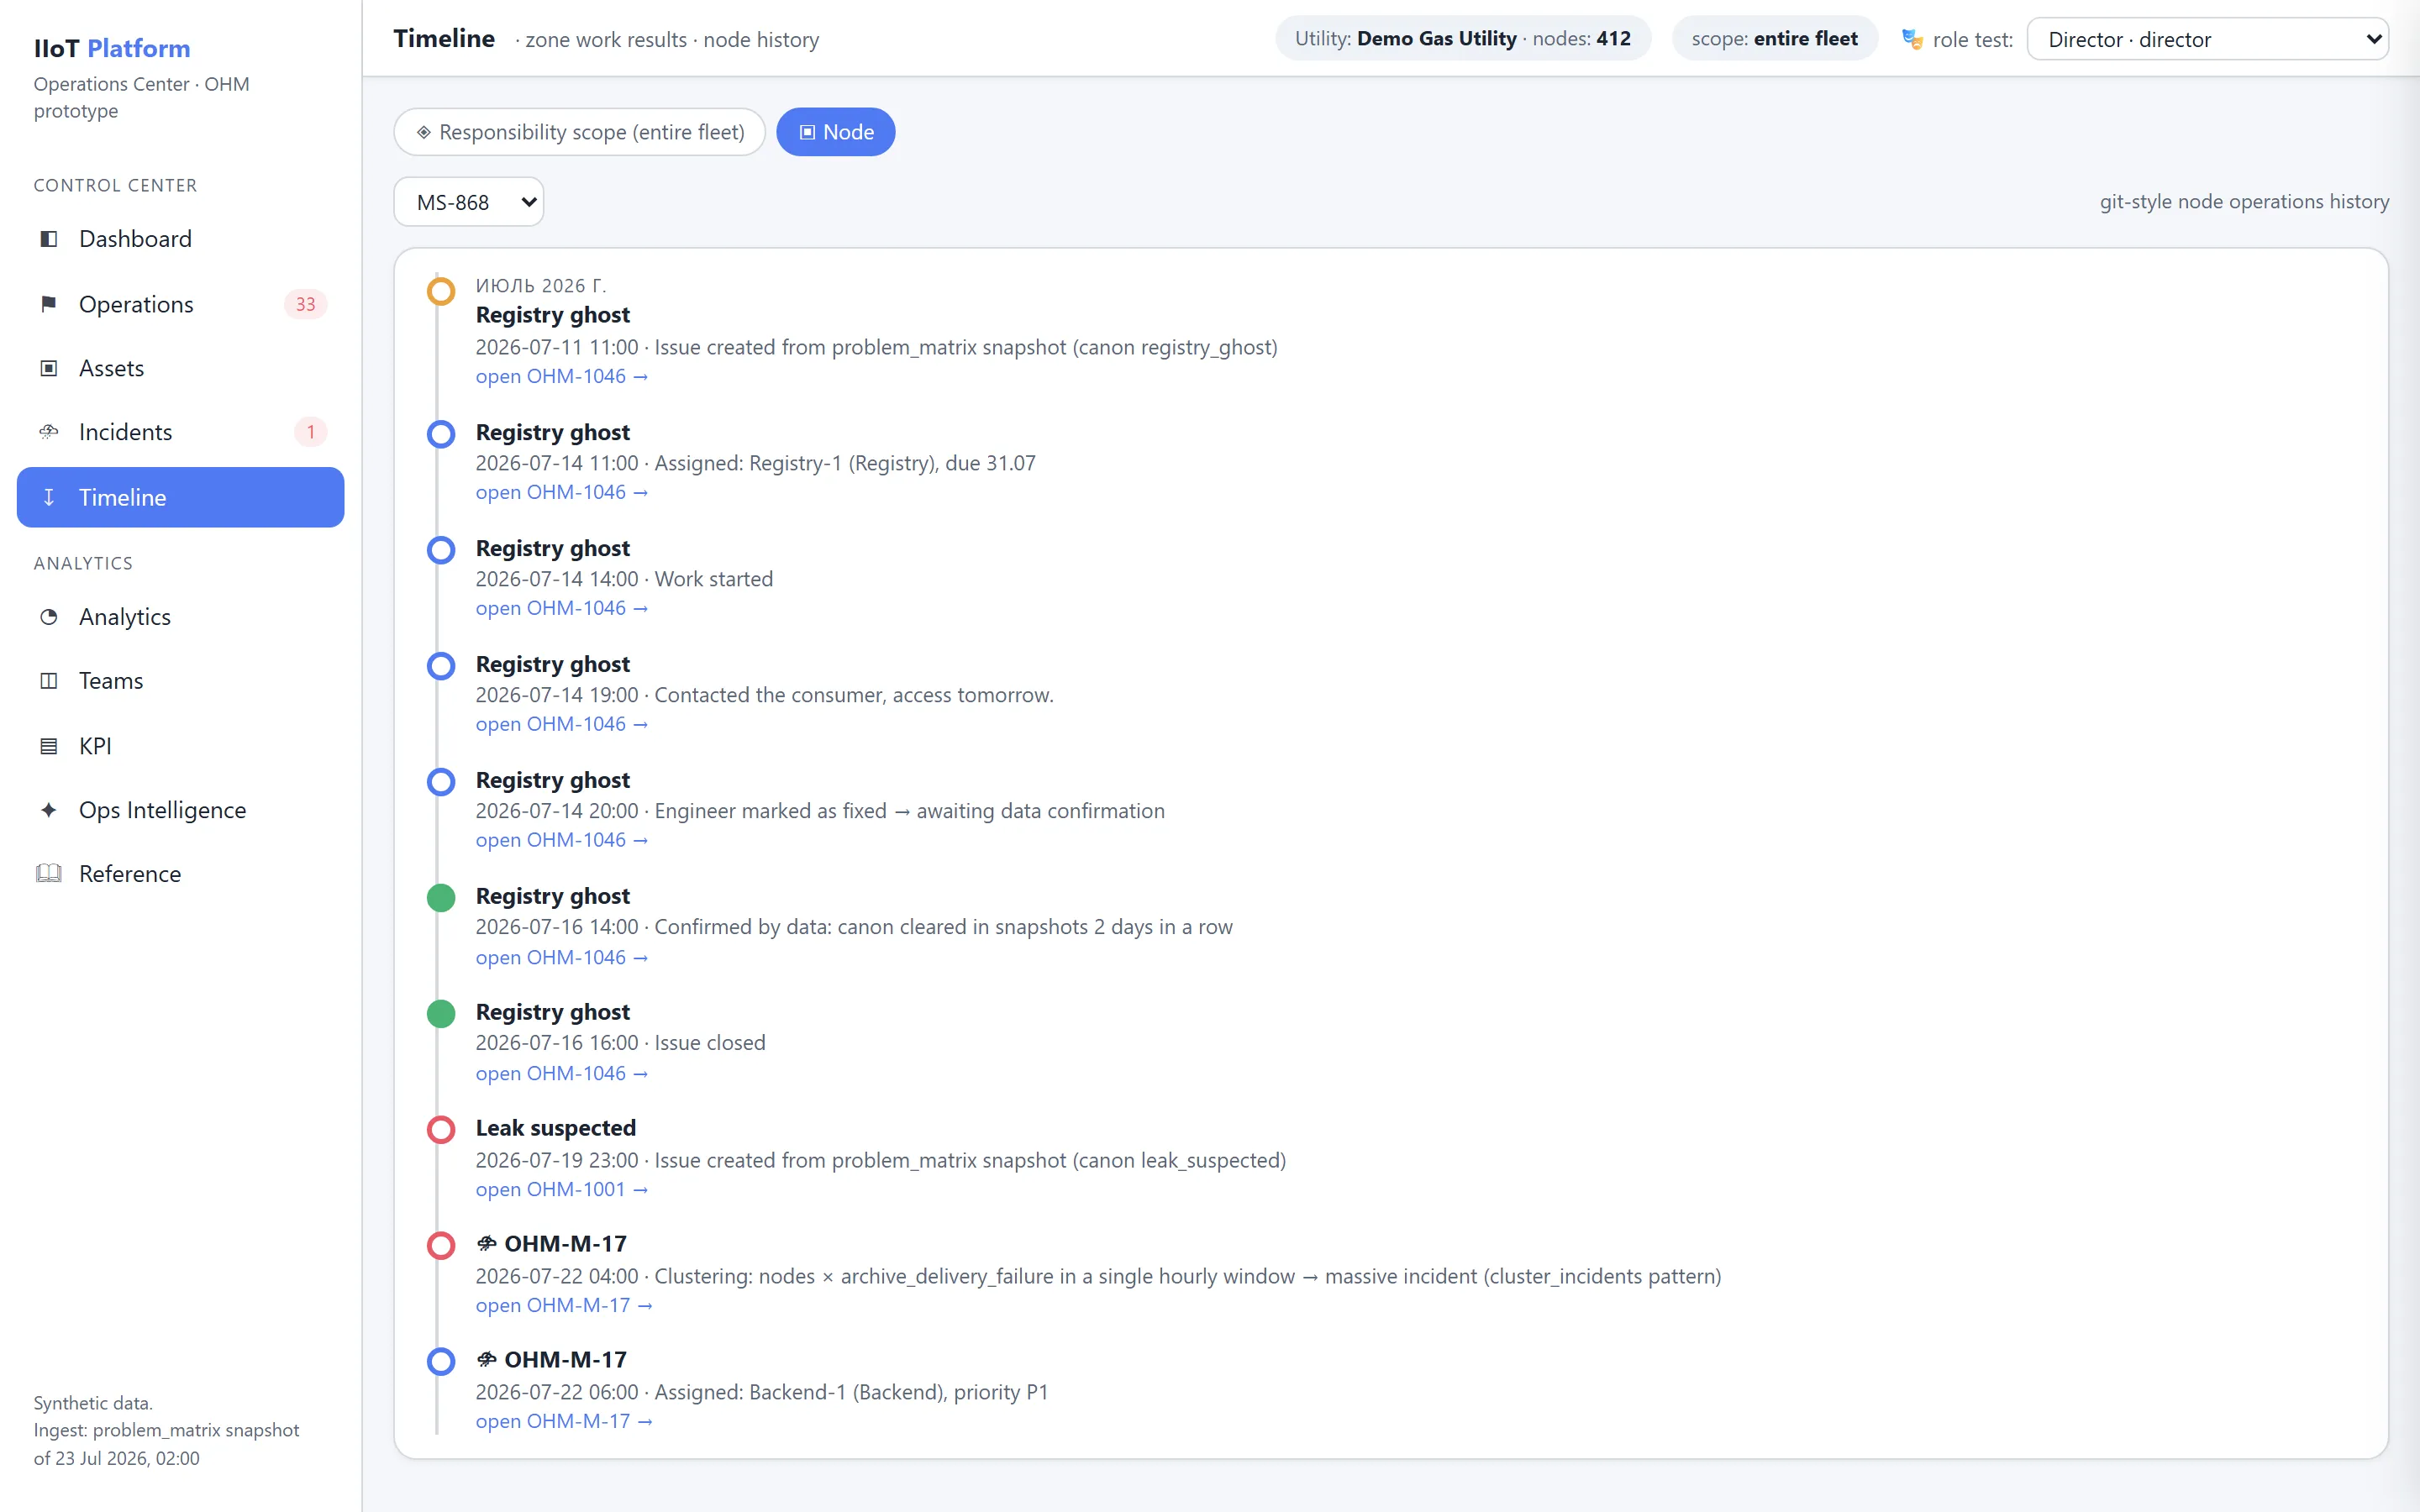
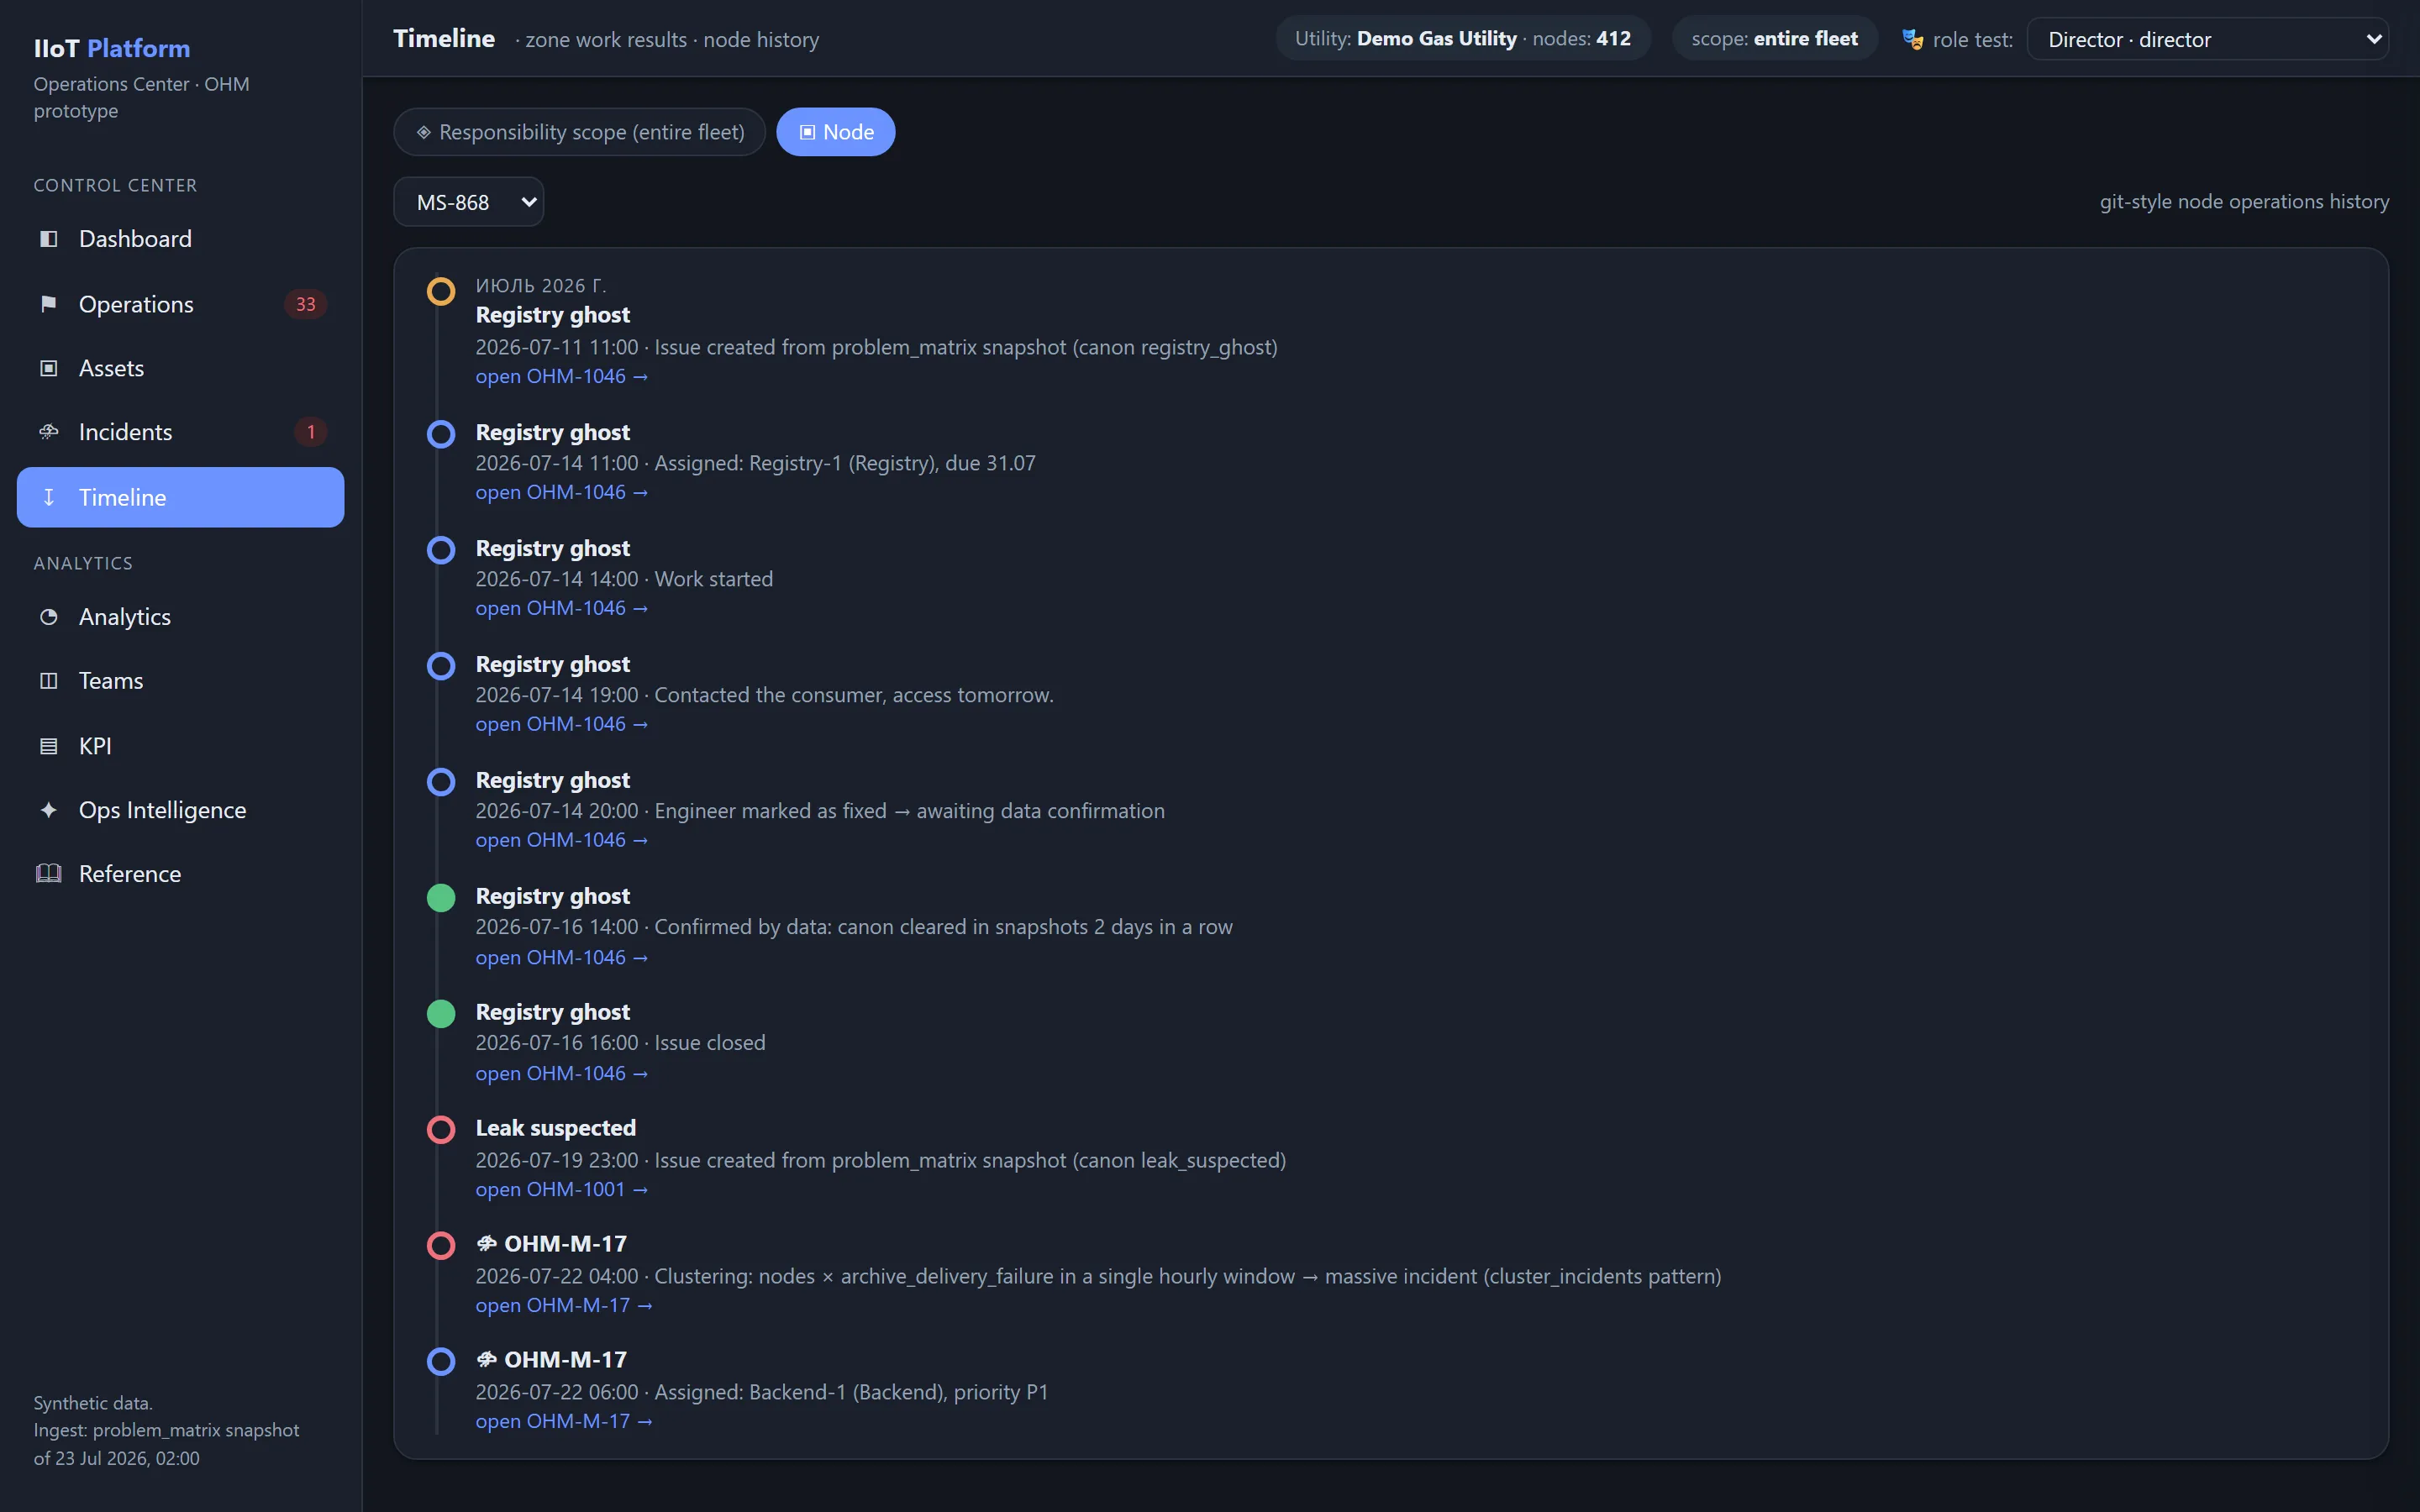
La Timeline constitue l’historique d’exploitation unifié :
| Heure | Événement |
|---|---|
| 09:14 | Issue détectée |
| 09:16 | Evidence jointes |
| 09:18 | Corrélée avec OHM-2026-001811 |
| 09:23 | Affectée à Integration-2 |
| 10:04 | Travaux démarrés |
| 11:42 | Configuration corrigée |
| 12:10 | En attente de vérification |
| 13:00 | Premier Snapshot propre |
| Jour suivant, 04:00 | Deuxième Snapshot propre |
| 04:01 | Vérifiée par les données |
| 04:02 | Resolved |
Analytique (Analytics)
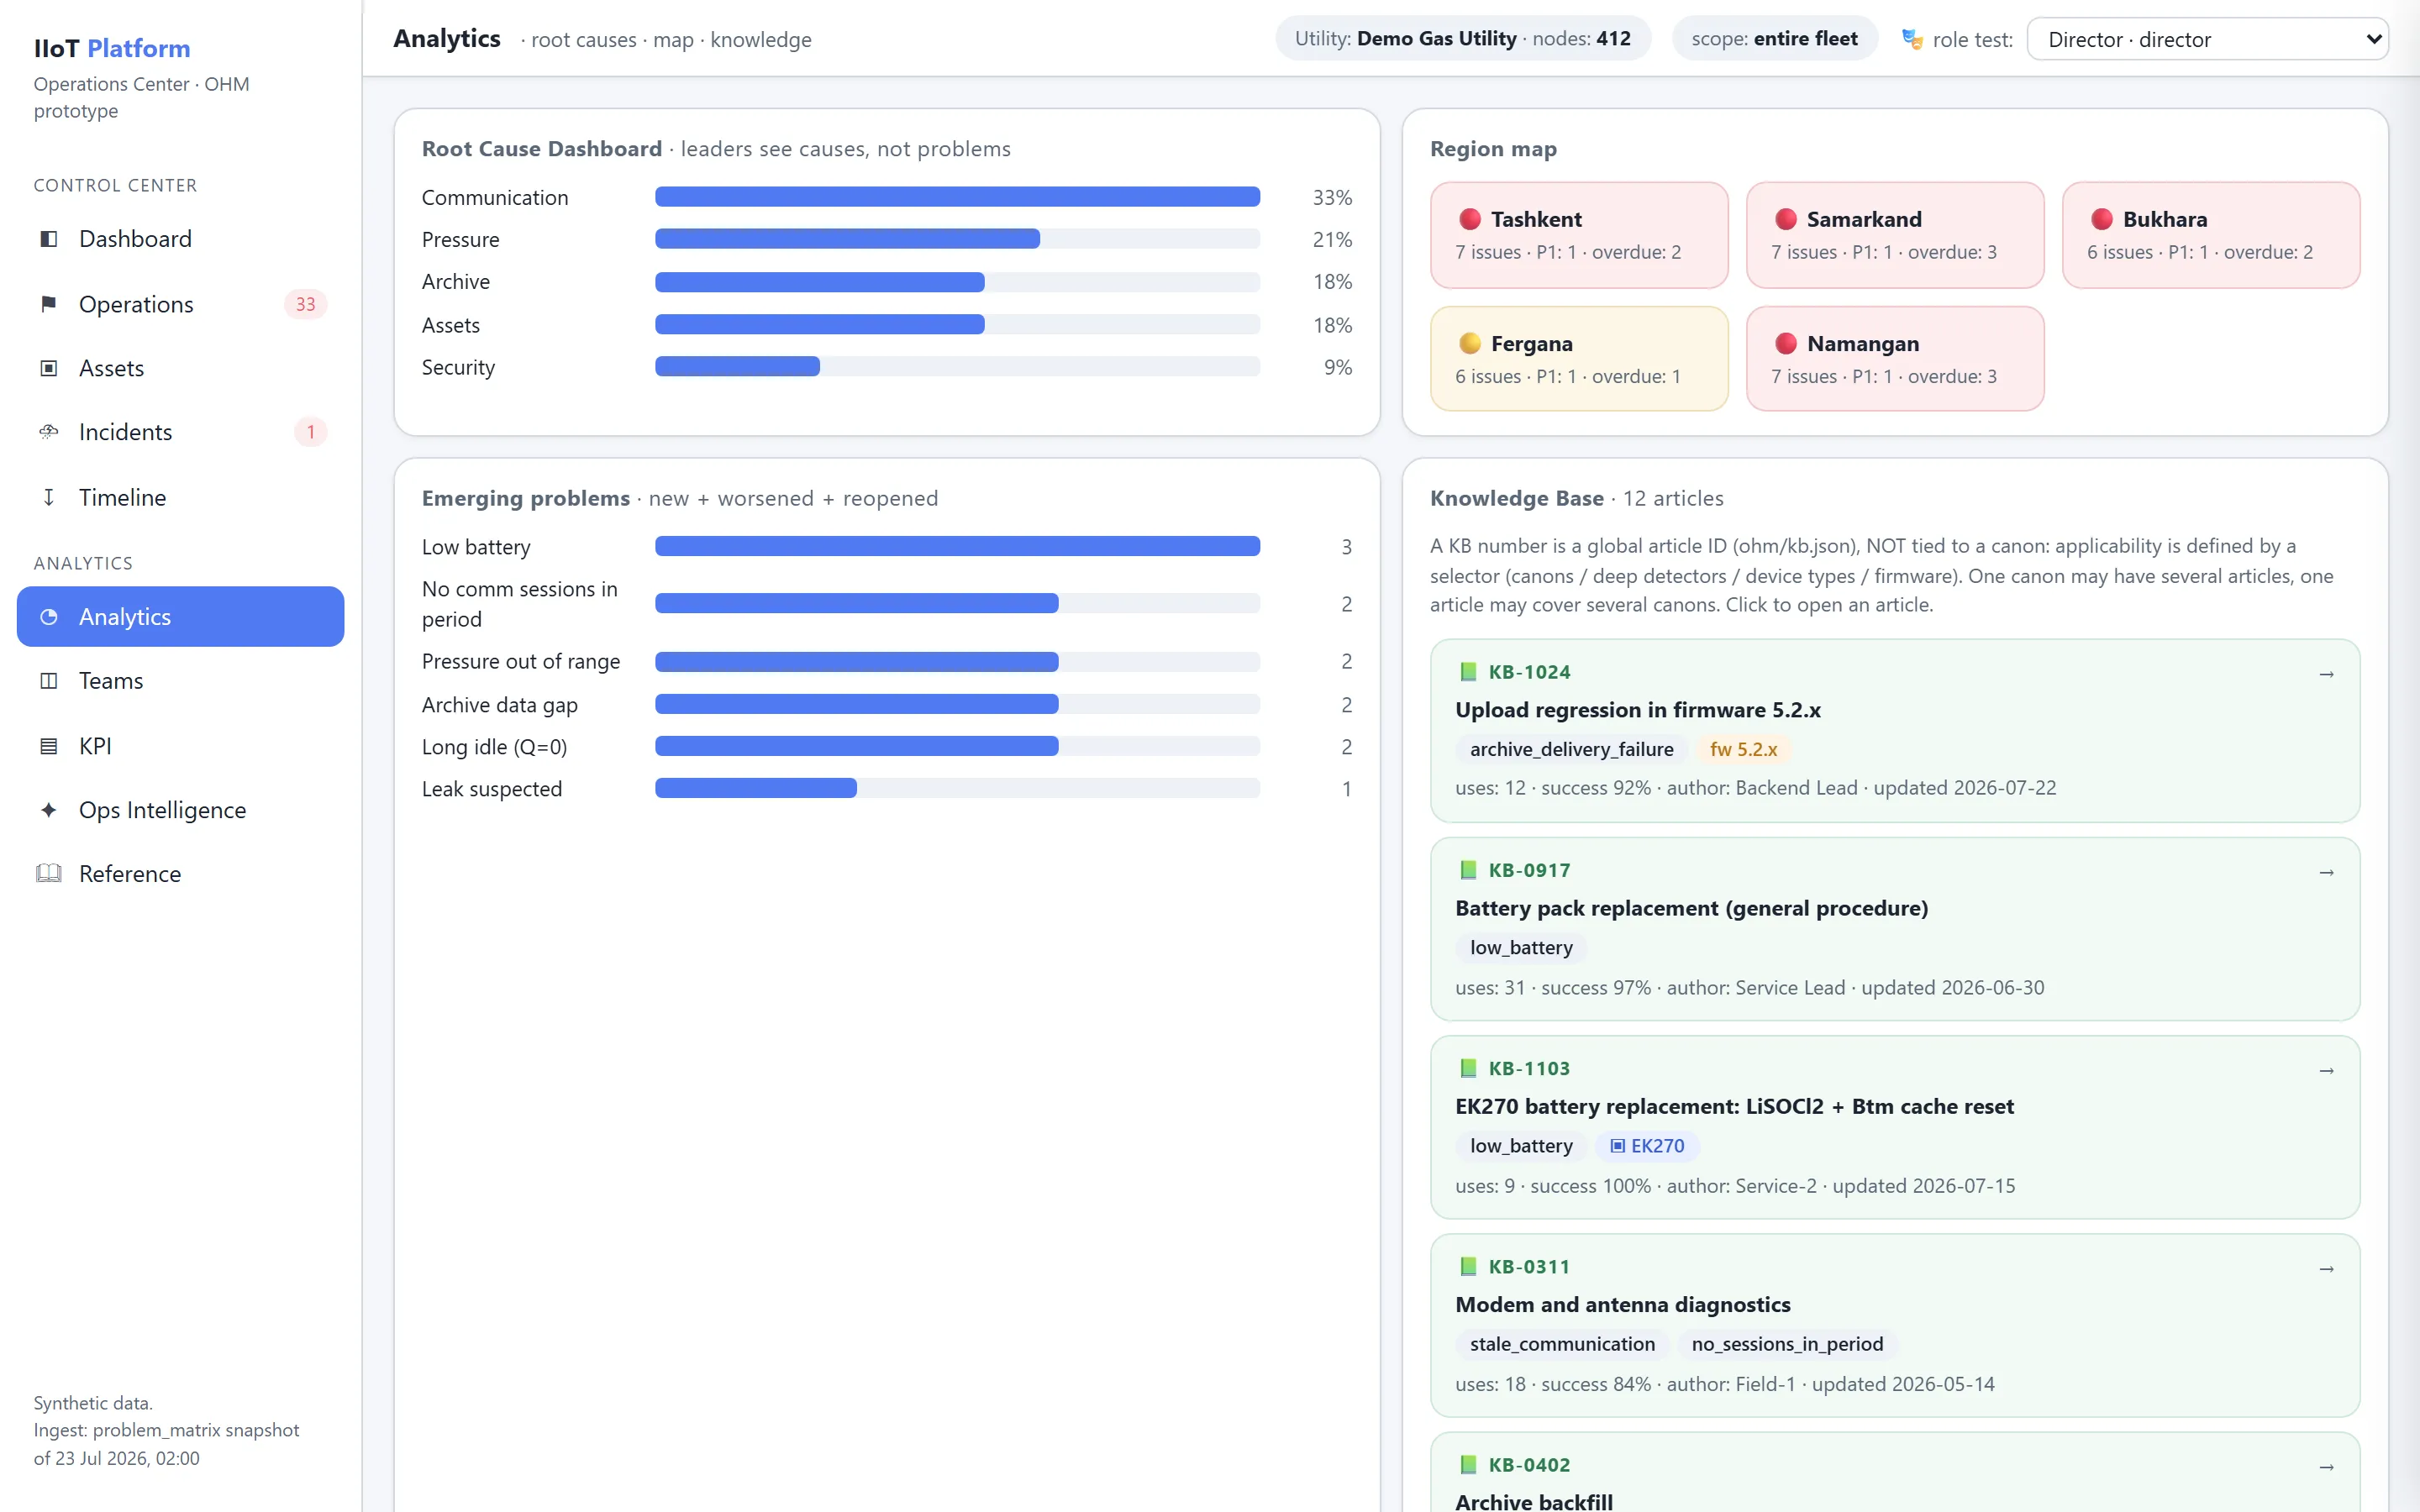
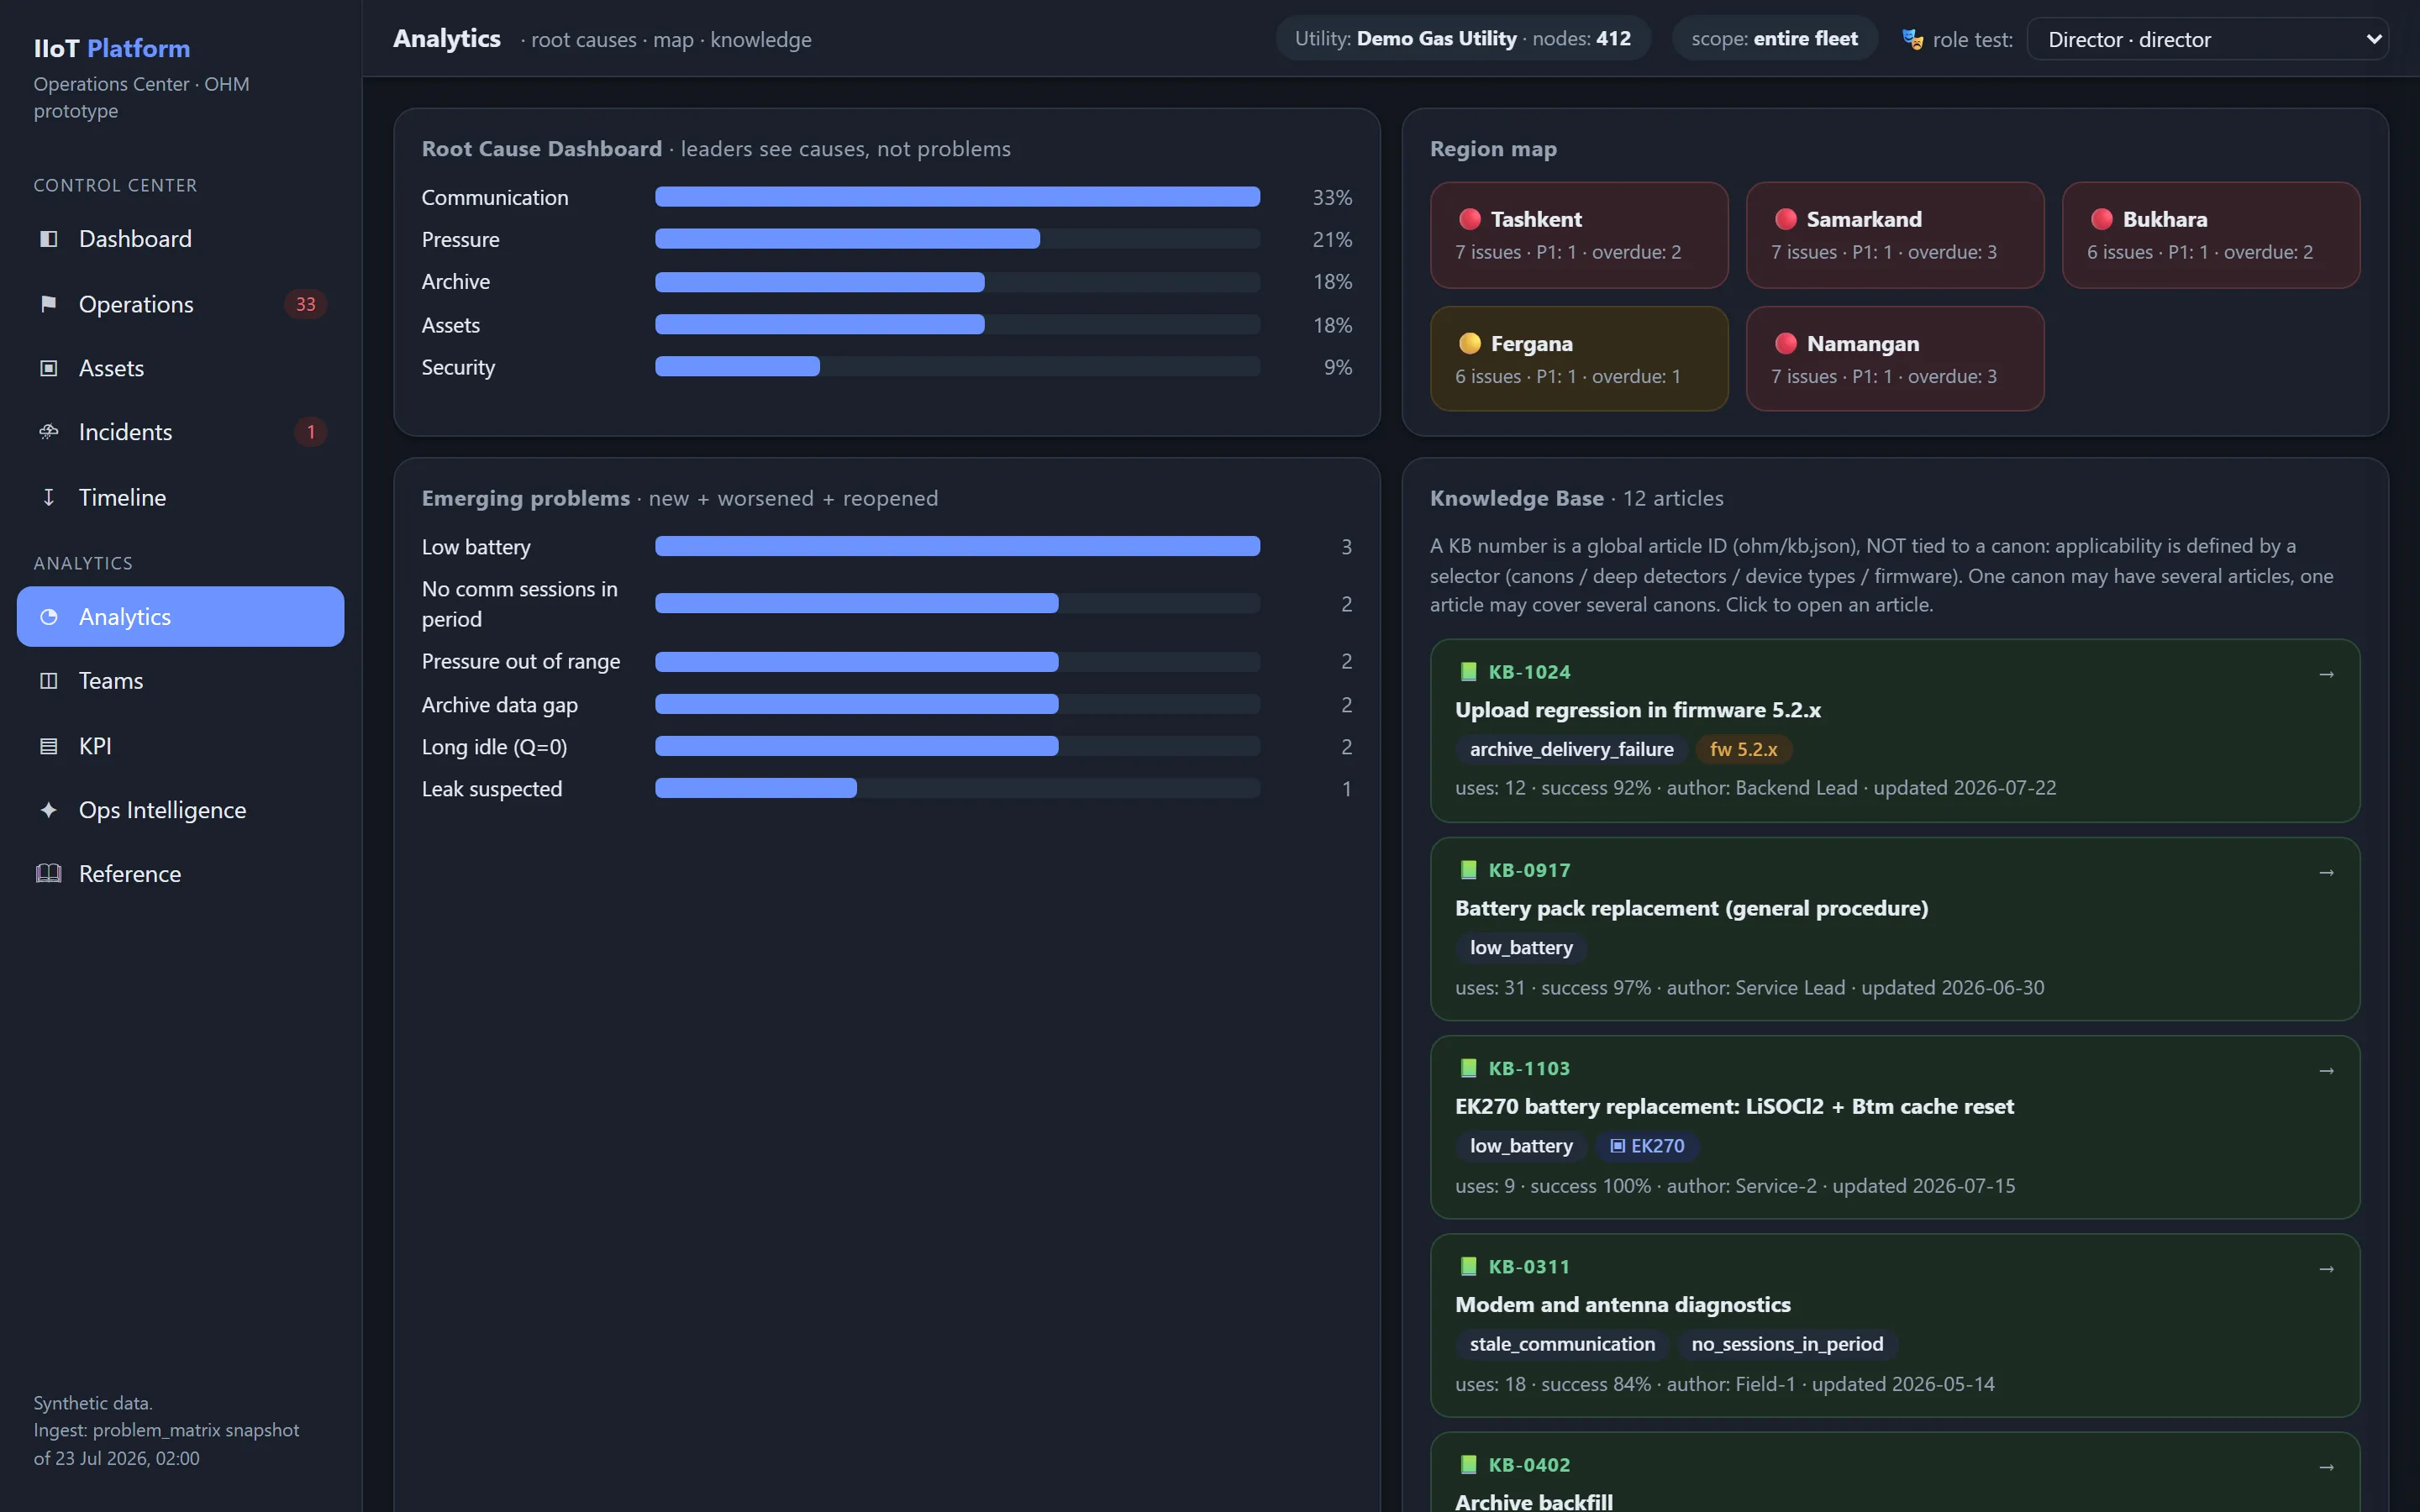
Analytics contient :
- Root Cause Dashboard ;
- répartition des problèmes ;
- récurrence ;
- tendances SLA ;
- qualité des détecteurs (Detectors) ;
- tendances de santé des Assets ;
- comparaison régionale ;
- impact de la topologie ;
- efficacité de la Knowledge Base ;
- risques anticipés.
Équipes (Teams)
Teams présente :
- capacité ;
- charge ouverte ;
- charge en retard ;
- charge P1 ;
- charge de vérification ;
- taux d’utilisation ;
- équilibre des affectations ;
- ancienneté du backlog ;
- prévision de charge.
Les indicateurs qui alimentent cet écran sont décrits dans KPI et performance des équipes.
Operations Intelligence
Operations Intelligence rassemble :
- risques émergents ;
- clusters d’anomalies ;
- défaillances anticipées ;
- causes racines probables ;
- incidents similaires ;
- recommandations ;
- santé des détecteurs ;
- niveau de confiance de l’AI ;
- changements inexpliqués.
La façon dont ces recommandations sont produites est décrite dans AI Operations Intelligence.
Scope et filtrage
Tous les écrans utilisent un scope unifié.
Exemples :
- organisation ;
- région ;
- district ;
- zone de responsabilité ;
- intervenant ;
- type d’Asset ;
- modèle d’appareil ;
- firmware ;
- opérateur ;
- passerelle ;
- Canon ;
- priorité ;
- statut ;
- plage de dates.
Le scope est appliqué côté serveur : ce n’est pas un simple filtre d’interface.
C’est essentiel pour :
- la sécurité ;
- la séparation des responsabilités ;
- l’exactitude des KPI ;
- la gestion régionale ;
- la mise à l’échelle ;
- la prévention des fuites de données entre services.
Sujets connexes
Cette page vous a-t-elle été utile ?
Merci pour votre retour !