Santé des actifs et de l'écosystème
Modèles de santé de l'actif et de l'écosystème — domaines de santé, Health Score agrégé avec pénalités et rétablissement, tendances, actifs chroniques et prévision.
Santé de l’actif (Asset Health)
Au centre de l’Operational Health Matrix se trouve non pas un événement, ni une alarme, ni une tâche, mais l’actif exploité.
Chaque actif possède son propre état d’exploitation, calculé en continu à partir de la télémétrie, de l’historique d’exploitation, des résultats d’analyse et des Operational Issues confirmées.
Asset Health permet d’évaluer non seulement l’état courant de l’équipement, mais aussi sa tendance d’évolution, le risque opérationnel et l’impact sur la résilience globale de l’infrastructure.
Modèle Asset Health
Chaque actif est représenté par un profil numérique unique.
flowchart TD
    A["Actif"] --> CFG["Configuration"]
    CFG --> TEL["Télémétrie"]
    TEL --> EV["Evidence"]
    EV --> ISSUE["Operational Issues"]
    ISSUE --> MH["Historique de maintenance"]
    MH --> HS["Health Score"]
    HS --> PRED["Prévision"]
La fiche de l’actif contient :
- les identifiants ;
- le type d’équipement ;
- le fabricant ;
- le modèle ;
- le numéro de série ;
- la région ;
- les coordonnées ;
- le propriétaire ;
- l’organisation ;
- la configuration courante ;
- l’historique des modifications ;
- le micrologiciel installé ;
- les équipements associés ;
- le journal de maintenance ;
- les problèmes actifs ;
- les problèmes résolus ;
- le Health Score calculé.
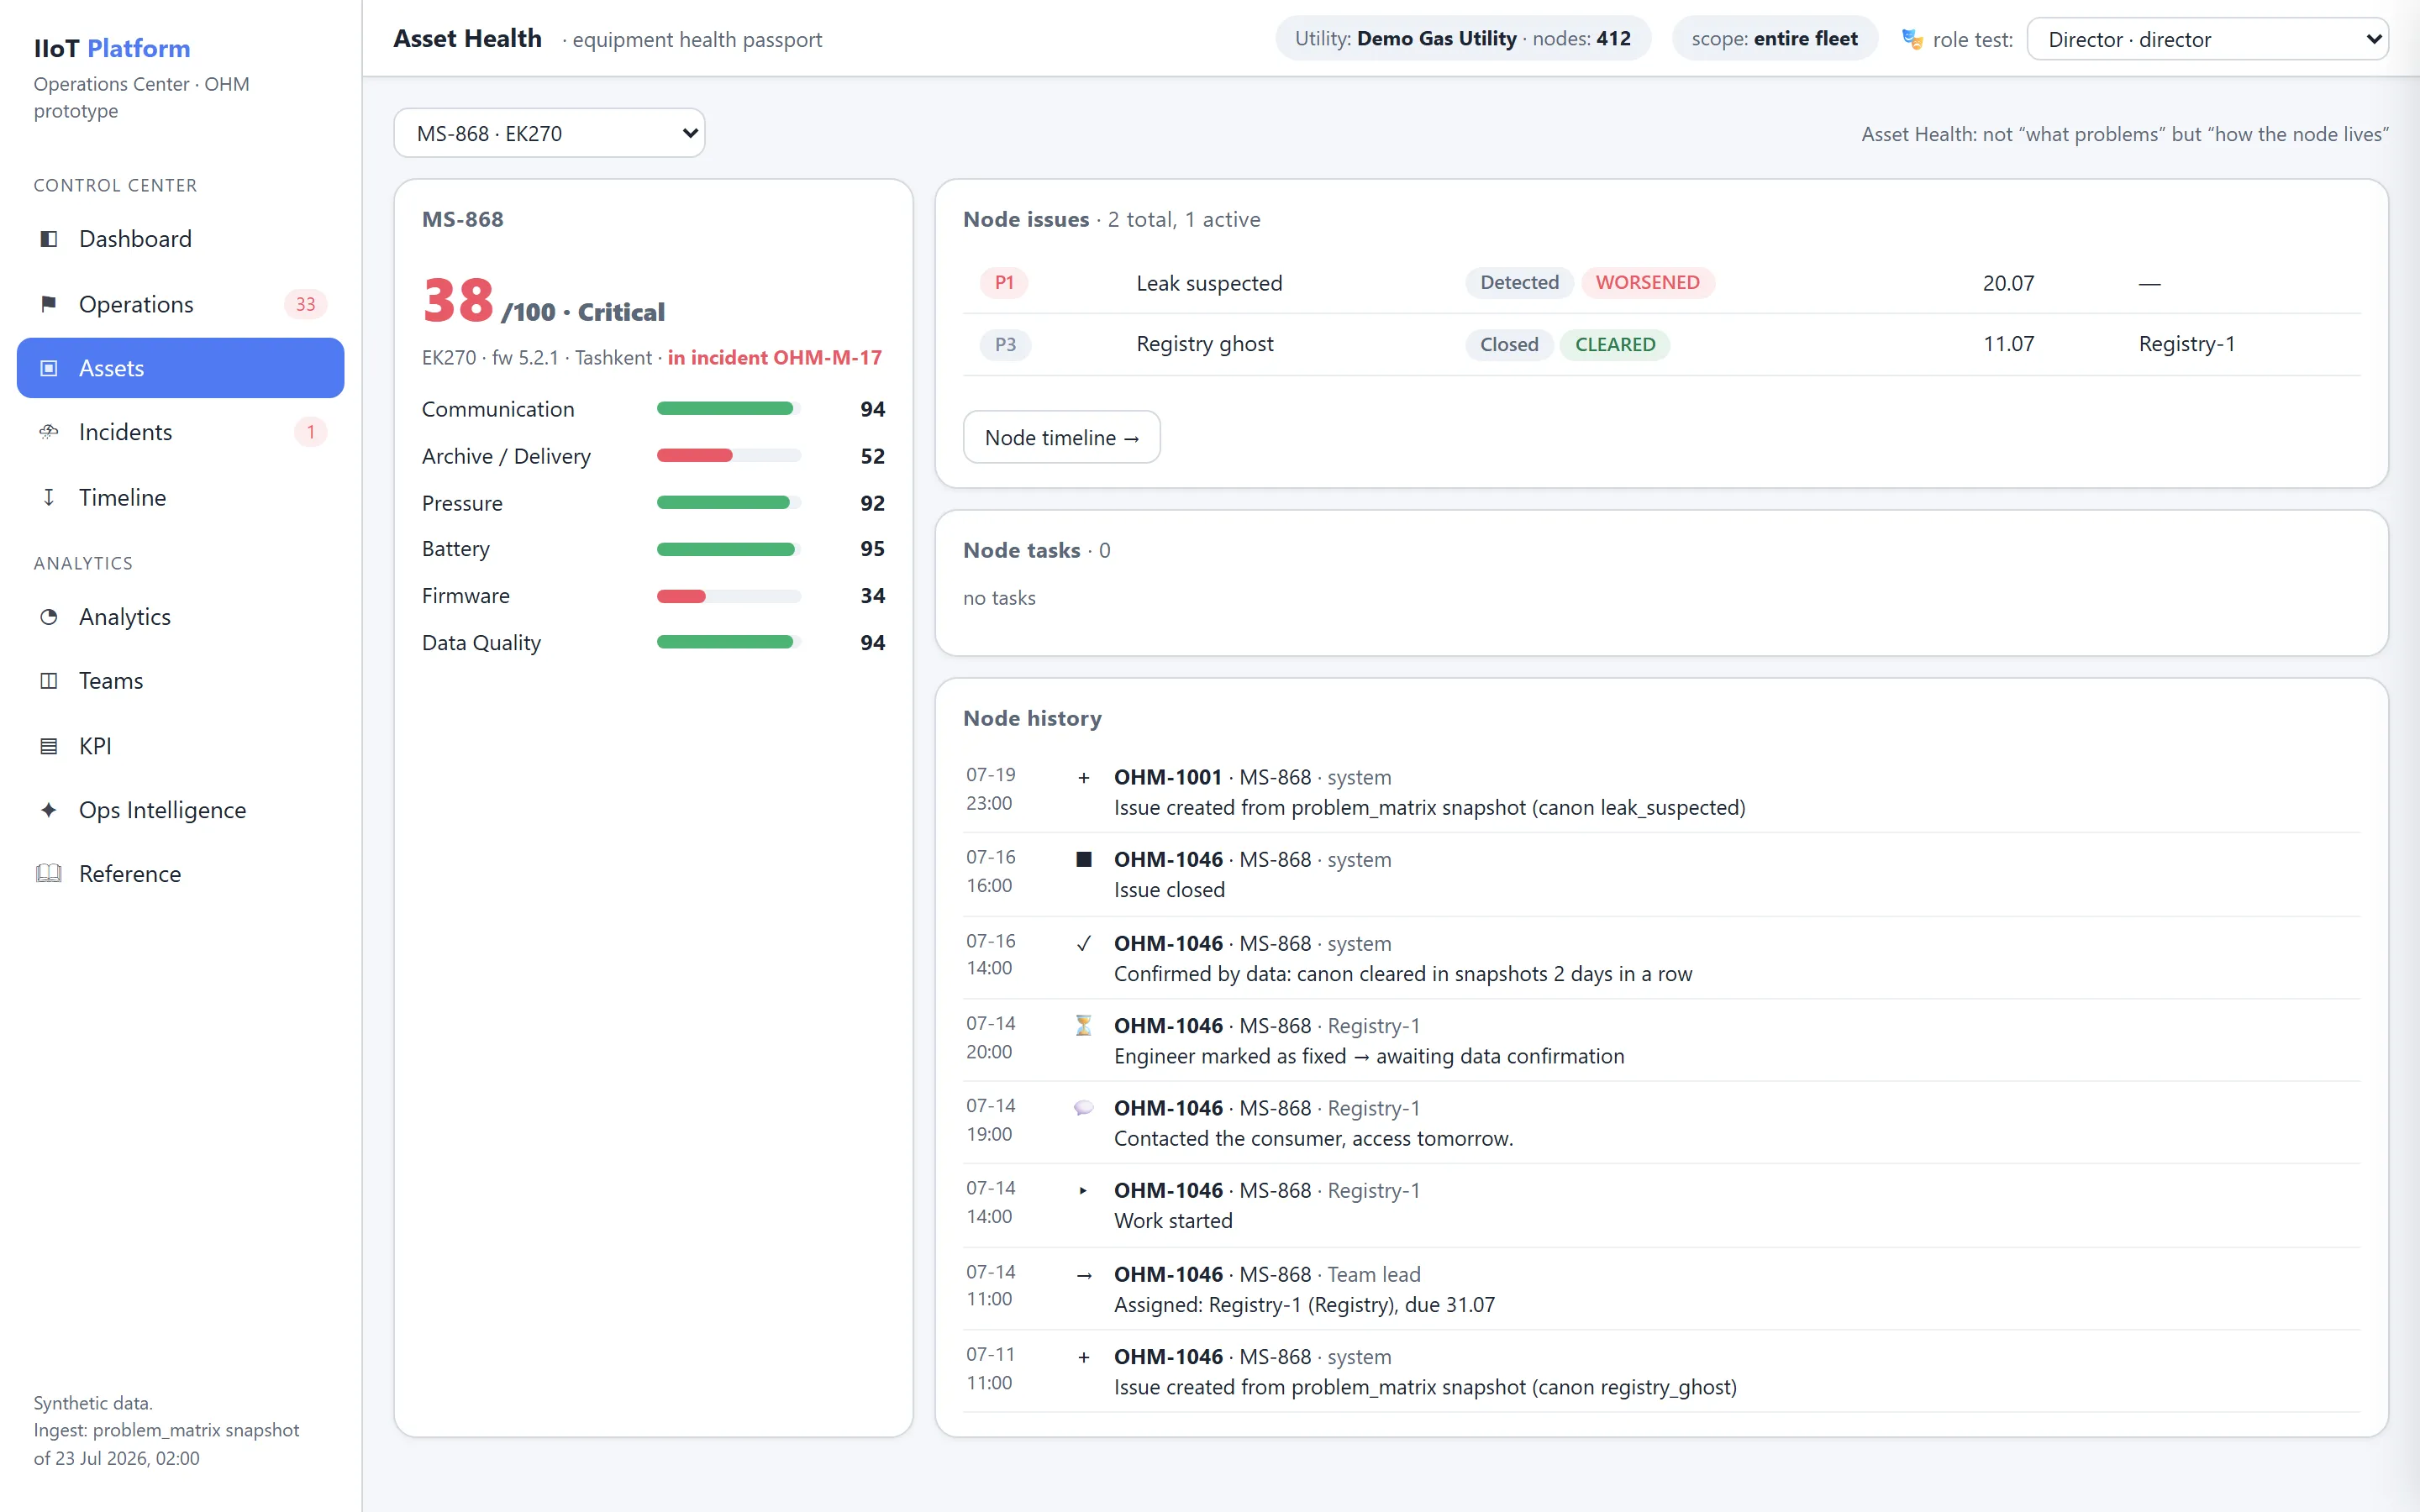
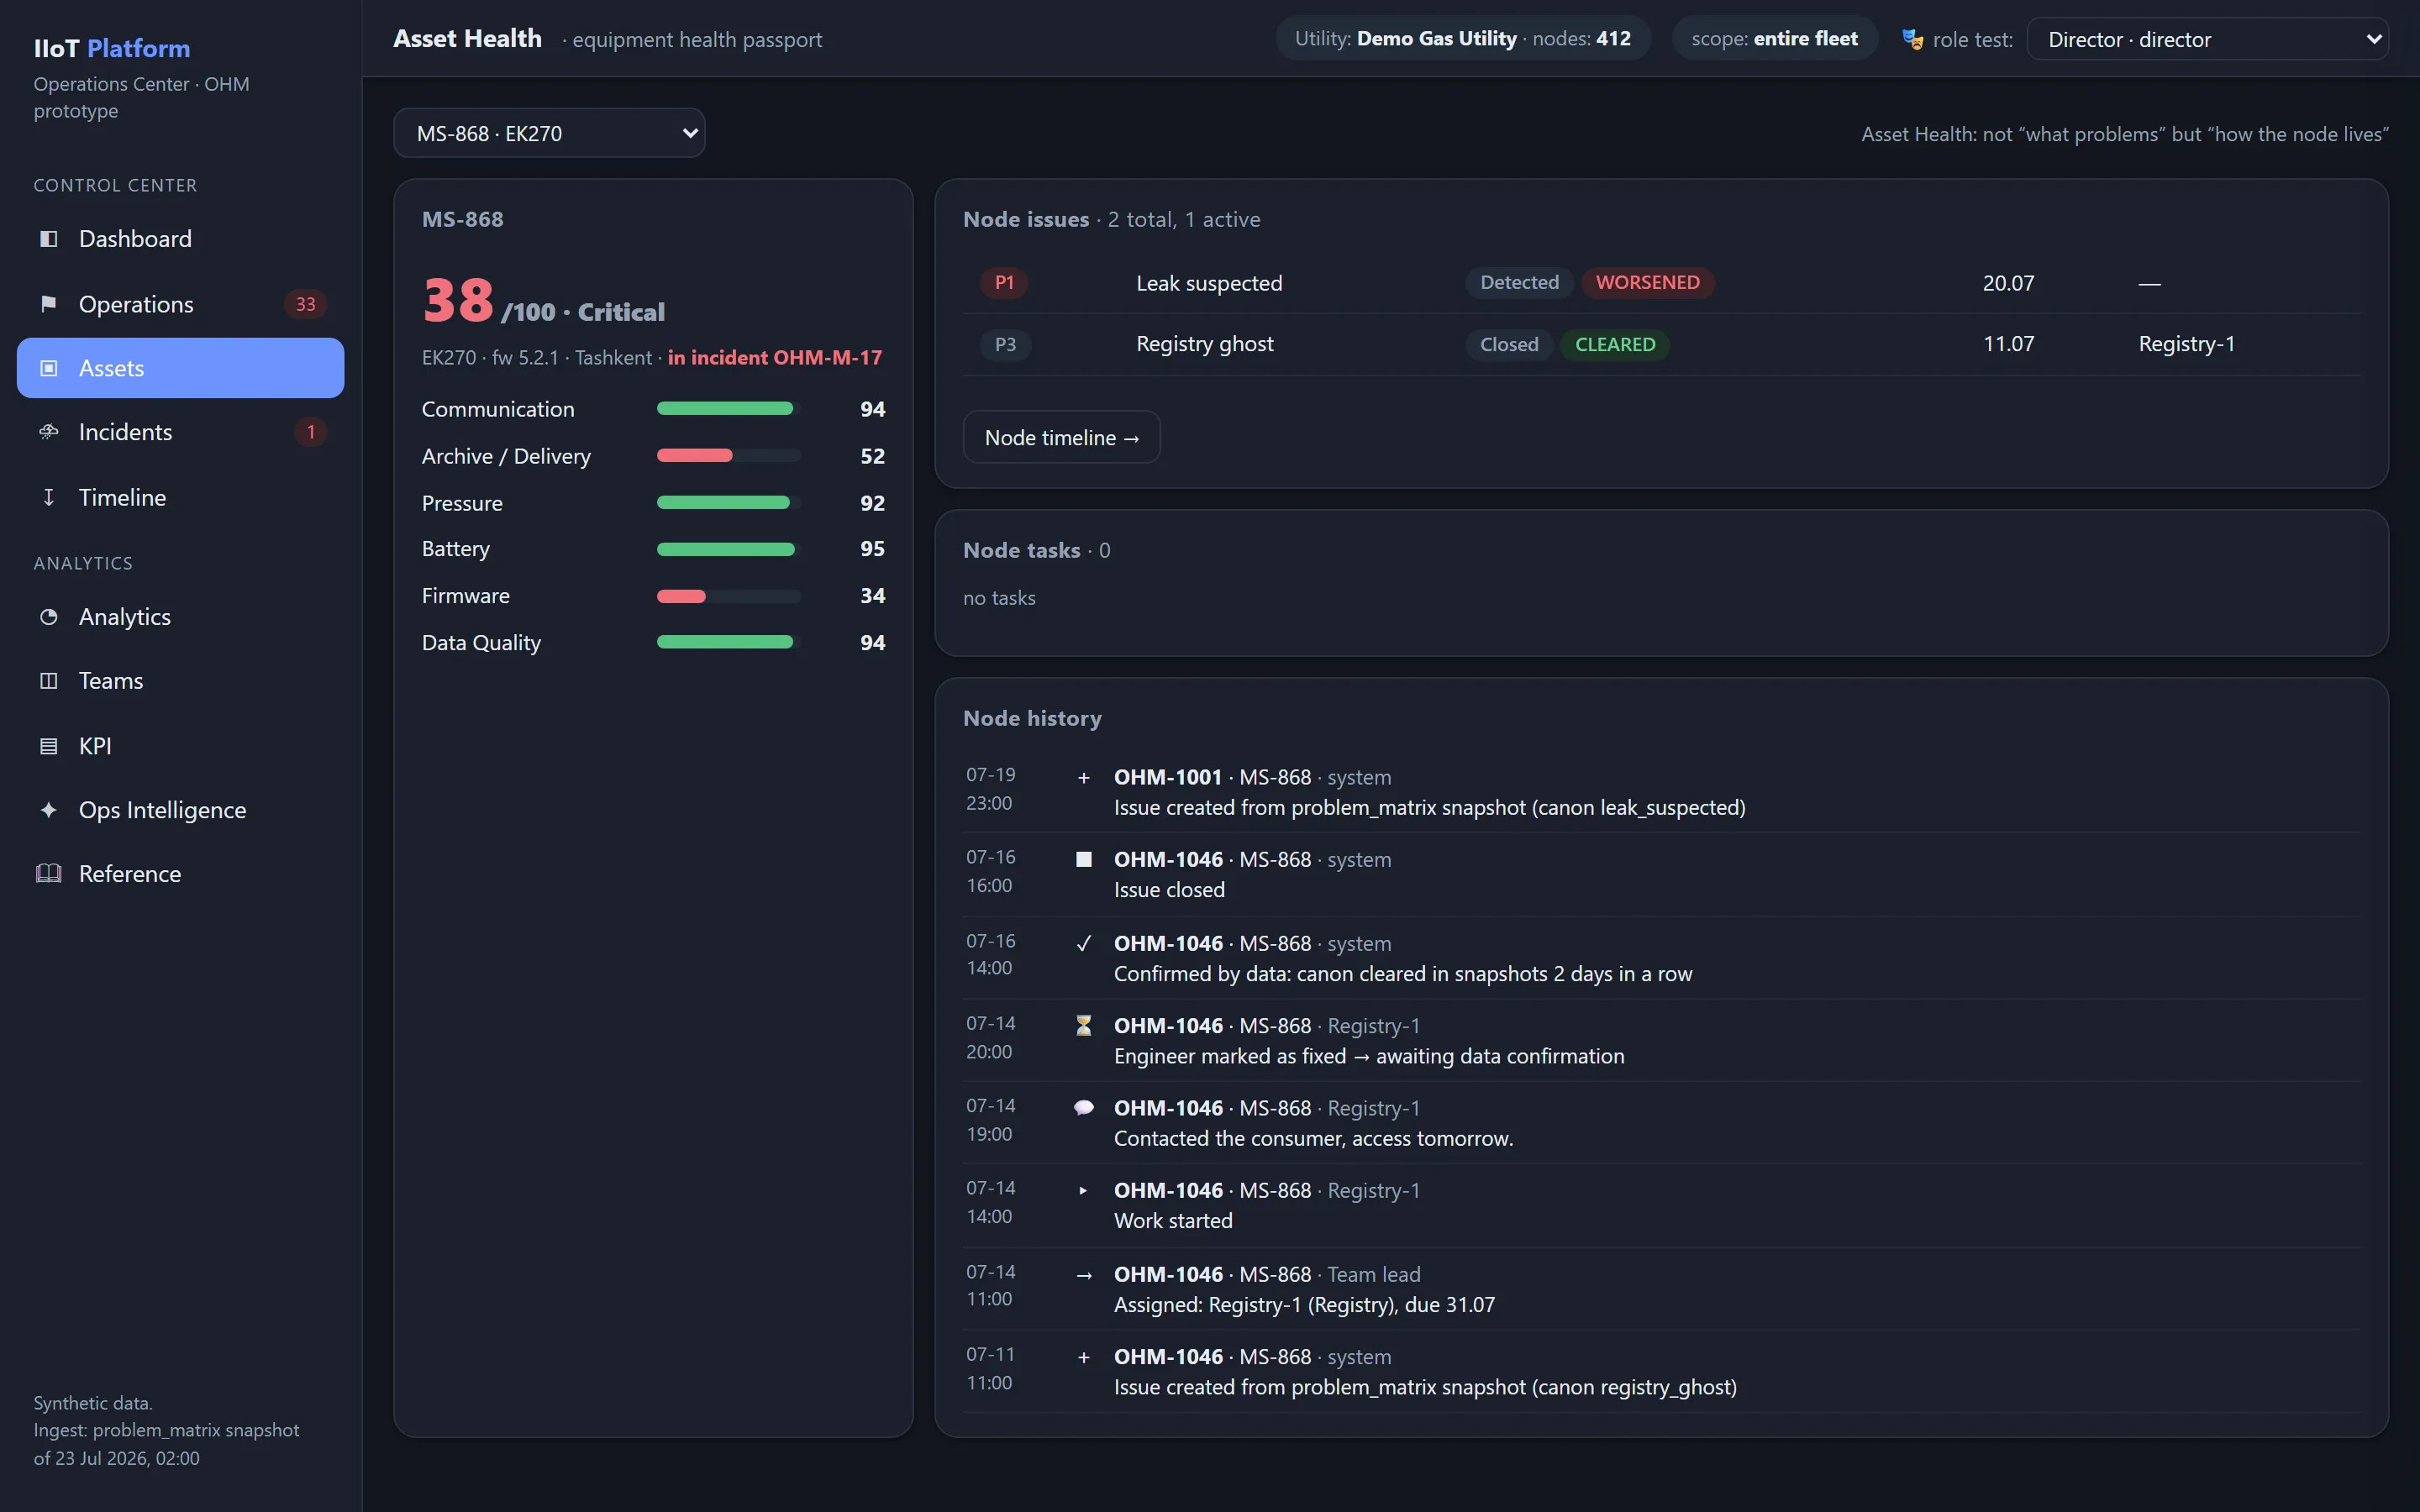
Domaines de santé
L’état de l’actif est évalué selon plusieurs domaines indépendants.
| Domaine | Finalité |
|---|---|
| Communication | qualité de la communication |
| Archive | complétude des archives |
| Metering | fiabilité des mesures |
| Pressure | fonctionnement du canal de pression |
| Temperature | fonctionnement du canal de température |
| Power | alimentation et batterie |
| Configuration | exactitude des paramètres |
| Registry | conformité au registre |
| Firmware | stabilité de la version logicielle |
| Integrity | signes d’altération |
| Security | sécurité d’exploitation |
Chaque indicateur est calculé indépendamment.
Composantes de la santé
Le Health Score est un indicateur agrégé.
Par exemple :
| Domaine | Score |
|---|---|
| Communication | 100 |
| Archive | 96 |
| Metering | 99 |
| Pressure | 100 |
| Temperature | 100 |
| Power | 71 |
| Firmware | 98 |
| Registry | 100 |
| Integrity | 100 |
| Security | 100 |
L’état final est déterminé après normalisation de toutes les composantes.
États de santé
Chaque actif se trouve dans l’un des états d’exploitation.
| État | Signification |
|---|---|
| Excellent | pleinement opérationnel |
| Good | écarts mineurs |
| Attention | surveillance requise |
| Degraded | exploitation dégradée |
| Critical | risque de défaillance élevé |
| Failed | l’actif n’assure pas sa fonction |
Les valeurs de seuil sont définies par la politique de l’organisation.
Tendance de la santé
OHM conserve non seulement la valeur courante, mais aussi le sens de son évolution.
flowchart TD
    EXC["Excellent"] --> GOOD["Good"]
    GOOD --> ATT["Attention"]
    ATT --> DEG["Degraded"]
    DEG --> CRIT["Critical"]
Le système calcule simultanément :
- la vitesse de dégradation ;
- la durée de l’état courant ;
- le nombre de transitions ;
- la récurrence.
Cela permet d’identifier les équipements encore en fonctionnement, mais qui perdent rapidement en stabilité.
Actifs chroniques
Un actif reçoit automatiquement le marqueur Chronic lorsque les mêmes Operational Issues se répètent de manière persistante.
Par exemple :
- cinq remplacements de batterie en un an ;
- pertes d’archives permanentes ;
- problèmes de communication réguliers ;
- réouvertures multiples du même canon.
Un tel équipement exige une analyse distincte, même s’il fonctionne correctement pour le moment.
Santé de l’écosystème (Ecosystem Health)
Asset Health évalue un équipement pris individuellement.
Ecosystem Health caractérise l’état de l’ensemble de l’infrastructure.
Le calcul intègre :
- tous les actifs en service ;
- toutes les Operational Issues ;
- la criticité des problèmes ;
- les incidents massifs ;
- la qualité des données ;
- l’état de l’infrastructure de communication ;
- les KPI d’exploitation.
Santé hiérarchique
OHM calcule l’état à chaque niveau.
flowchart TD
    A["Actif"] --> ST["Station"]
    ST --> D["District"]
    D --> R["Région"]
    R --> ORG["Organisation"]
    ORG --> ECO["Écosystème complet"]
Il devient ainsi possible d’identifier instantanément la région qui pèse le plus sur l’indicateur global.
Agrégation pondérée
Le calcul d’Ecosystem Health utilise un poids propre à chaque actif.
Ce poids peut tenir compte :
- du type d’équipement ;
- de l’importance commerciale ;
- du nombre de consommateurs ;
- de la catégorie de l’objet ;
- du volume de gaz transporté ;
- de l’impact sur la sécurité.
De ce fait, la défaillance d’une installation de secours n’a pas le même impact que celle d’un nœud central.
Carte de chaleur opérationnelle
Les résultats sont présentés sous forme de carte de chaleur.
Chaque région est colorée en fonction de son Health Score courant.
La carte affiche également :
- le nombre de Critical Issues ;
- les incidents massifs ;
- les violations de SLA ;
- Communication Health ;
- Archive Health ;
- une prévision de dégradation.
Indicateur Health Score
Le Health Score est un indicateur intégral de l’état d’exploitation d’un objet.
Il est destiné :
- à comparer les actifs ;
- à évaluer les régions ;
- à hiérarchiser les risques ;
- à évaluer l’efficacité de l’exploitation ;
- à analyser les évolutions.
Le Health Score ne remplace pas la télémétrie et ne masque pas l’information primaire.
Il constitue un indice d’exploitation agrégé.
Formule de base
Le modèle de base utilise une somme pondérée des domaines.
où la somme de tous les poids est égale à un.
Score de domaine (Domain Score)
Chaque domaine est calculé indépendamment.
Par exemple :
flowchart TD
    COM["Communication"] --> AV["Disponibilité"]
    COM --> FR["Fraîcheur des données"]
    COM --> SS["Stabilité des sessions"]
    COM --> SQ["Qualité du signal"]
    AV --> CS["Communication Score"]
    FR --> CS
    SS --> CS
    SQ --> CS
Les autres domaines sont calculés de la même manière.
Modèle de pénalités
Les Operational Issues réduisent l’indicateur final.
L’ampleur de la pénalité dépend :
- de la Severity ;
- de la Priority ;
- de la durée ;
- de la récurrence ;
- de la Root Cause confirmée ;
- de l’impact métier.
Par exemple :
flowchart LR
    CI["Critical Issue"] --> PEN["Pénalité"]
    PEN --> HSD["Le Health Score diminue"]
Une fois la remise en état confirmée, la pénalité est levée progressivement.
Rétablissement
OHM ne rétablit pas le Health Score instantanément.
Après la remise en état, une période de stabilisation s’applique.
Cela évite qu’un équipement bascule en permanence entre les états « sain » et « défaillant ».
Historique de l’indicateur
L’historique complet des variations de l’indicateur est conservé pour chaque objet.
Cela permet d’analyser :
- la dégradation ;
- l’impact des réparations ;
- l’efficacité de la maintenance ;
- les variations saisonnières ;
- la durée de vie des équipements.
L’historique n’est pas recalculé rétroactivement.
Prévision de la santé
Lorsque l’historique est suffisant, le système établit une prévision de l’évolution du Health Score.
La prévision s’appuie sur :
- la vitesse de dégradation ;
- la récurrence ;
- la saisonnalité ;
- les événements liés ;
- la qualité de la maintenance ;
- les résultats des réparations précédentes.
La prévision obtenue est utilisée exclusivement comme recommandation analytique et ne remplace pas le jugement de l’ingénieur.
Sujets connexes
Cette page vous a-t-elle été utile ?
Merci pour votre retour !