سلامت دارایی و اکوسیستم
مدلهای سلامت دارایی و اکوسیستم — دامنههای سلامت، Health Score تجمیعی با جریمهها و بازیابی، روندها، داراییهای مزمن و پیشبینی.
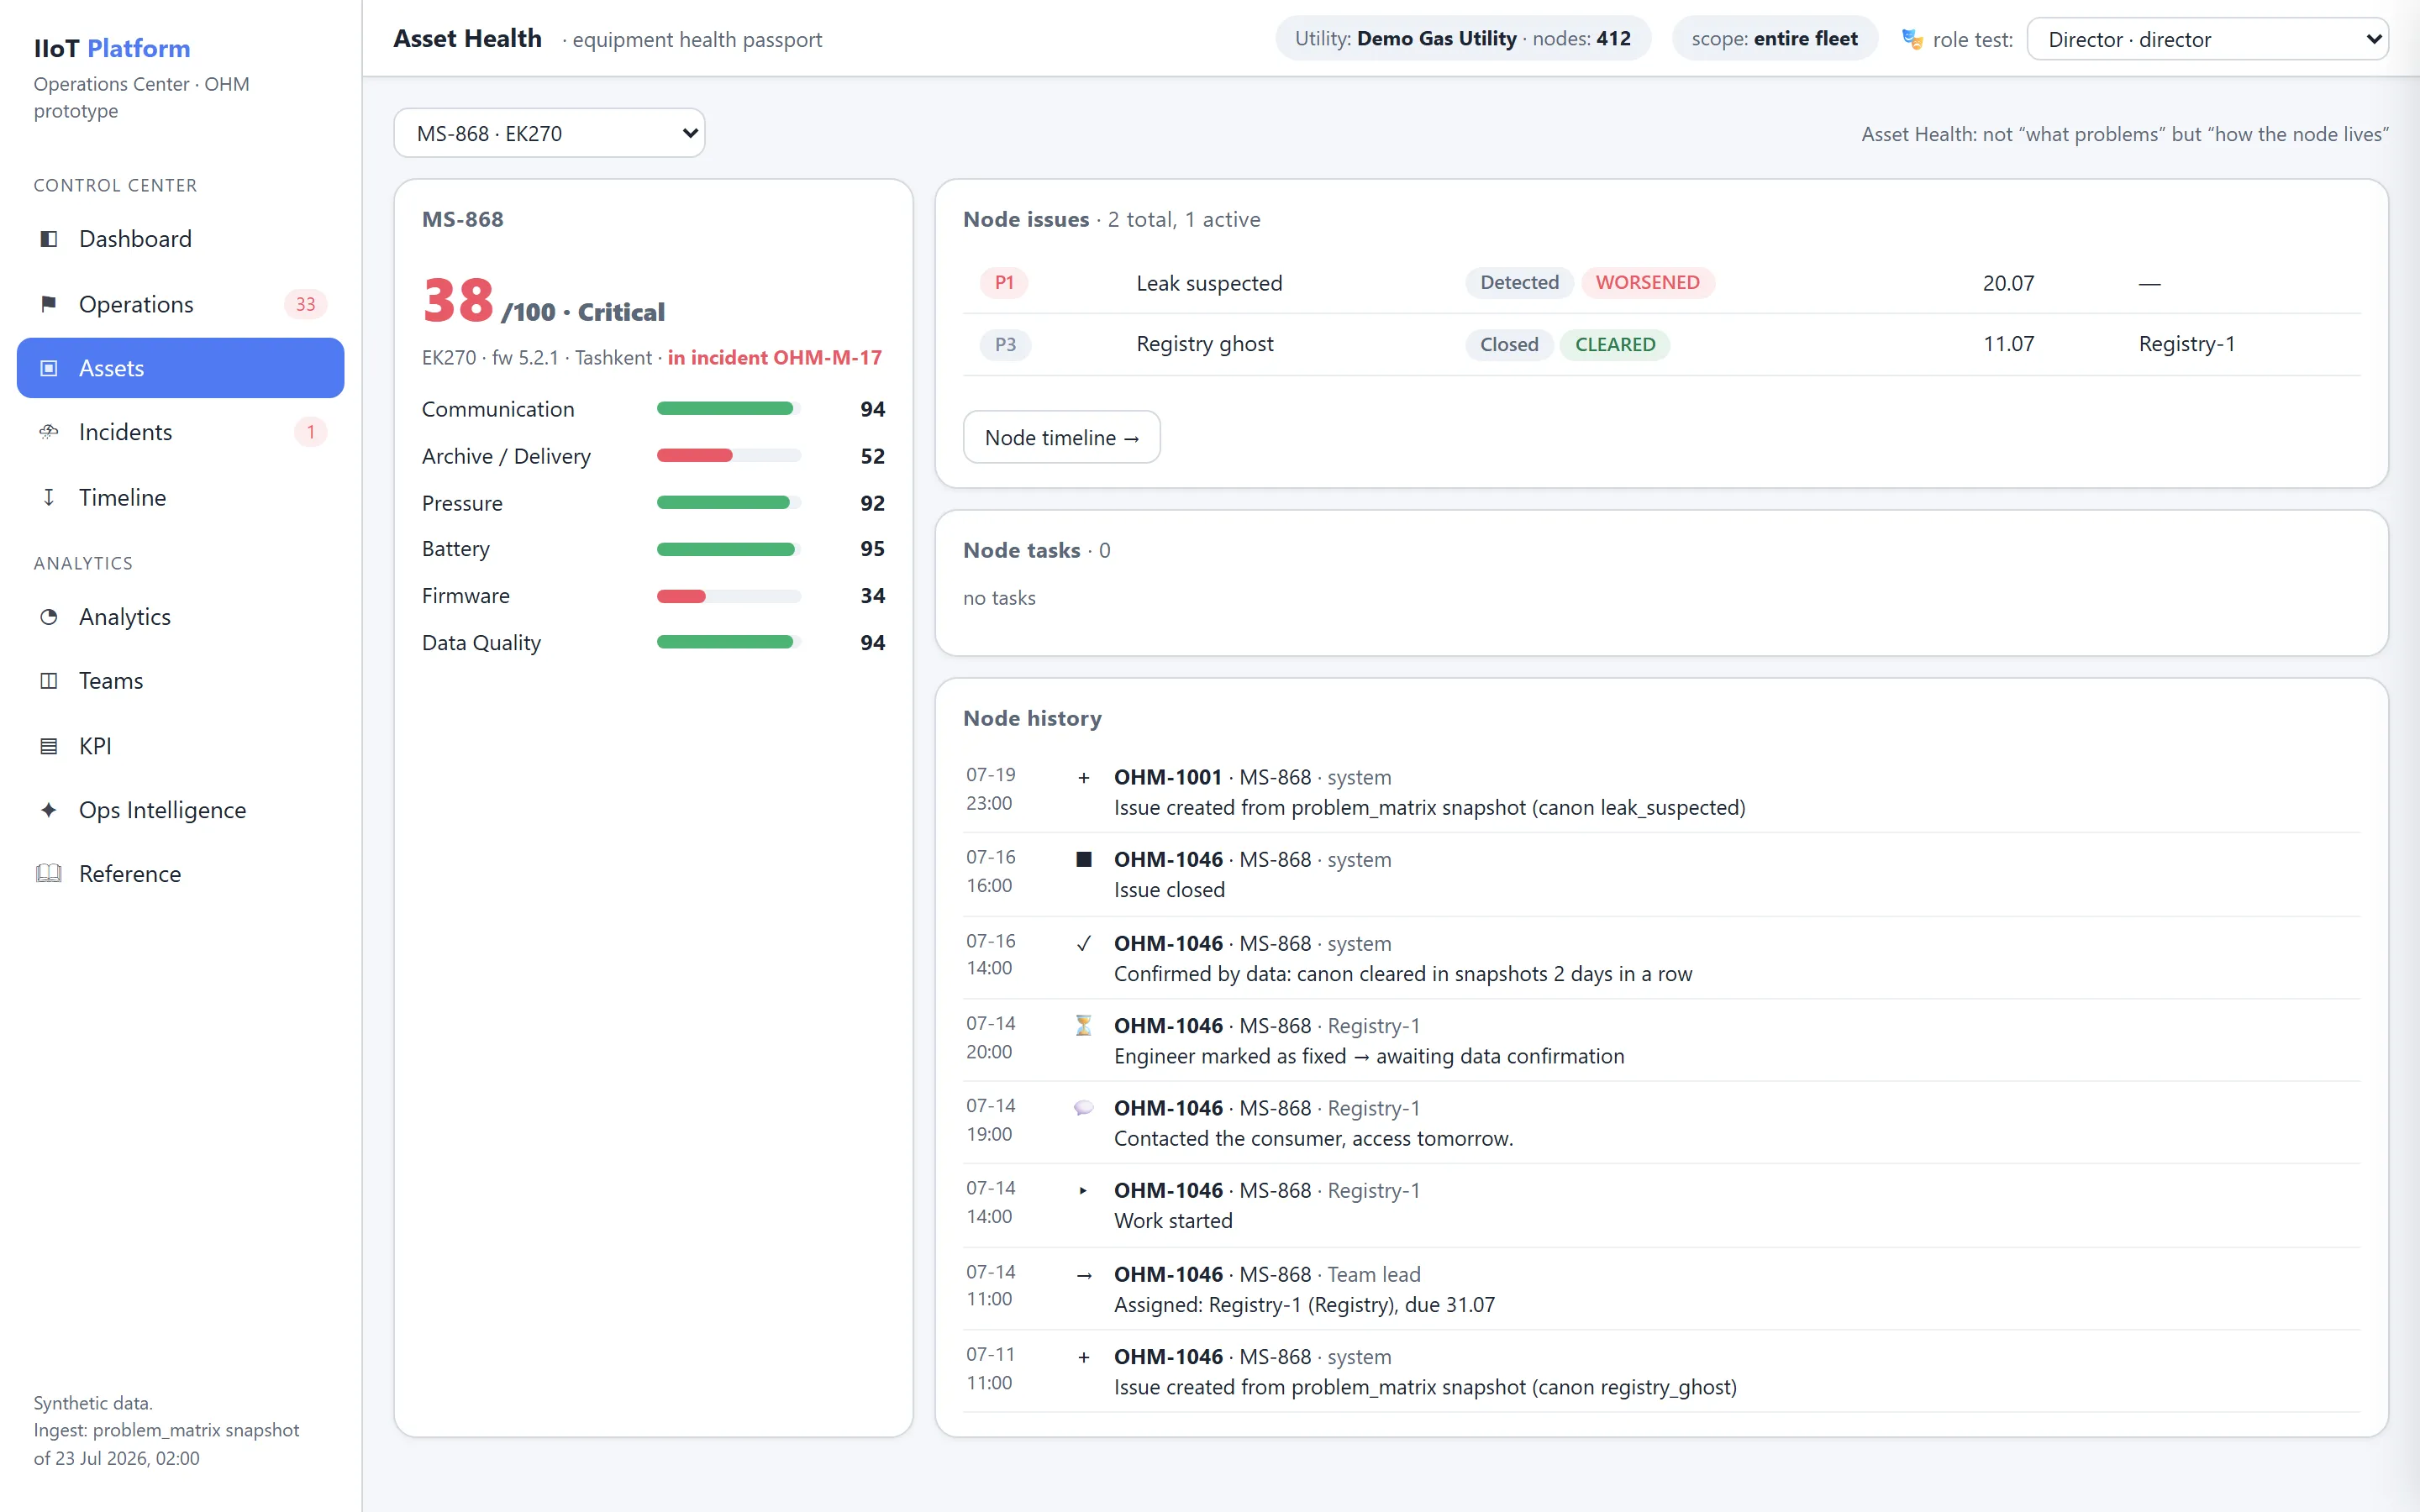
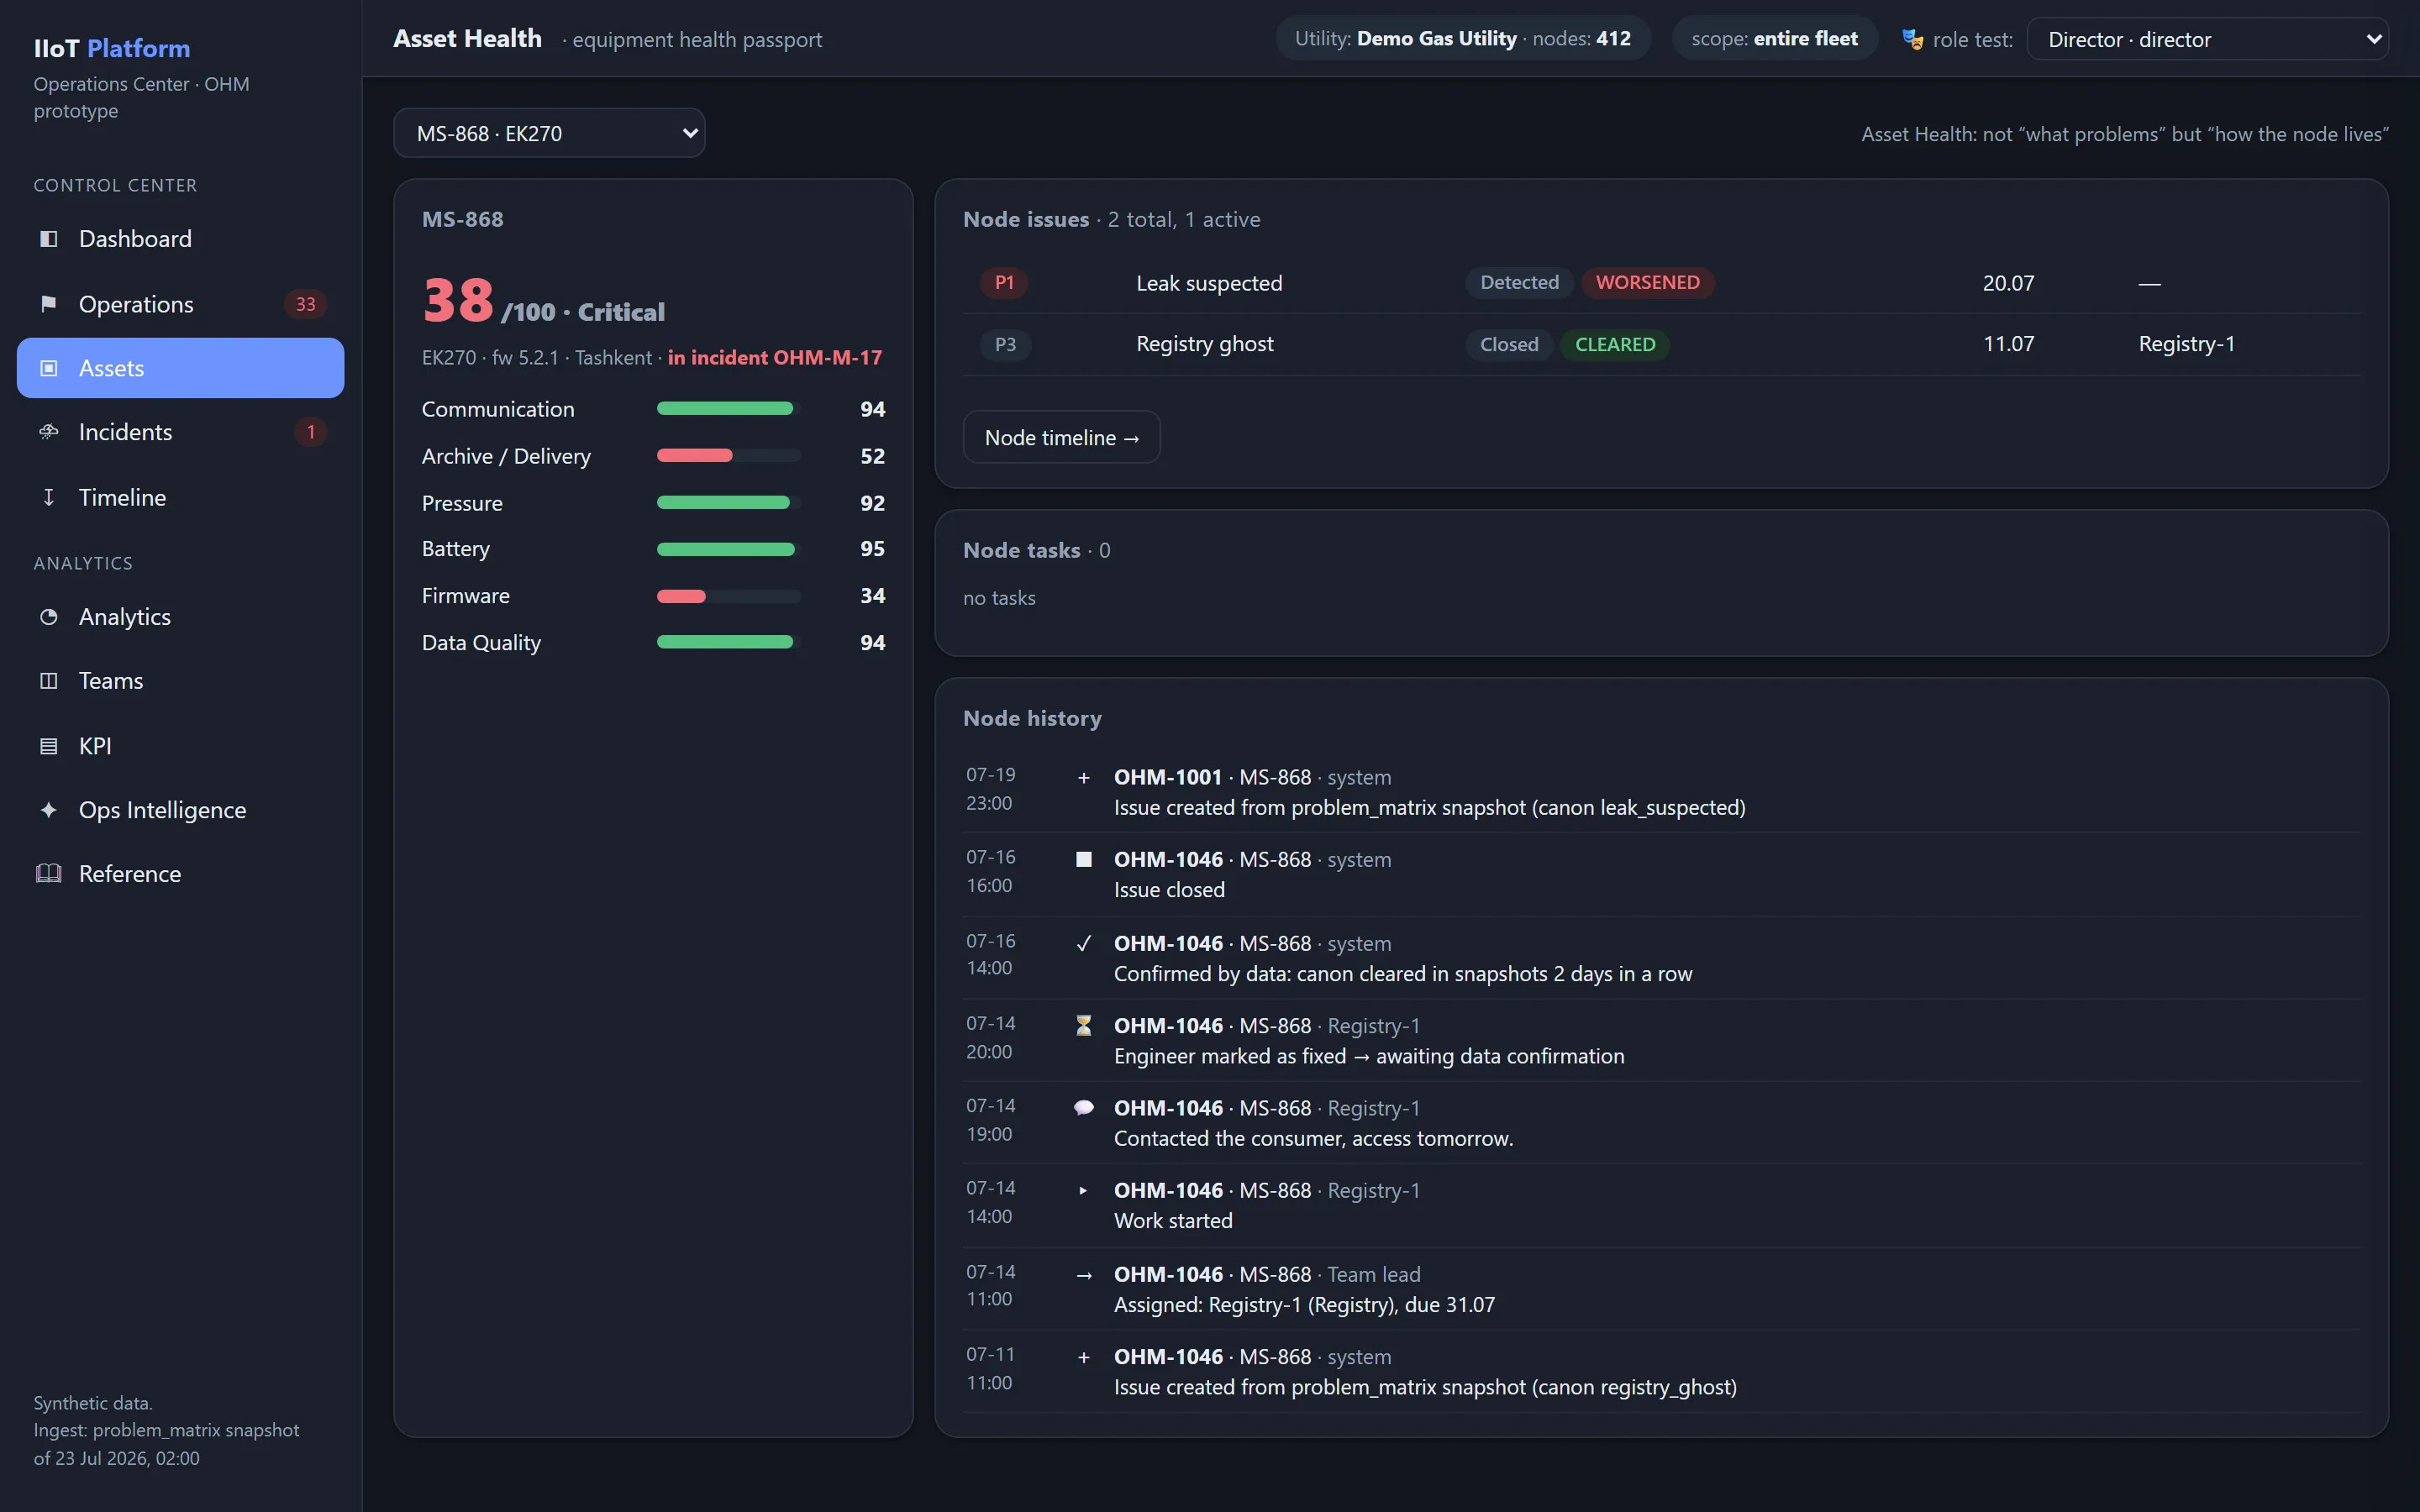
سلامت دارایی (Asset Health)
در مرکز Operational Health Matrix نه یک رویداد، نه یک هشدار و نه یک وظیفه، بلکه دارایی در حال بهرهبرداری قرار دارد.
هر دارایی وضعیت بهرهبرداری ویژهٔ خود را دارد که پیوسته بر پایهٔ تلهمتری، تاریخچهٔ بهرهبرداری، نتایج تحلیل و Operational Issues تأییدشده محاسبه میشود.
Asset Health این امکان را فراهم میکند که نهتنها وضعیت کنونی تجهیزات، بلکه روند تغییر آن، ریسک بهرهبرداری و تأثیر آن بر پایداری کلی زیرساخت نیز ارزیابی شود.
مدل Asset Health
هر دارایی با یک پروفایل دیجیتال واحد بازنمایی میشود.
flowchart TD
A["Asset"] --> CFG["پیکربندی"]
CFG --> TEL["تلهمتری"]
TEL --> EV["Evidence"]
EV --> ISSUE["Operational Issues"]
ISSUE --> MH["تاریخچهٔ نگهداری"]
MH --> HS["Health Score"]
HS --> PRED["پیشبینی"]کارت دارایی شامل این موارد است:
- شناسهها؛
- نوع تجهیزات؛
- سازنده؛
- مدل؛
- شمارهٔ سریال؛
- منطقه؛
- مختصات؛
- مالک؛
- سازمان؛
- پیکربندی کنونی؛
- تاریخچهٔ تغییرات؛
- Firmware نصبشده؛
- دستگاههای مرتبط؛
- دفتر ثبت نگهداری؛
- مشکلات فعال؛
- مشکلات رفعشده؛
- Health Score محاسبهشده.
دامنههای سلامت
وضعیت دارایی در چند دامنهٔ مستقل ارزیابی میشود.
| دامنه | هدف |
|---|---|
| Communication | کیفیت ارتباط |
| Archive | کاملبودن آرشیوها |
| Metering | اعتبار اندازهگیریها |
| Pressure | کارکرد کانال فشار |
| Temperature | کارکرد کانال دما |
| Power | تغذیه و باتری |
| Configuration | درستی پارامترها |
| Registry | انطباق با فهرست ثبت |
| Firmware | پایداری نسخهٔ نرمافزار |
| Integrity | نشانههای دستکاری |
| Security | امنیت بهرهبرداری |
هر شاخص بهصورت مستقل محاسبه میشود.
مؤلفههای سلامت
Health Score یک شاخص تجمیعی است.
برای نمونه:
| دامنه | امتیاز |
|---|---|
| Communication | 100 |
| Archive | 96 |
| Metering | 99 |
| Pressure | 100 |
| Temperature | 100 |
| Power | 71 |
| Firmware | 98 |
| Registry | 100 |
| Integrity | 100 |
| Security | 100 |
وضعیت نهایی پس از نرمالسازی همهٔ مؤلفهها تعیین میشود.
وضعیتهای سلامت
هر دارایی در یکی از وضعیتهای بهرهبرداری قرار دارد.
| وضعیت | معنا |
|---|---|
| Excellent | کاملاً سالم |
| Good | انحرافهای جزئی |
| Attention | نیازمند پایش |
| Degraded | بهرهبرداری تنزل یافته است |
| Critical | ریسک بالای خرابی |
| Failed | دارایی وظیفهٔ خود را انجام نمیدهد |
مقادیر آستانه را سیاست سازمان تعیین میکند.
روند سلامت
OHM نهتنها مقدار کنونی، بلکه جهت تغییر را نیز نگه میدارد.
flowchart TD
    EXC["Excellent"] --> GOOD["Good"]
    GOOD --> ATT["Attention"]
    ATT --> DEG["Degraded"]
    DEG --> CRIT["Critical"]
سامانه همزمان این موارد را محاسبه میکند:
- نرخ افت کارکرد؛
- مدتزمان وضعیت کنونی؛
- شمار گذارها؛
- تکرارشوندگی.
این کار امکان میدهد تجهیزاتی شناسایی شوند که هنوز کار میکنند، اما بهسرعت پایداری خود را از دست میدهند.
داراییهای مزمن (Chronic)
اگر همان Operational Issues بهطور پیوسته تکرار شوند، دارایی بهصورت خودکار برچسب Chronic میگیرد.
برای نمونه:
- پنج بار تعویض باتری در یک سال؛
- از دست رفتن دائمی آرشیوها؛
- مشکلات مرتب ارتباطی؛
- بازگشاییهای مکرر یک Canon واحد.
چنین تجهیزاتی به تحلیل جداگانه نیاز دارند، حتی اگر در حال حاضر درست کار کنند.
سلامت اکوسیستم (Ecosystem Health)
Asset Health یک دستگاه منفرد را ارزیابی میکند.
Ecosystem Health وضعیت کل زیرساخت را توصیف میکند.
موارد زیر در محاسبه لحاظ میشوند:
- همهٔ داراییهای فعال؛
- همهٔ Operational Issues؛
- میزان بحرانیبودن مشکلات؛
- رخدادهای گسترده؛
- کیفیت دادهها؛
- وضعیت زیرساخت ارتباطی؛
- KPIهای بهرهبرداری.
سلامت سلسلهمراتبی
OHM وضعیت را در هر سطح محاسبه میکند.
flowchart TD
    A["Asset"] --> ST["ایستگاه"]
    ST --> D["ناحیه"]
    D --> R["منطقه"]
    R --> ORG["سازمان"]
ORG --> ECO["کل اکوسیستم"]بدینترتیب میتوان بیدرنگ منطقهای را که بیشترین تأثیر را بر شاخص کلی دارد، مشخص کرد.
تجمیع وزنی
در محاسبهٔ Ecosystem Health برای هر دارایی یک وزن به کار میرود.
وزن میتواند این موارد را در نظر بگیرد:
- نوع تجهیزات؛
- اهمیت تجاری؛
- شمار مصرفکنندگان؛
- ردهٔ تأسیسات؛
- حجم گاز انتقالی؛
- تأثیر بر ایمنی.
در نتیجه، خرابی تأسیسات پشتیبان تأثیری همانند خرابی یک گره مرکزی ندارد.
نقشهٔ حرارتی عملیاتی
نتایج در قالب یک نقشهٔ حرارتی نمایش داده میشوند.
هر منطقه بر پایهٔ Health Score کنونی خود رنگآمیزی میشود.
افزون بر این، روی نقشه این موارد نمایش داده میشوند:
- شمار Critical Issues؛
- رخدادهای گسترده؛
- نقضهای SLA؛
- Communication Health؛
- Archive Health؛
- پیشبینی افت کارکرد.
شاخص Health Score
Health Score شاخصی یکپارچه از وضعیت بهرهبرداری یک شیء است.
این شاخص برای موارد زیر در نظر گرفته شده است:
- مقایسهٔ داراییها؛
- ارزیابی مناطق؛
- رتبهبندی ریسکها؛
- ارزیابی کارایی بهرهبرداری؛
- تحلیل روند تغییرات.
Health Score جایگزین تلهمتری نیست و اطلاعات اولیه را پنهان نمیکند.
این شاخص یک نمایهٔ تجمیعی بهرهبرداری است.
فرمول پایه
مدل پایه از مجموع وزنی دامنهها استفاده میکند.
که در آن مجموع همهٔ وزنها برابر یک است.
شاخص دامنه (Domain Score)
هر دامنه بهصورت مستقل محاسبه میشود.
برای نمونه:
flowchart TD
COM["Communication"] --> AV["دسترسپذیری"]
COM --> FR["تازگی داده"]
COM --> SS["پایداری نشستها"]
COM --> SQ["کیفیت سیگنال"]
AV --> CS["Communication Score"]
FR --> CS
SS --> CS
SQ --> CSبقیهٔ دامنهها نیز به همین شیوه محاسبه میشوند.
مدل جریمهها
Operational Issues شاخص نهایی را کاهش میدهند.
اندازهٔ جریمه به این موارد بستگی دارد:
- Severity؛
- Priority؛
- مدتزمان؛
- تکرارشوندگی؛
- Root Cause تأییدشده؛
- تأثیر بر کسبوکار.
برای نمونه:
flowchart LR
    CI["Critical Issue"] --> PEN["جریمه"]
    PEN --> HSD["کاهش Health Score"]
پس از رفع تأییدشده، جریمه بهتدریج برداشته میشود.
بازیابی
OHM شاخص Health Score را بیدرنگ بازنمیگرداند.
پس از رفع مشکل، یک دورهٔ تثبیت اعمال میشود.
این کار مانع وضعیتی میشود که در آن دستگاه پیوسته میان حالتهای «سالم» و «معیوب» جابهجا شود.
تاریخچهٔ شاخص
برای هر شیء، تاریخچهٔ کامل تغییرات شاخص نگهداری میشود.
این کار امکان تحلیل موارد زیر را فراهم میکند:
- افت کارکرد؛
- تأثیر تعمیرات؛
- اثربخشی نگهداری؛
- تغییرات فصلی؛
- عمر مفید تجهیزات.
تاریخچه با اثر بازگشتی بازمحاسبه نمیشود.
پیشبینی سلامت
در صورت وجود تاریخچهٔ کافی، سامانه تغییرات Health Score را پیشبینی میکند.
این پیشبینی بر پایهٔ موارد زیر انجام میشود:
- نرخ افت کارکرد؛
- تکرارشوندگی؛
- فصلیبودن؛
- رویدادهای مرتبط؛
- کیفیت نگهداری؛
- نتایج تعمیرات پیشین.
پیشبینی بهدستآمده صرفاً بهعنوان یک توصیهٔ تحلیلی به کار میرود و جایگزین قضاوت مهندسی نمیشود.
موضوعات مرتبط
آیا این صفحه مفید بود؟
از بازخورد شما سپاسگزاریم!