Operational Health Matrix (OHM)
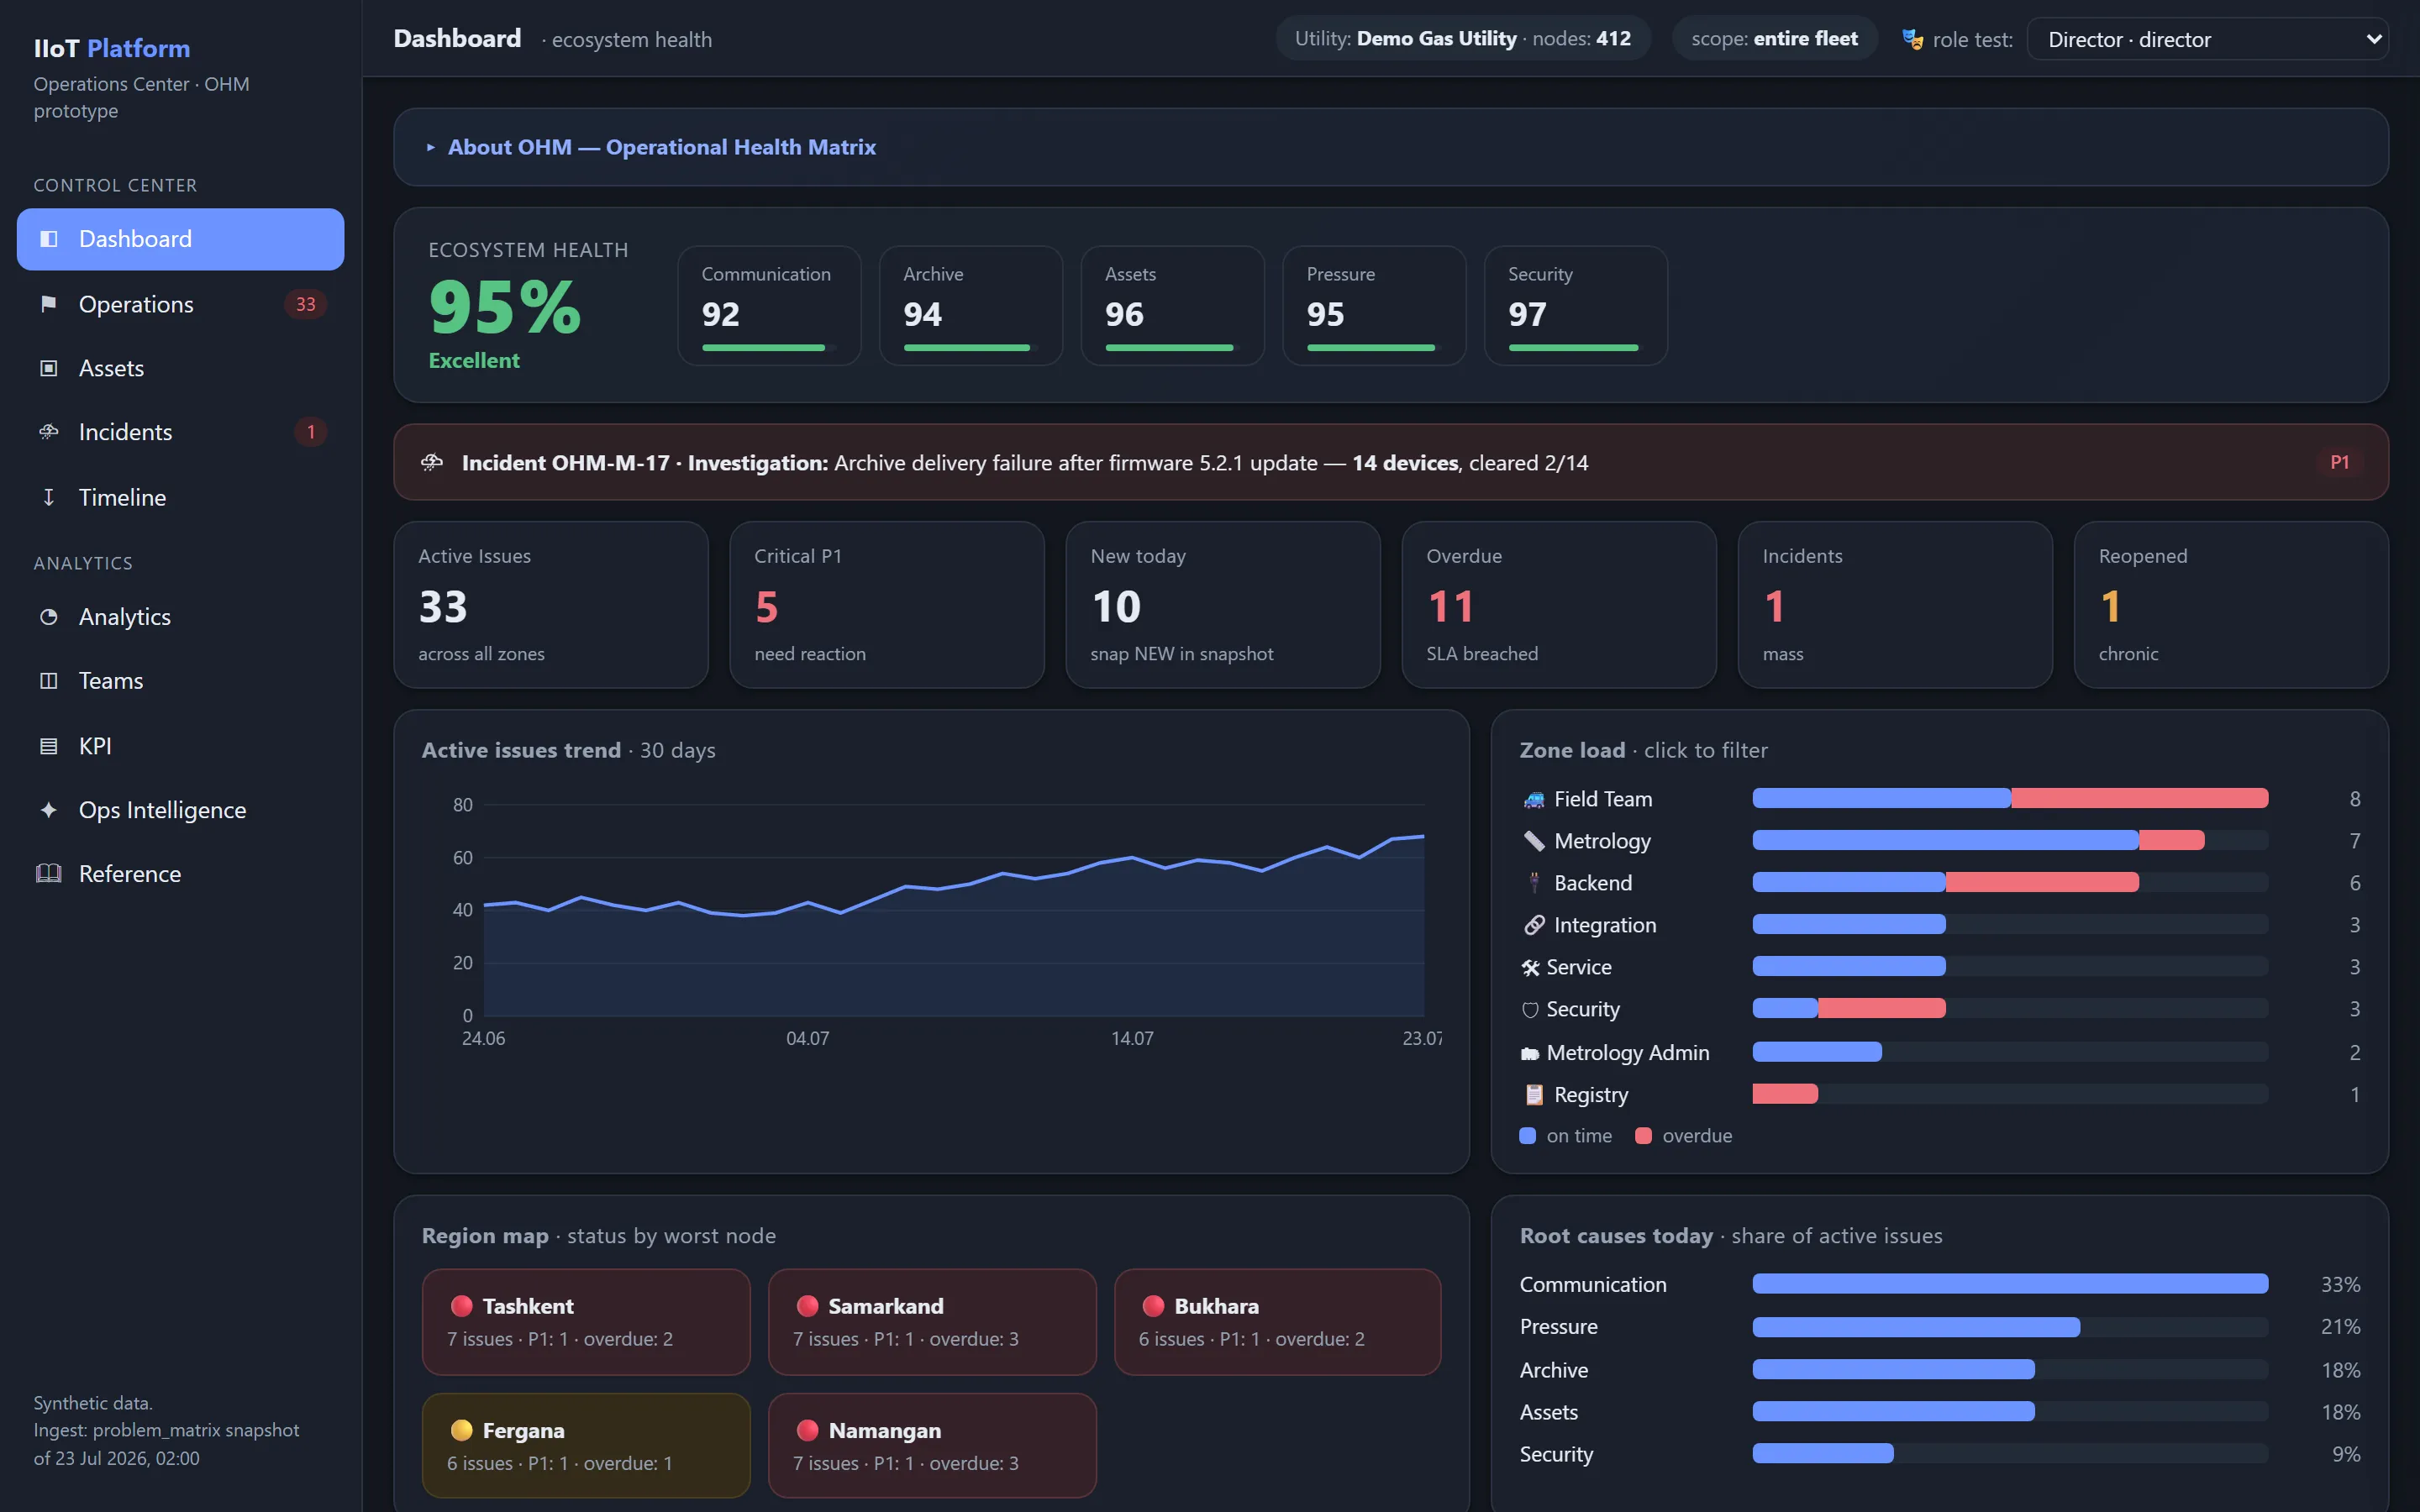
Operational Health Matrix est le centre de commandement opérationnel de la Data Platform : il transforme la télémétrie et les résultats de l'analytique en un cycle de travail piloté, de la détection automatique d'un problème jusqu'à une résolution confirmée par les données.
Operational Health Matrix (OHM) est le module opérationnel central de la Data Platform. Il transforme le flux de télémétrie, les résultats de l’analytique et les événements d’exploitation en un cycle de travail piloté : de la détection automatique d’un problème jusqu’à une résolution confirmée par les données.
OHM réunit dans un système unique :
- la détection des problèmes techniques, métrologiques et d’intégration ;
- la corrélation des symptômes et l’identification de la cause racine probable ;
- la création et la gestion des objets
Operational Issue; - l’affectation des équipes responsables et des intervenants ;
- le pilotage des délais, des priorités et des SLA ;
- le suivi des tâches, des commentaires, des preuves et de l’historique des actions ;
- la vérification automatique du résultat au regard des nouvelles données ;
- la gestion des incidents massifs ;
- l’évaluation de l’état des équipements et du parc ;
- le calcul des KPI d’exploitation et des KPI d’équipe ;
- la capitalisation des solutions confirmées dans la base de connaissances ;
- l’analyse assistée par AI, sans déléguer à l’intelligence artificielle le pouvoir de décision sur les sujets critiques.
flowchart TD
  A["Télémétrie"] --> B["Détecteurs"]
  B --> C["Evidence"]
  C --> D["Corrélation et Root Cause"]
  D --> E["Operational Issue"]
  E --> F["Affectation et exécution"]
  F --> G["Vérification par les données"]
  G --> H["Clôture et Knowledge Base"]
  H --> I["KPI et amélioration continue"]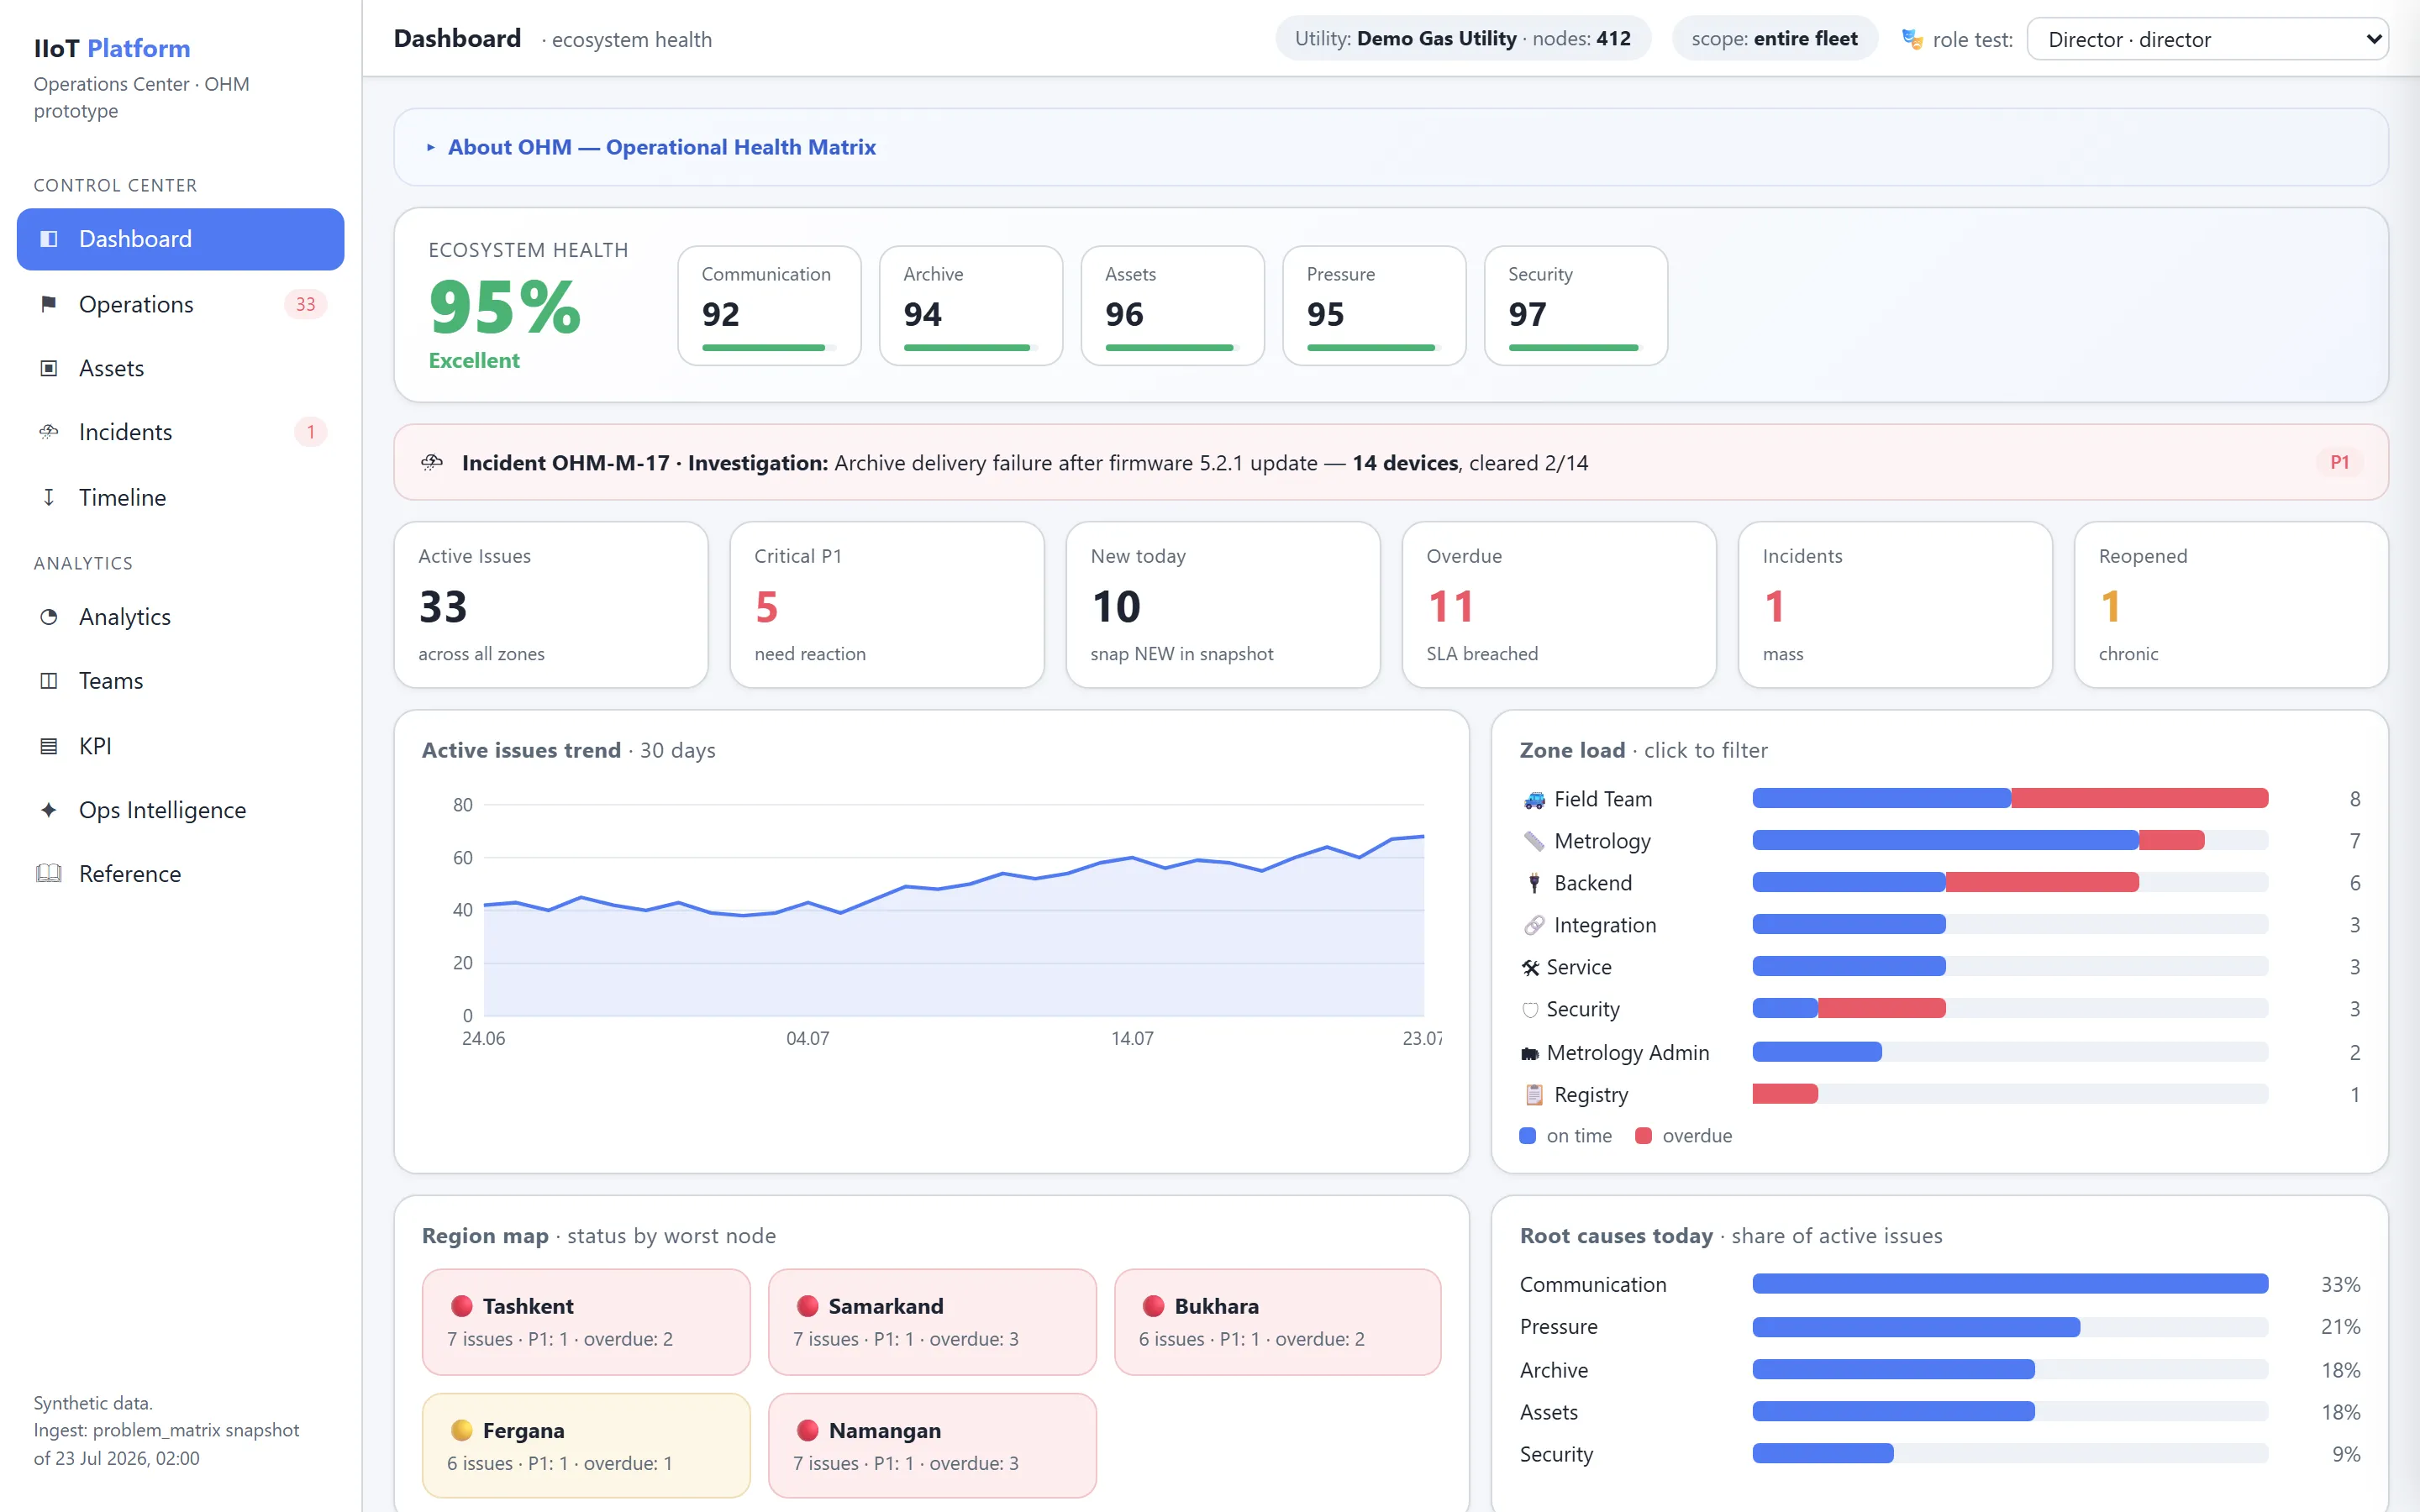
Finalité du module
Les systèmes de télémétrie traditionnels répondent bien à la question suivante :
Que s’est-il passé sur l’appareil ou dans les données ?
Mais cela ne suffit pas pour piloter un parc de grande taille. Une fois l’événement détecté, l’organisation doit déterminer :
- si le signal correspond à un problème réel ;
- s’il concerne un seul appareil ou constitue un incident systémique ;
- quels autres symptômes se rattachent à la même cause racine ;
- qui est responsable de la résolution ;
- dans quel délai les travaux doivent être achevés ;
- quelles actions ont déjà été menées ;
- si la résolution est confirmée par des données objectives ;
- si le problème est récurrent ;
- quelle est l’efficacité réelle du processus d’exploitation.
OHM couvre l’intégralité de ce cycle.
Le résultat principal du module n’est ni une notification ni une ligne de rapport, mais un objet d’exploitation piloté qui possède :
- un identifiant ;
- un type de problème ;
- les actifs concernés ;
- des preuves ;
- une criticité (Severity) ;
- un niveau de confiance ;
- une cause racine probable et confirmée ;
- un propriétaire ;
- un intervenant ;
- une échéance ;
- des tâches ;
- un historique ;
- un état de vérification ;
- un résultat de résolution ;
- un lien vers la base de connaissances ;
- un impact sur les KPI.
Avantage clé
La plateforme ne se limite pas à consigner les écarts. La plateforme accompagne le problème jusqu’à un résultat confirmé.
flowchart TD
  subgraph OPS["Data Platform et OHM"]
    direction TB
    O1["A détecté le problème"] --> O2["A vérifié les preuves"]
    O2 --> O3["A regroupé les signaux liés"]
    O3 --> O4["A déterminé la priorité"]
    O4 --> O5["A désigné la zone de responsabilité"]
    O5 --> O6["Suit l'échéance"]
    O6 --> O7["A vérifié le résultat par les données"]
    O7 --> O8["A enregistré la solution confirmée"]
  end
  subgraph MON["Système de supervision"]
    direction TB
    M1["A détecté le problème"] --> M2["Le travail du système s'arrête ici"]
  end
OHM fait ainsi passer l’exploitation d’un mode réactif à un modèle piloté, dans lequel chaque écart significatif a un propriétaire, une échéance, des preuves et un résultat mesurable.
Principes fondamentaux
Des Issues plutôt que des alarmes
Une alarme isolée n’équivaut pas toujours à un problème d’exploitation.
Une seule défaillance physique peut générer des dizaines ou des centaines d’événements :
- pas de session de communication ;
- pas d’archive ;
- données obsolètes ;
- état de la batterie inconnu ;
- pas de pression courante ;
- erreur de livraison.
OHM ne crée pas une tâche distincte pour chaque symptôme. Le système corrèle les signaux et crée une seule Operational Issue lorsqu’ils relèvent d’une cause commune.
Une exploitation fondée sur les preuves
Toute conclusion automatique doit être explicable.
Une Issue contient :
- les valeurs sources ;
- les horodatages ;
- l’identifiant du détecteur ;
- la version de l’algorithme ;
- les seuils appliqués ;
- le lien vers le rapport spécialisé correspondant ;
- l’historique des récurrences ;
- les signaux liés ;
- le résultat de la corrélation.
L’utilisateur peut toujours remonter le chemin depuis la télémétrie brute jusqu’à l’Issue créée.
La cause racine (Root Cause) d’abord
OHM distingue :
- le symptôme — un écart observé ;
- la cause — le facteur technique ou organisationnel qui a produit l’écart ;
- la cause racine — le facteur primaire dont l’élimination empêche la réapparition de tout un groupe de symptômes.
Exemple :
flowchart LR
  S1["Symptôme 1 : archive horaire absente"] --> RC["Cause racine probable : dégradation de la source d'alimentation"]
  S2["Symptôme 2 : dernière session il y a 9 jours"] --> RC
  S3["Symptôme 3 : la tension de la batterie baissait"] --> RC
  S4["Symptôme 4 : la durée des sessions augmentait"] --> RC
Clôture confirmée par les données
L’intervenant déclare les travaux terminés, mais le statut final resolved n’est attribué qu’après vérification du résultat.
flowchart TD
  V1["Travaux terminés"] --> V2["awaiting_verification"]
  V2 --> V3["Les nouvelles données confirment le retour à la normale"]
  V3 --> V4["resolved"]
Pour les problèmes qui ne peuvent pas être vérifiés par la télémétrie, une vérification manuelle encadrée est appliquée, avec commentaire obligatoire et preuve à l’appui.
L’actif (Asset) au centre du modèle
Tous les événements, Issues, travaux et indicateurs sont rattachés à des actifs :
- points de comptage ;
- correcteurs ;
- compteurs ;
- capteurs ;
- modems ;
- passerelles ;
- cartes SIM ;
- composants serveur ;
- canaux d’intégration ;
- versions logicielles.
La fiche de l’actif affiche la santé courante, l’historique de dégradation, les Issues actives, les travaux réalisés et la récurrence des problèmes.
La responsabilité à l’humain, l’AI en appui
L’AI aide à :
- résumer les Evidence ;
- hiérarchiser les hypothèses ;
- retrouver des cas similaires ;
- proposer des solutions connues ;
- identifier de nouveaux clusters ;
- prévoir le risque de défaillance.
L’AI ne peut pas, de sa propre initiative :
- modifier la priorité ;
- désigner un responsable ;
- clôturer une Issue ;
- confirmer une cause racine comme un fait établi ;
- modifier les SLA ;
- exécuter des actions critiques sur les équipements.
Reproductibilité par conception
Tous les calculs significatifs sont reproductibles. Pour chaque résultat, la plateforme conserve :
- la version du détecteur ;
- la version du canon (Canon) ;
- la version du modèle de corrélation ;
- le jeu de données utilisé ;
- l’heure du calcul ;
- les seuils ;
- la configuration ;
- l’origine de la modification.
OHM dans l’architecture de la Data Platform
OHM se situe entre la couche analytique et le pilotage de l’exploitation.
flowchart TD
  PHY["Actifs physiques"] --> DATA["Couche de données et d'intégration IIoT"]
  DATA -->|"Données normalisées"| ANL["Analytique et détection"]
  ANL -->|"Evidence et résultats d'analyse"| OHM["Operational Health Matrix"]
  OHM -->|"API, événements, intégration"| ENT["Systèmes d'entreprise"]
Composition des couches :
| Couche | Composants |
|---|---|
| Actifs physiques | compteurs, correcteurs, capteurs, passerelles, vannes |
| Couche de données et d’intégration IIoT | télémétrie, archives, registre, passeports, événements |
| Analytique et détection | détecteurs canoniques, rapports approfondis, AI, corrélation |
| Operational Health Matrix | Issues, Tasks, SLA, vérification, KPI, base de connaissances |
| Systèmes d’entreprise | ERP, EAM, CMMS, Service Desk, BI, notifications |
Sources de données
OHM exploite :
- la télémétrie courante ;
- les archives horaires, journalières et événementielles ;
- les journaux des sessions de communication ;
- les données de passeport et de registre ;
- les statuts des appareils ;
- les données de la batterie ;
- la pression, la température, le débit et le volume ;
- les événements d’intervention non autorisée ;
- les versions de firmware ;
- les paramètres de communication ;
- les résultats des rapports spécialisés ;
- les observations manuelles des utilisateurs ;
- les événements provenant de systèmes externes.
Fournisseurs d’Evidence
Tout module analytique de la plateforme peut servir de source de preuves.
Exemples :
| Evidence Provider | Ce qu’il transmet à OHM |
|---|---|
| Matrice des problèmes du parc | problèmes canoniques et statuts quotidiens |
| Analytique de l’archive horaire | complétude, lacunes, queue d’archive, fiabilité des données |
| Analyse des sessions | durée, fréquence, anomalies de communication |
| Analyse de la pression | valeurs hors plage, pics, valeurs figées |
| Analyse de la température | anomalies, discordances, plausibilité physique |
| Suspicion d’intervention | signaux forensiques et niveau de confiance |
| Analyse de la batterie | tendance, seuils, prévision de durée de vie restante |
| Contrôle du passeport | paramètres manquants et contradictoires |
| Contrôle du registre | doublons, objets fantômes, identifiants incohérents |
| Analytique du firmware | clusters de problèmes par version logicielle |
Explorer le module
Les tableaux de bord par rôle, les files d'attente et les écrans dans lesquels les équipes travaillent chaque jour.
Les entités clés — Asset, Detector, Evidence, Issue, Task — et les liens entre elles.
L'objet Operational Issue et ses statuts, de la détection à la clôture confirmée par les données.
Comment les détecteurs transforment la télémétrie en définitions canoniques de problèmes, versionnées.
Preuves immuables, corrélation des symptômes et identification de la cause racine probable.
Comment la Severity et l'impact déterminent la priorité, les compteurs SLA et les chemins d'escalade.
Les tâches, les affectations, les commentaires et la file de travail qui fait avancer la résolution.
Les scores de santé calculés pour les actifs, les sites, les régions et l'ensemble de l'écosystème.
Les indicateurs qui mesurent le processus d'exploitation et les équipes qui le font vivre.
Les solutions confirmées, capitalisées et réutilisées pour les problèmes récurrents.
Synthèse, hiérarchisation et prévision assistées par AI, sans pouvoir de décision.
Le regroupement des Issues liées en un objet unique d'incident de grande ampleur.
API, systèmes externes, contrôle d'accès et exigences d'audit.
Sujets connexes
Cette page vous a-t-elle été utile ?
Merci pour votre retour !