Operational Health Matrix (OHM)
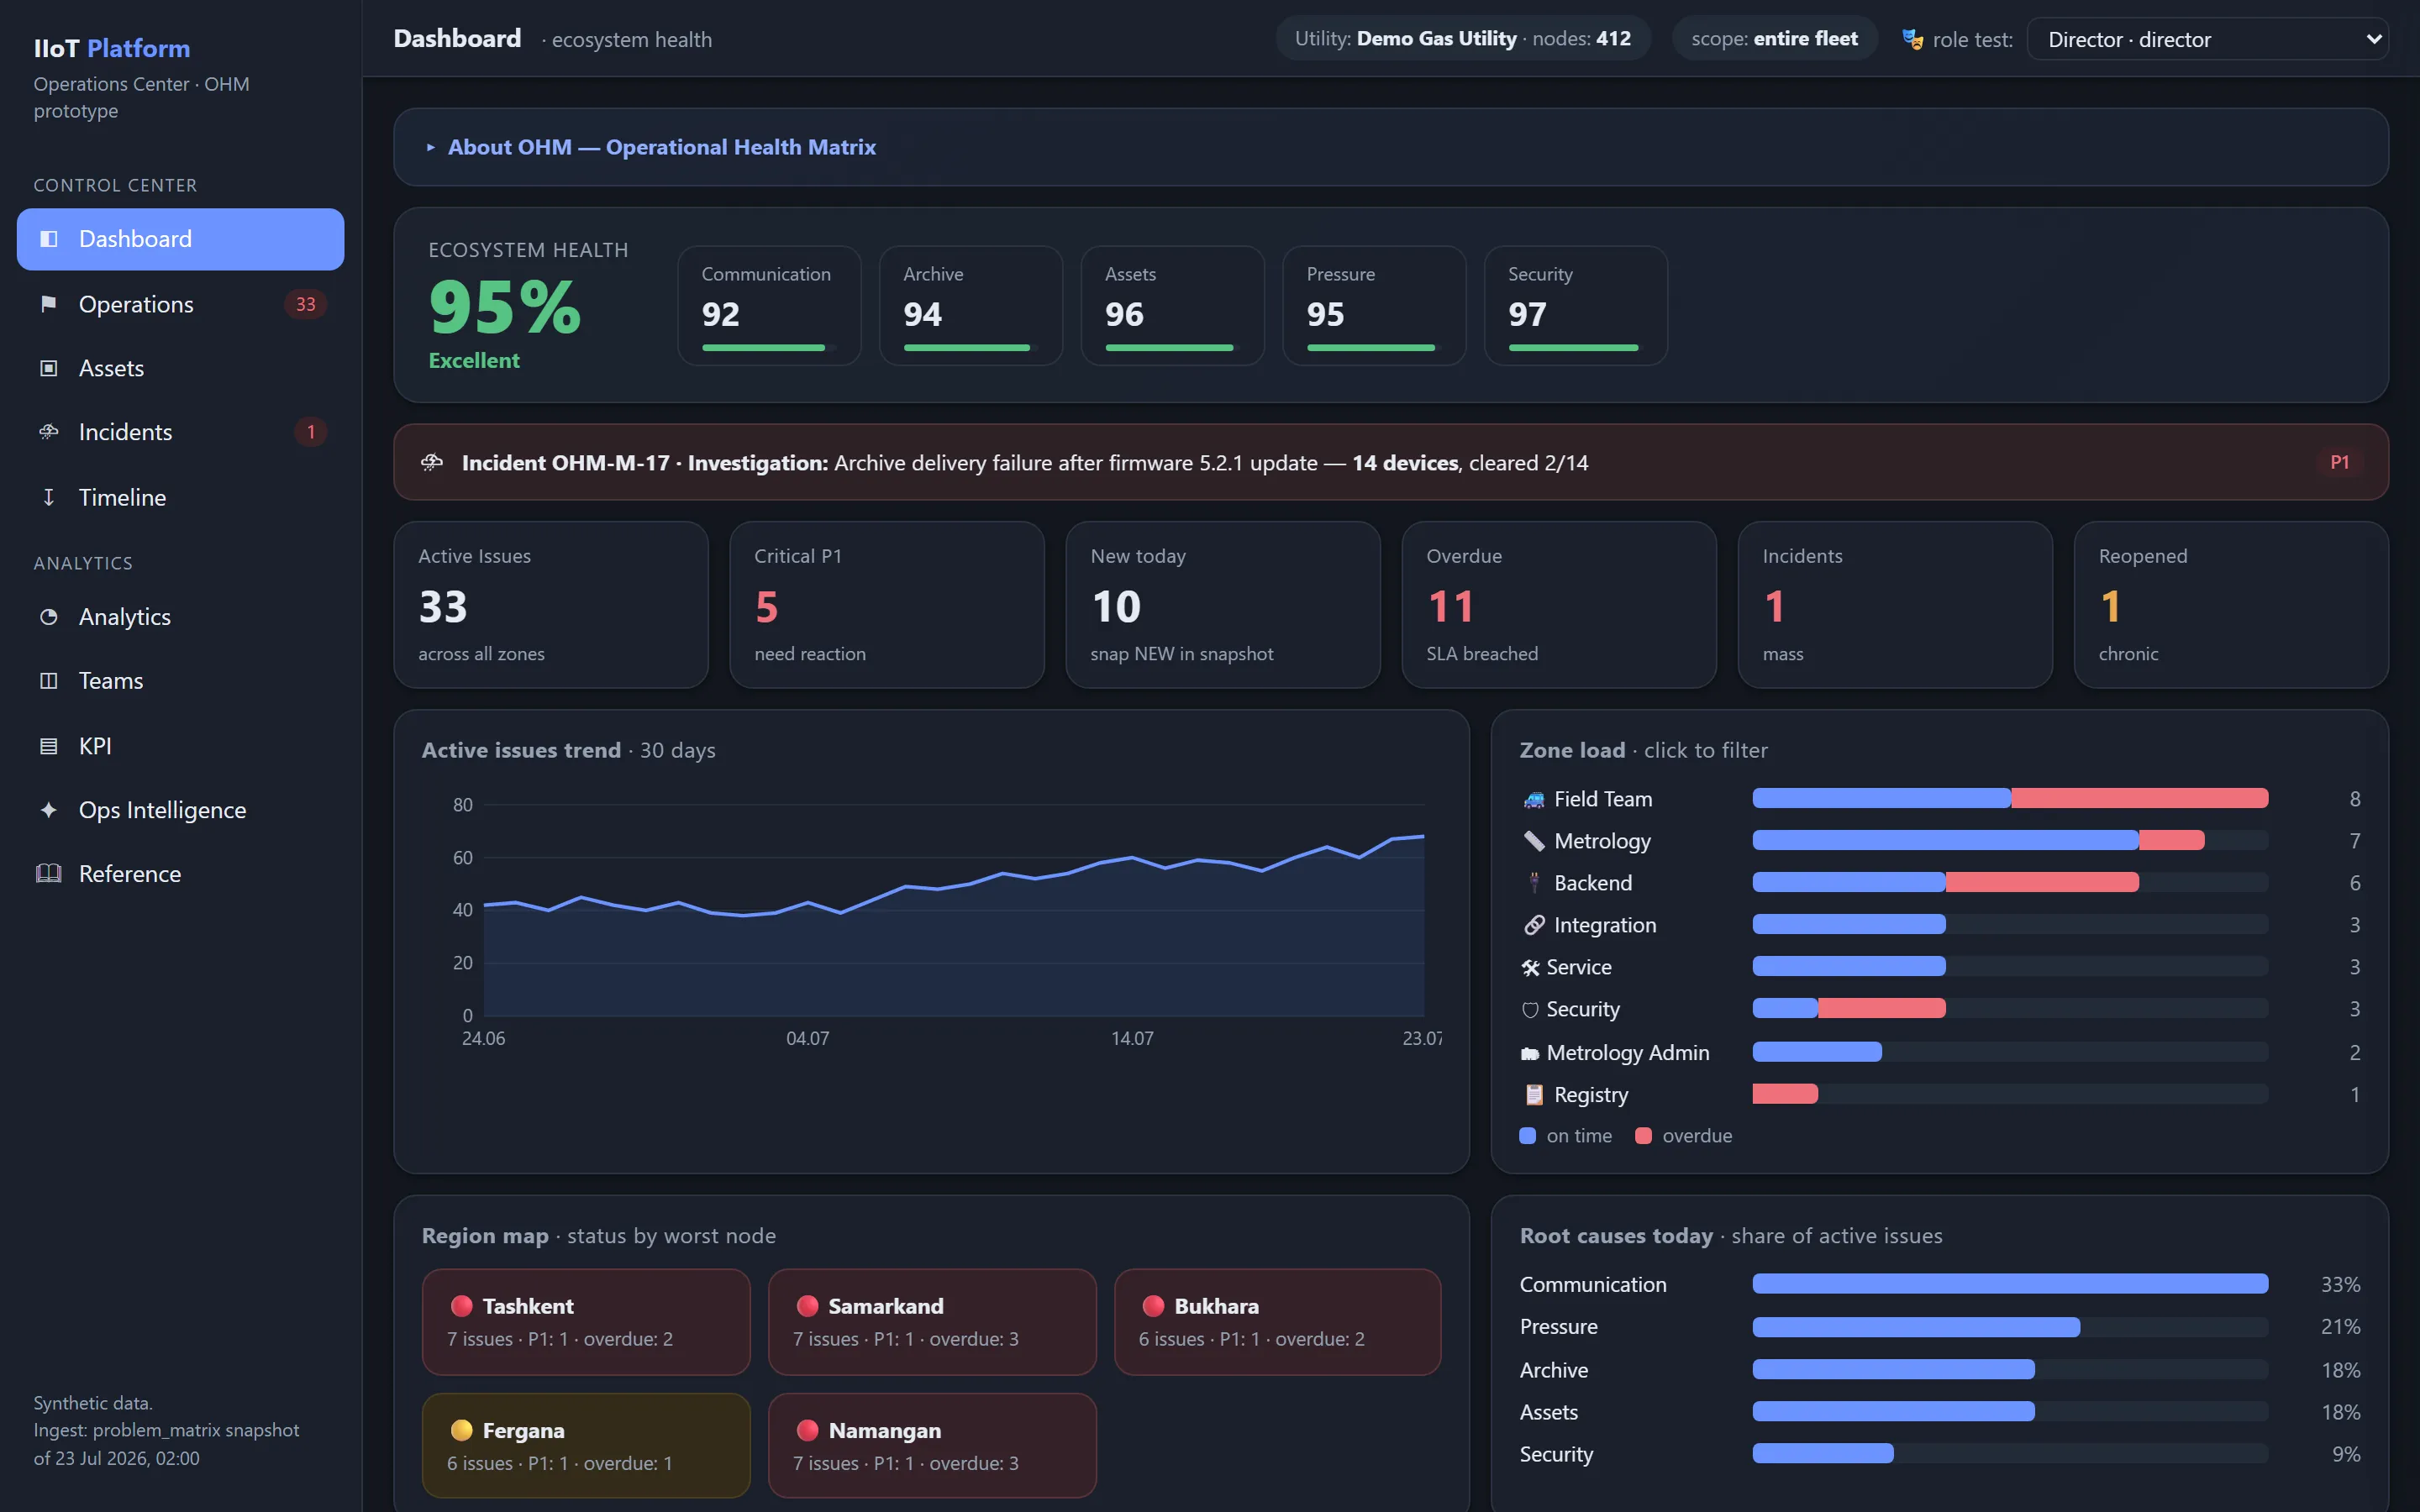
The Operational Health Matrix is the operations command center of the Data Platform — it turns telemetry and analytics findings into a managed work cycle, from automatic problem detection to data-confirmed resolution.
Operational Health Matrix (OHM) is the central operations module of the Data Platform. It transforms the telemetry stream, analytics results, and operational events into a managed work cycle: from automatic problem detection to data-confirmed resolution.
OHM brings together in a single system:
- detection of technical, metrological, and integration problems;
- symptom correlation and identification of the probable root cause;
- creation and management of
Operational Issueobjects; - assignment of responsible teams and assignees;
- management of deadlines, priorities, and SLAs;
- tracking of tasks, comments, evidence, and action history;
- automatic verification of results against new data;
- massive incident management;
- assessment of equipment and fleet condition;
- calculation of operational and team KPIs;
- accumulation of confirmed solutions in the knowledge base;
- AI-assisted analysis without delegating critical decision-making authority to artificial intelligence.
flowchart TD
  A["Telemetry"] --> B["Detectors"]
  B --> C["Evidence"]
  C --> D["Correlation and Root Cause"]
  D --> E["Operational Issue"]
  E --> F["Assignment and execution"]
  F --> G["Data-driven verification"]
  G --> H["Closure and Knowledge Base"]
  H --> I["KPIs and continuous improvement"]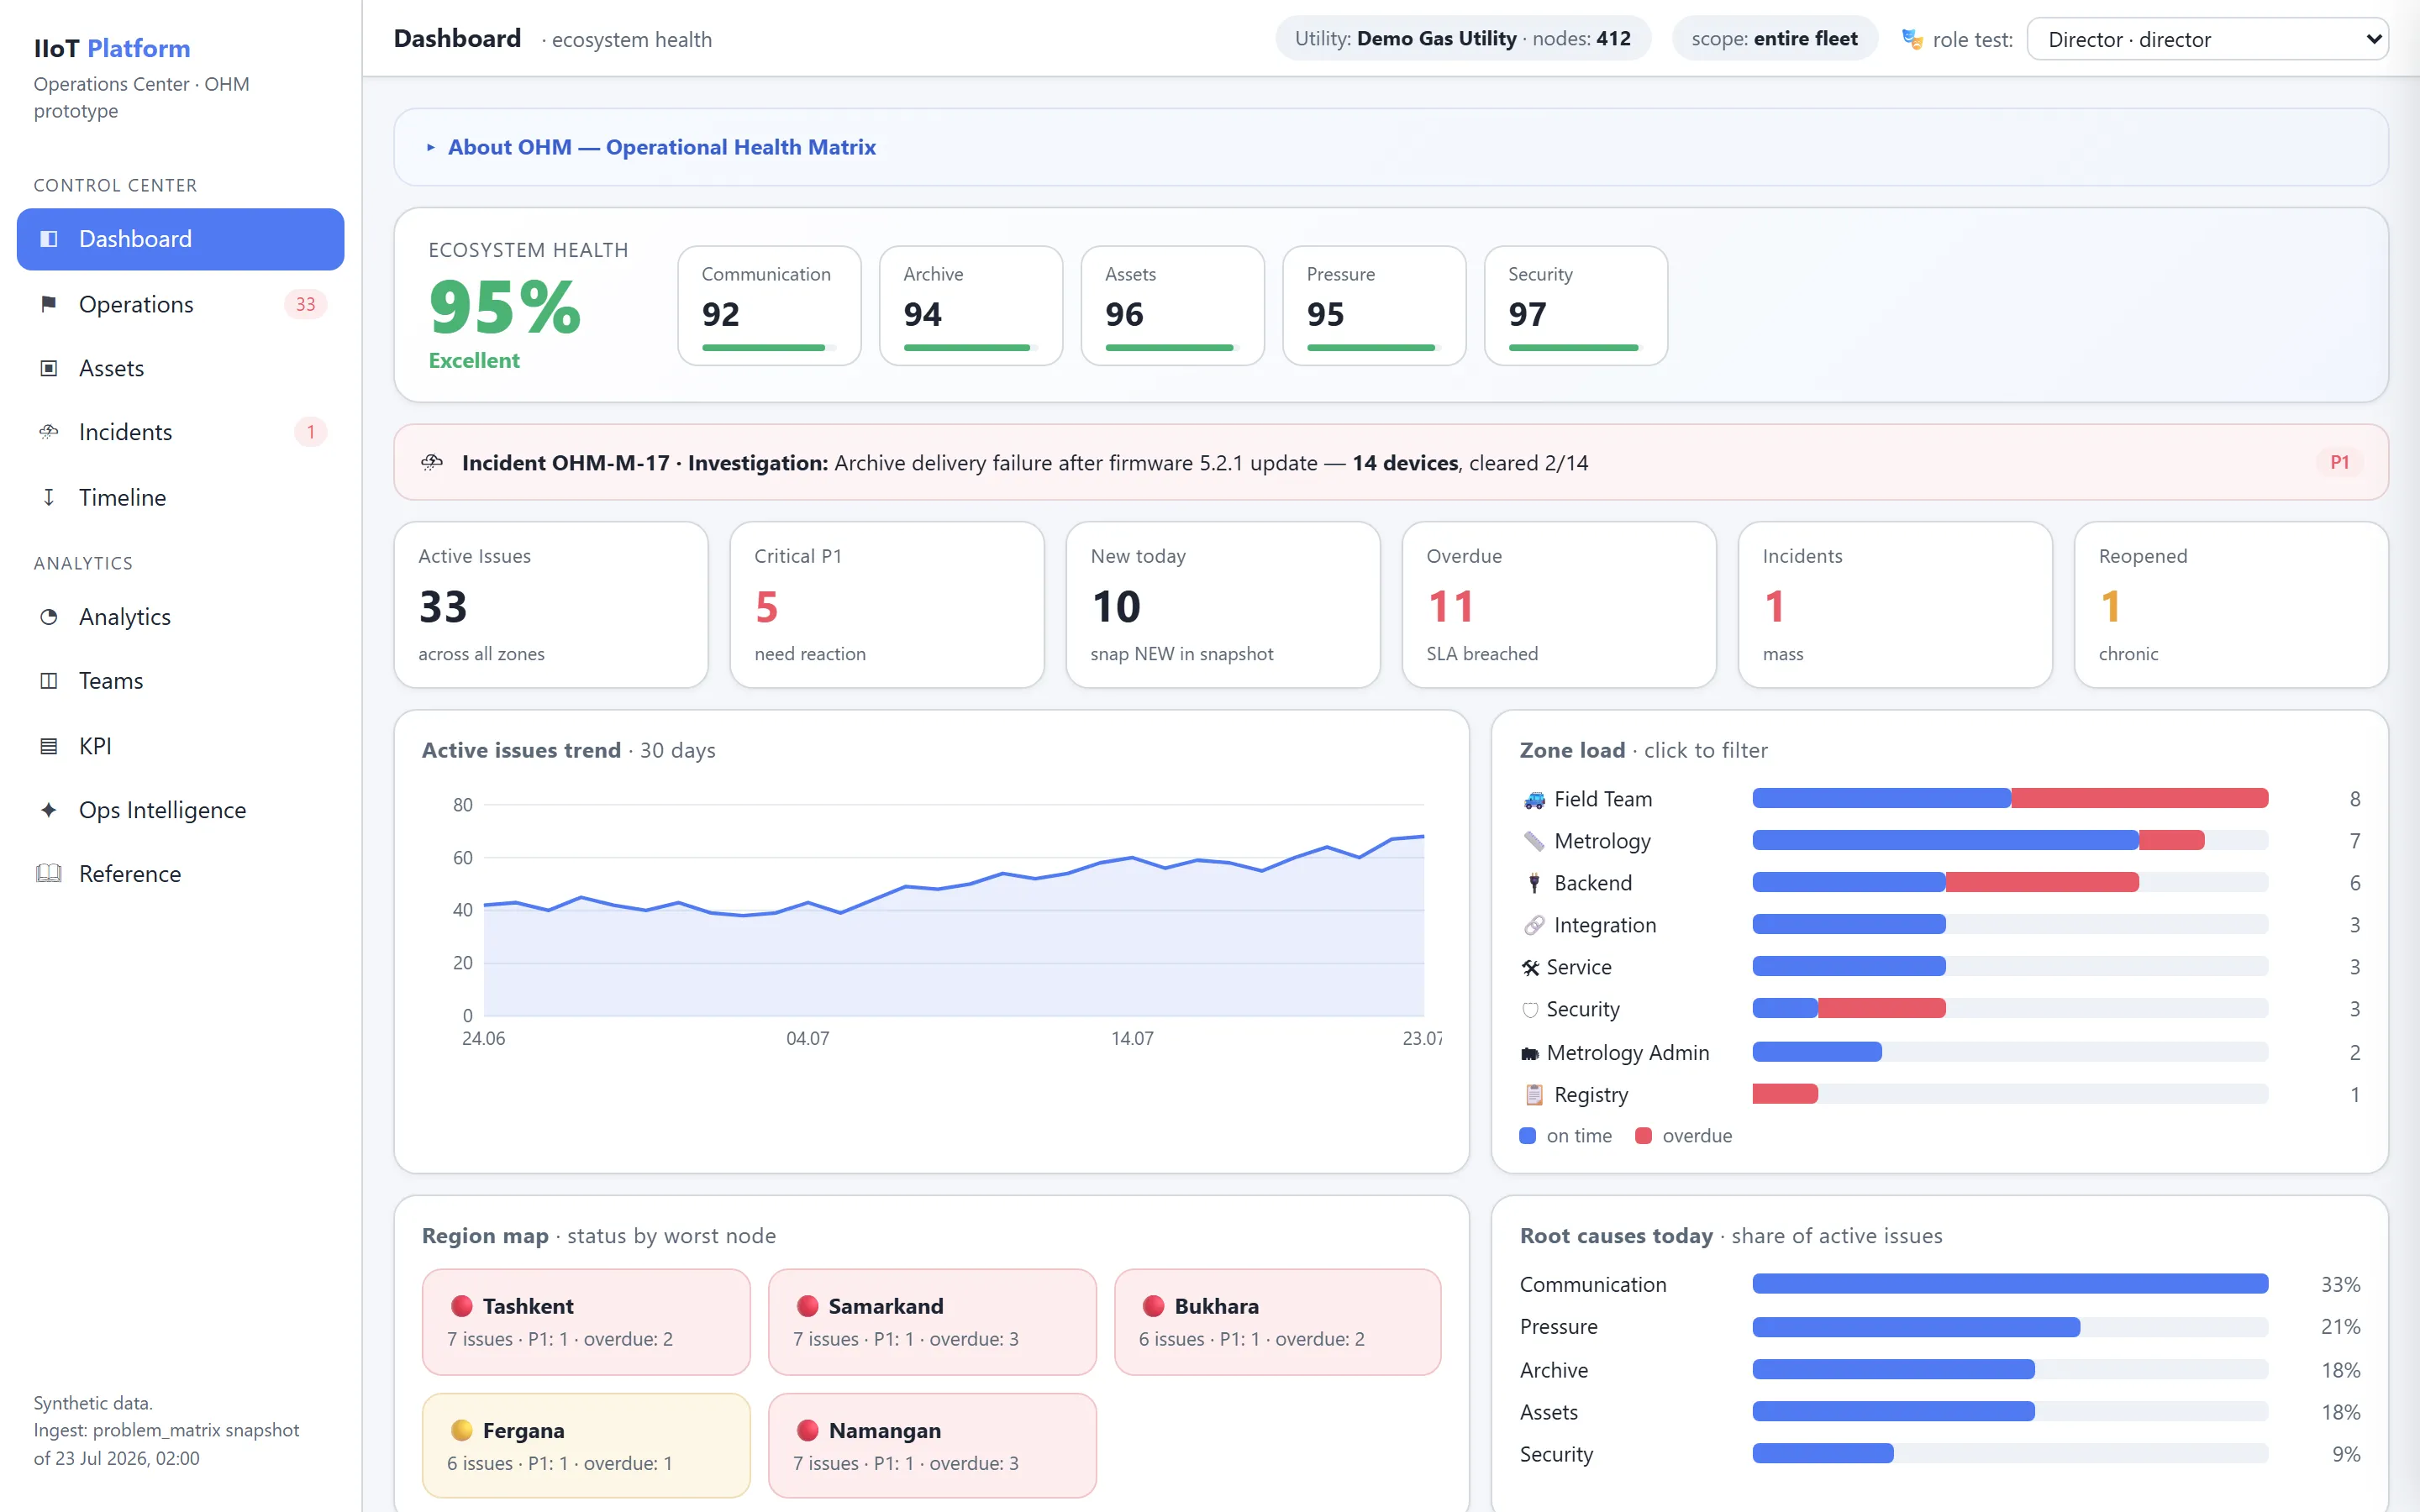
Purpose of the Module
Traditional telemetry systems are good at answering the question:
What happened to the device or the data?
But this is not enough to manage a large fleet. After an event is detected, the organization must determine:
- whether the signal represents a real problem;
- whether it affects a single device or constitutes a system-wide incident;
- which other symptoms are linked to the same root cause;
- who is responsible for resolution;
- by when the work must be completed;
- what actions have already been taken;
- whether the resolution has been confirmed by objective data;
- whether the problem is recurring;
- how effectively the operational process is performing.
OHM closes this entire cycle.
The primary output of the module is not a notification or a report row, but a managed operational object that has:
- an identifier;
- a problem type;
- affected assets;
- evidence;
- severity;
- a confidence level;
- a probable and confirmed root cause;
- an owner;
- an assignee;
- a due date;
- tasks;
- history;
- a verification state;
- a resolution outcome;
- a link to the knowledge base;
- an impact on KPIs.
Key Advantage
The platform does not stop at recording deviations. The platform follows the problem through to a confirmed result.
flowchart TD
  subgraph OPS["Data Platform and OHM"]
    direction TB
    O1["Detected the problem"] --> O2["Verified the evidence"]
    O2 --> O3["Consolidated related signals"]
    O3 --> O4["Determined the priority"]
    O4 --> O5["Assigned the responsibility zone"]
    O5 --> O6["Tracks the deadline"]
    O6 --> O7["Verified the result against data"]
    O7 --> O8["Stored the confirmed solution"]
  end
  subgraph MON["Monitoring System"]
    direction TB
    M1["Detected the problem"] --> M2["System work ends here"]
  end
As a result, OHM shifts operations from a reactive mode to a managed model in which every significant deviation has an owner, a deadline, evidence, and a measurable outcome.
Core Principles
Issues instead of alarms
A single alarm does not always equal an operational problem.
One physical failure can generate dozens or hundreds of events:
- no communication session;
- no archive;
- stale data;
- battery status unknown;
- no current pressure;
- delivery error.
OHM does not create a separate work item for every symptom. The system correlates the signals and creates a single Operational Issue when they share a common cause.
Evidence-driven operations
Every automated conclusion must be explainable.
An Issue contains:
- source values;
- timestamps;
- the detector identifier;
- the algorithm version;
- the applied thresholds;
- a link to the relevant specialized report;
- the recurrence history;
- related signals;
- the correlation result.
Users can always trace the path from the raw telemetry to the created Issue.
Root Cause First
OHM distinguishes between:
- a symptom — an observed deviation;
- a cause — the technical or organizational factor that produced the deviation;
- a root cause — the primary factor whose elimination prevents recurrence of a group of symptoms.
Example:
flowchart LR
  S1["Symptom 1: hourly archive is missing"] --> RC["Probable root cause: power source degradation"]
  S2["Symptom 2: last session was 9 days ago"] --> RC
  S3["Symptom 3: battery voltage was declining"] --> RC
  S4["Symptom 4: session duration was increasing"] --> RC
Data-verified closure
The assignee reports that the work is done, but the final resolved status is set only after the result has been verified.
flowchart TD
  V1["Work completed"] --> V2["awaiting_verification"]
  V2 --> V3["New data confirm normalization"]
  V3 --> V4["resolved"]
For problems that cannot be verified through telemetry, controlled manual verification is applied, with a mandatory comment and supporting evidence.
Asset-centric view
All events, Issues, work items, and metrics are linked to assets:
- metering points;
- correctors;
- meters;
- sensors;
- modems;
- gateways;
- SIM cards;
- server components;
- integration channels;
- software versions.
The asset card shows the current health, degradation history, active Issues, completed work, and problem recurrence.
Human accountable, AI assisted
AI helps to:
- summarize Evidence;
- rank hypotheses;
- find similar cases;
- suggest known solutions;
- identify new clusters;
- predict failure risk.
AI cannot, on its own:
- change priority;
- assign accountability;
- close an Issue;
- confirm a root cause as an established fact;
- modify SLAs;
- perform critical actions on equipment.
Reproducibility by design
All significant calculations are reproducible. For every result, the platform stores:
- the detector version;
- the canon version;
- the correlation model version;
- the dataset used;
- the calculation time;
- the thresholds;
- the configuration;
- the source of the change.
OHM in the Data Platform architecture
OHM sits between the analytics layer and operations management.
flowchart TD
  PHY["Physical Assets"] --> DATA["IIoT Data and Integration Layer"]
  DATA -->|"Normalized data"| ANL["Analytics and Detection"]
  ANL -->|"Evidence and findings"| OHM["Operational Health Matrix"]
  OHM -->|"API, events, integration"| ENT["Enterprise Systems"]
Layer contents:
| Layer | Components |
|---|---|
| Physical Assets | meters, correctors, sensors, gateways, valves |
| IIoT Data and Integration Layer | telemetry, archives, registry, passports, events |
| Analytics and Detection | canon detectors, deep reports, AI, correlation |
| Operational Health Matrix | Issues, Tasks, SLA, verification, KPI, knowledge base |
| Enterprise Systems | ERP, EAM, CMMS, Service Desk, BI, notifications |
Data Sources
OHM uses:
- current telemetry;
- hourly, daily, and event archives;
- communication session logs;
- passport and registry data;
- device statuses;
- battery data;
- pressure, temperature, flow rate, and volume;
- tampering events;
- firmware versions;
- communication parameters;
- results of specialized reports;
- manual user observations;
- events from external systems.
Evidence Providers
Any analytical module of the platform can act as an evidence source.
Examples:
| Evidence Provider | What it delivers to OHM |
|---|---|
| Fleet Problem Matrix | canonical problems and daily statuses |
| Hourly Archive Analytics | completeness, gaps, tail, data reliability |
| Session Analysis | duration, frequency, communication anomalies |
| Pressure Analysis | out-of-range values, spikes, stuck readings |
| Temperature Analysis | anomalies, discrepancies, physical plausibility |
| Tampering Suspicion | forensic signals and confidence |
| Battery Analysis | trend, thresholds, remaining-life forecast |
| Passport Control | missing and contradictory parameters |
| Registry Control | duplicates, ghost objects, identifier inconsistencies |
| Firmware Analytics | problem clusters by software version |
Explore the module
Role-based dashboards, queues and screens the teams work in every day.
The core entities — Asset, Detector, Evidence, Issue, Task — and how they relate.
The Operational Issue object and its statuses from detection to data-verified closure.
How detectors turn telemetry into versioned canonical problem definitions.
Immutable evidence, symptom correlation and probable root-cause identification.
How severity and impact drive priority, SLA timers and escalation paths.
Tasks, assignments, comments and the work queue that drives resolution.
Calculated health scores for assets, sites, regions and the whole ecosystem.
Metrics that measure the operational process and the teams running it.
Confirmed solutions accumulated and reused for recurring problems.
AI-assisted summarization, ranking and prediction without decision authority.
Grouping related Issues into a single large-scale incident object.
APIs, external systems, access control and audit requirements.
Related topics
Was this page helpful?
Thanks for your feedback!