Getting started
An end-user introduction to the Data Platform web interface — signing in, the dashboard, and how the workspace is organized.
The Data Platform is operated through a web interface that runs in any modern browser. This guide walks you through the everyday tasks an operator or administrator performs: signing in, reading the dashboard, working with metering objects, reviewing telemetry, and generating reports.
The interface at a glance
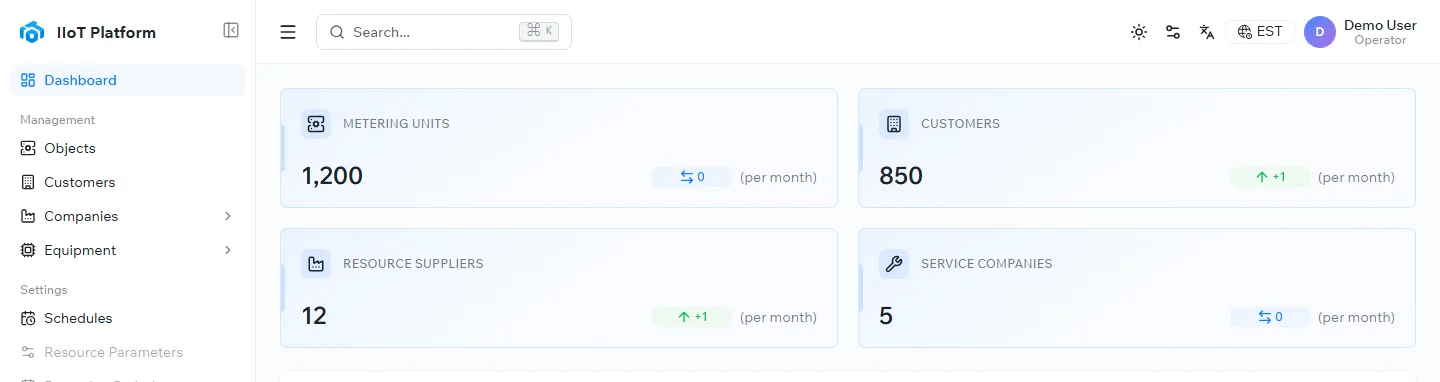
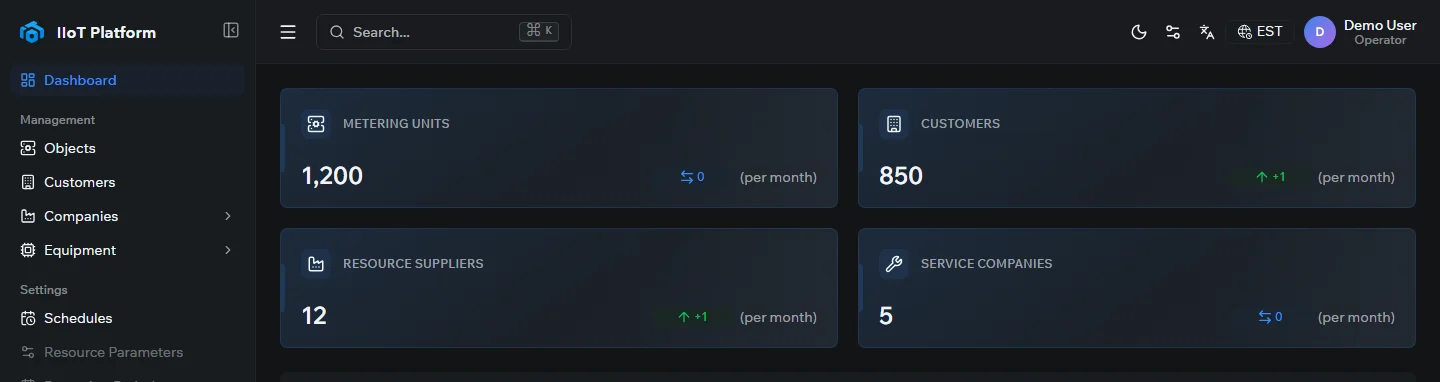
After you sign in, the workspace is divided into three areas:
- Top bar — global search, the light/dark theme switch, the active time zone, and your profile menu (account settings, language, and sign-out).
- Left navigation — the main menu, grouped into Management (objects, customers, companies, equipment), Settings (schedules, resource parameters, reporting periods), Other (monitoring, reports, references), and Administration (users, event log).
- Content area — the page you are working on, such as the dashboard or a list of metering objects.
Start here
Open the platform, sign in, and set your password, language, and time zone.
Read the dashboard summary and find your way around the main menu.
Once you’re oriented, Working with the platform covers the everyday tasks: objects and their cards, customers and companies, schedules, and equipment.
Related topics
Was this page helpful?
Thanks for your feedback!