The object card
The object card in the Data Platform — the unit summary dashboard, connected devices, adding equipment, and the device data and configuration tabs.
Selecting an object from the Objects list opens its card — a single screen that brings together everything about that site: its summary, the equipment installed on it, and its data.
The unit summary dashboard
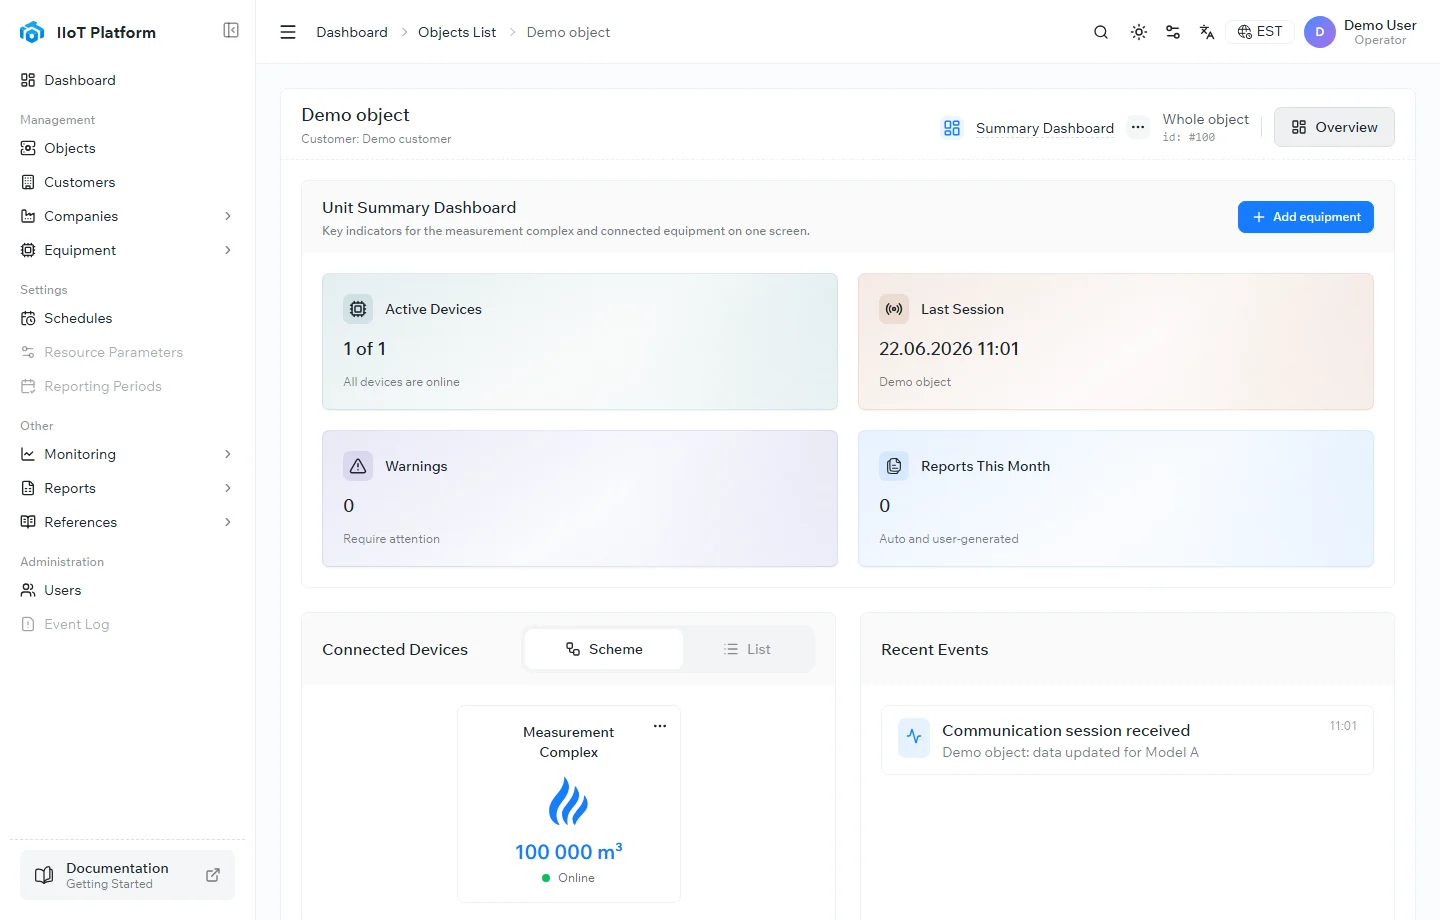
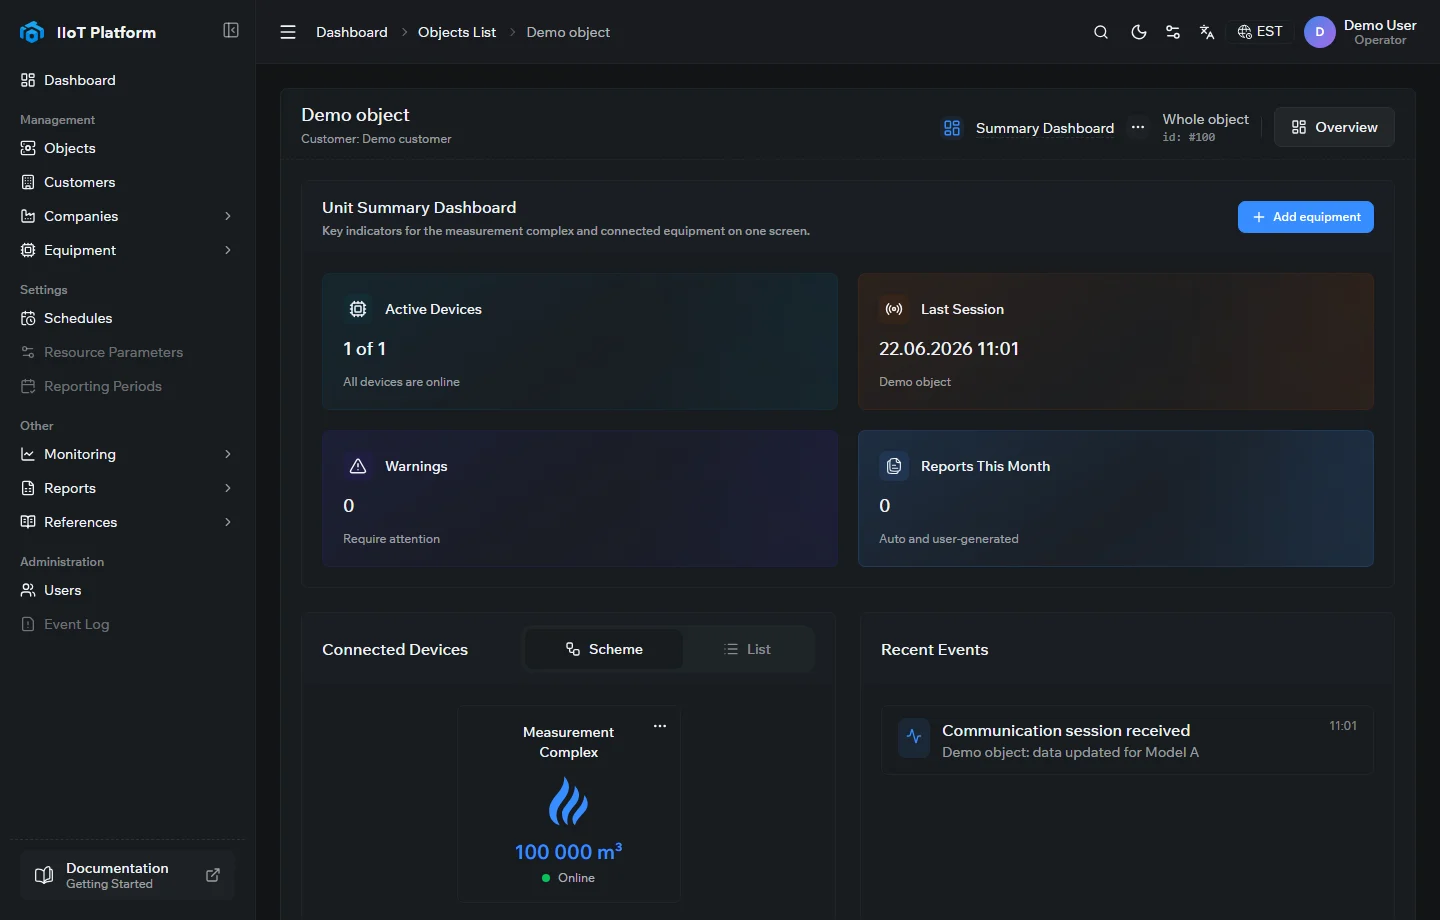
The top of the card shows the object’s name and customer. The Unit Summary Dashboard below gives the key indicators at a glance:
- Active Devices — how many of the object’s devices are online.
- Last Session — when the object last communicated with the server.
- Warnings — items that require attention.
- Reports This Month — reports generated for the object.
Further down, Connected Devices lists the equipment installed on the object — as a Scheme or a List — each with its latest reading and online status, and Recent Events shows the latest activity, such as communication sessions.
Adding equipment
An object can carry a full measurement complex plus auxiliary equipment — pressure and temperature sensors, remotely controllable shut-off valves, and security sensors (door-open, gas-presence, and the like). Select + Add equipment to open a step-by-step wizard.
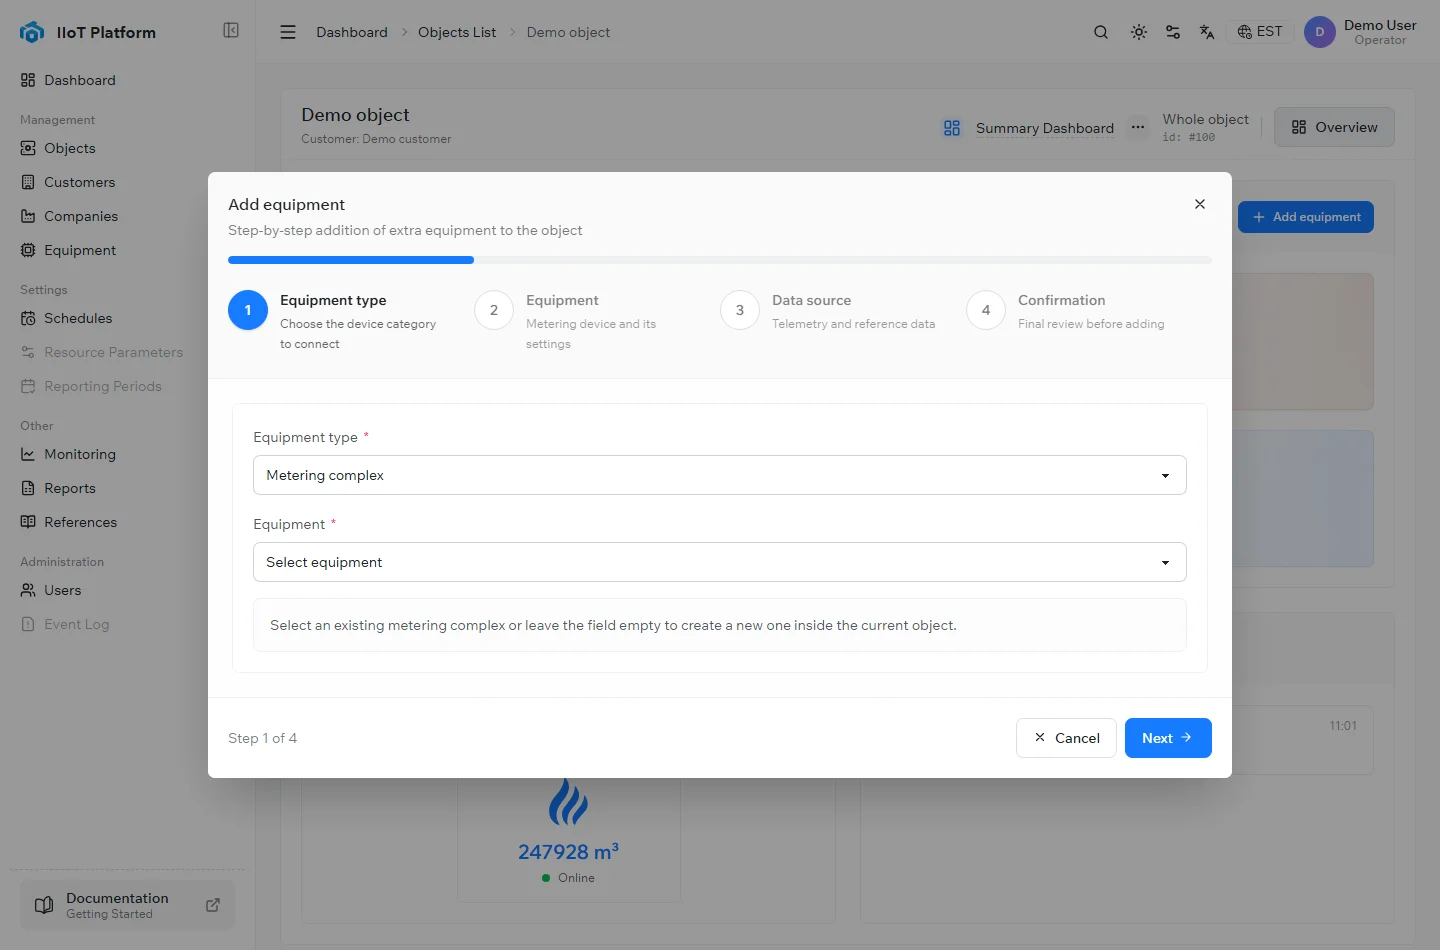
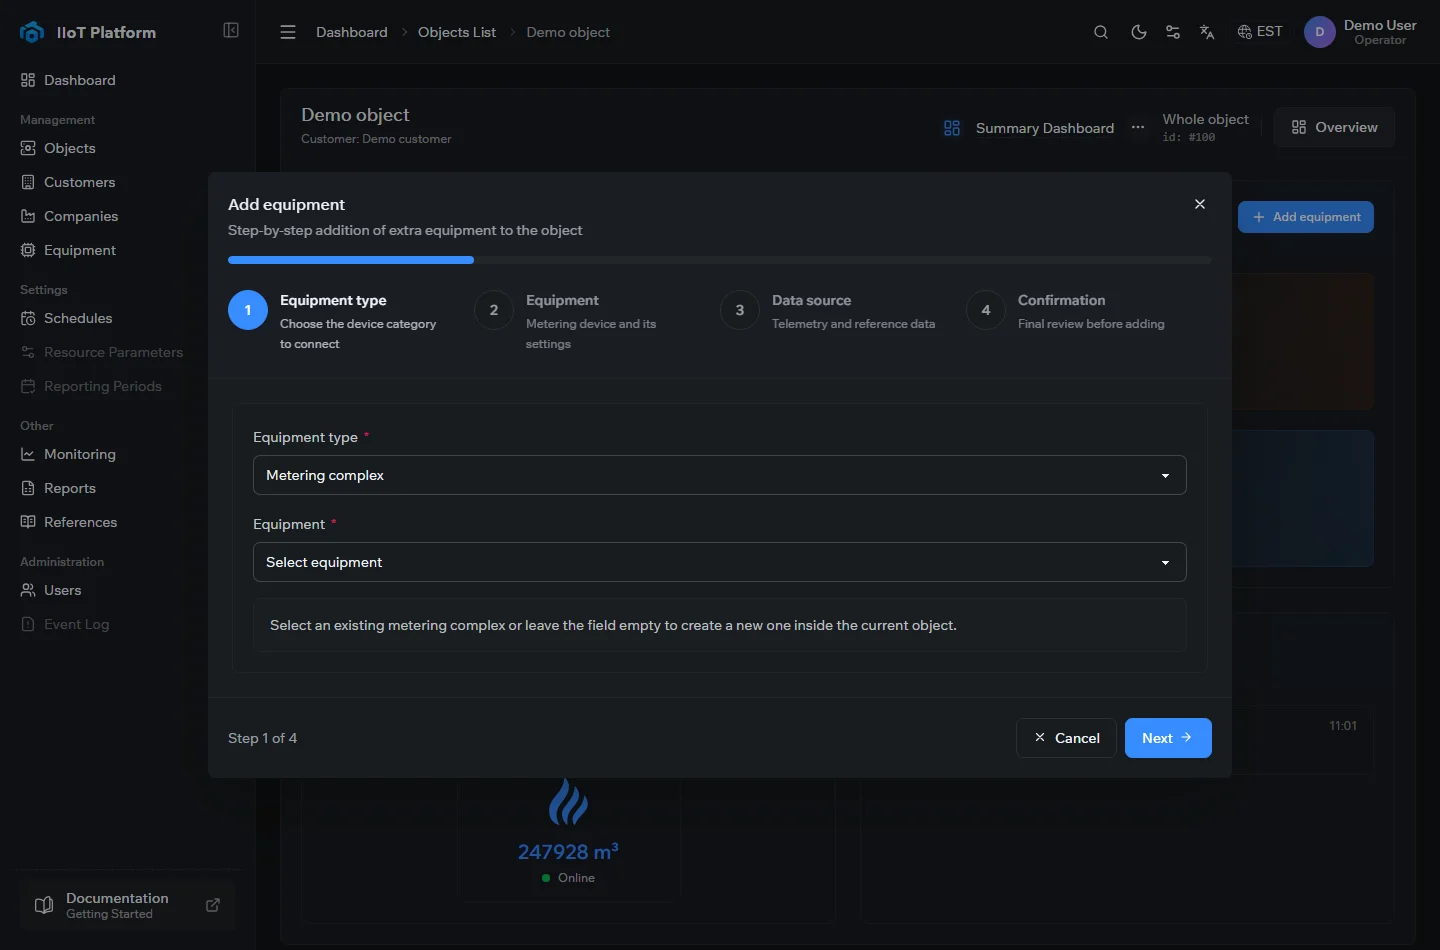
1. Equipment type. Choose the device category to connect — for example a Metering complex. Attach an existing complex, or leave the Equipment field empty to create a new one inside the object. The later steps adapt to the type you pick.
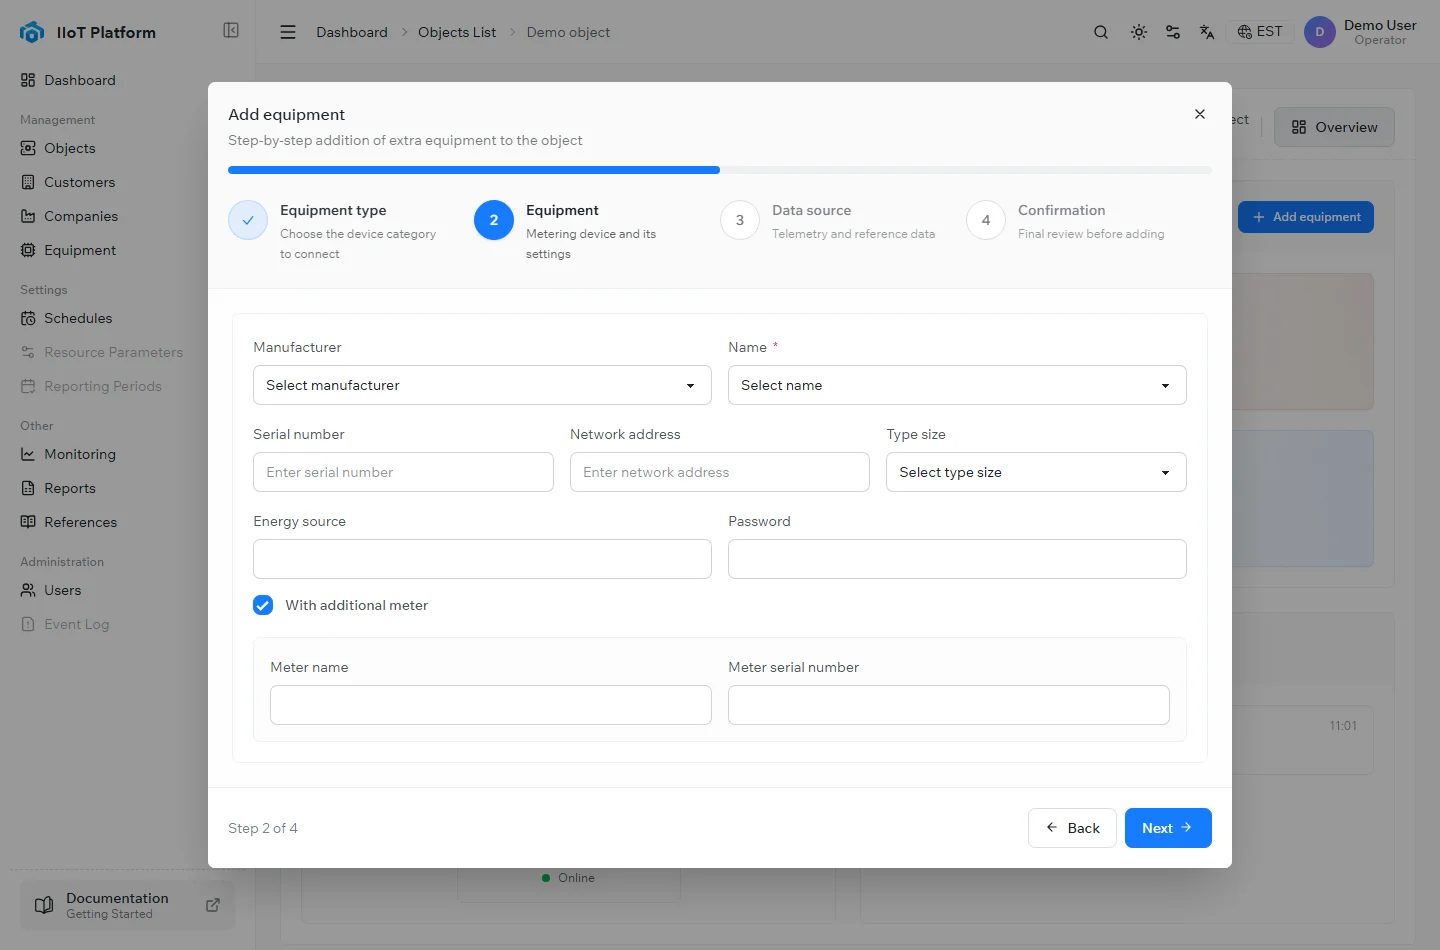
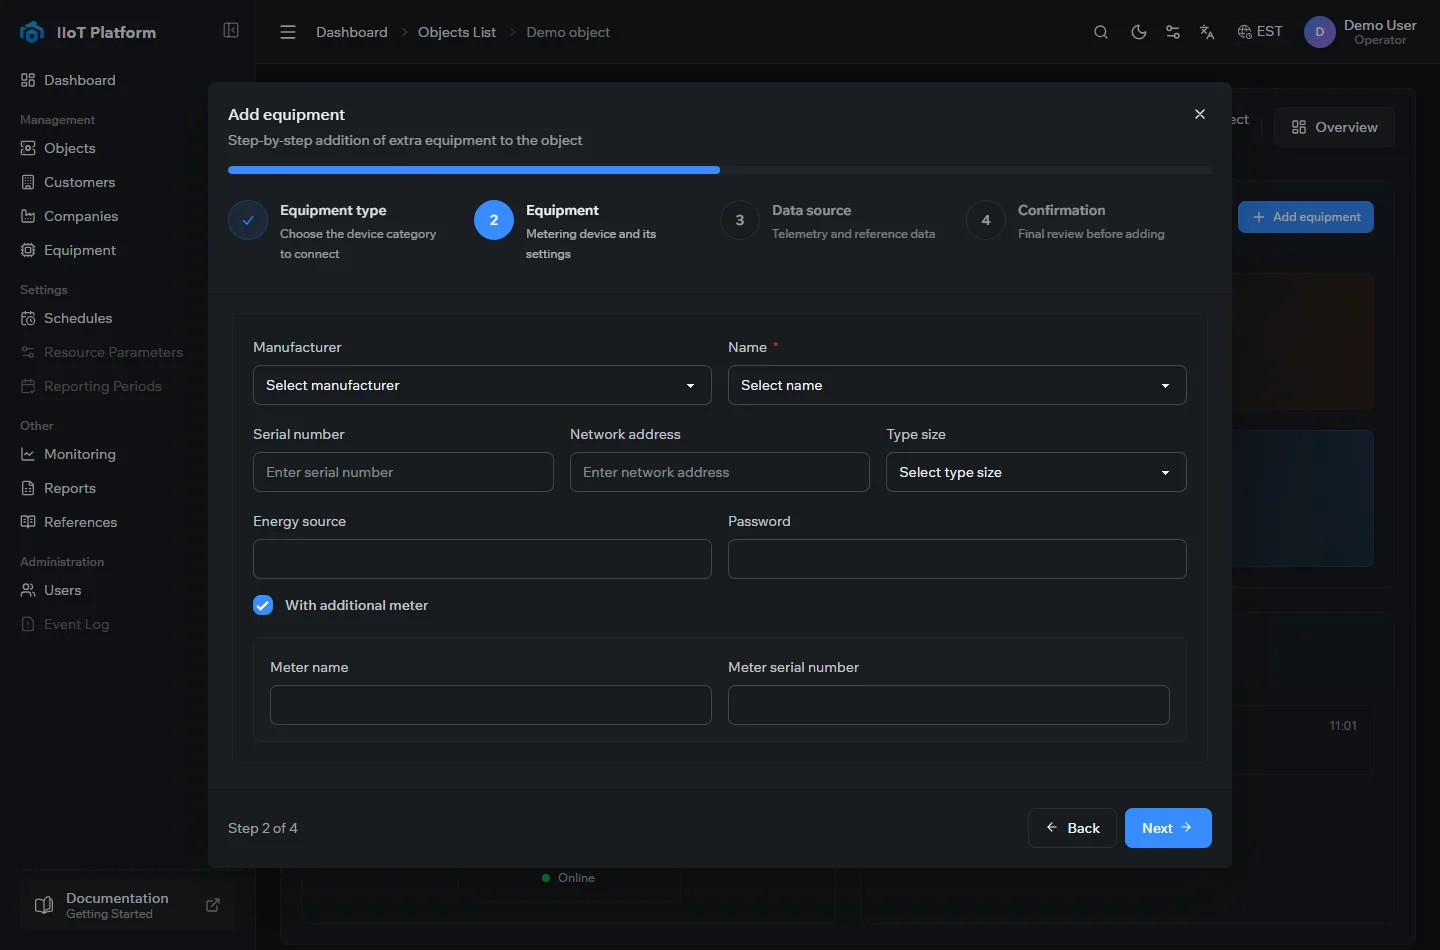
2. Equipment. Enter the device details — manufacturer and model, serial number, network address, type size, and energy source. Enable With additional meter to register an auxiliary meter alongside the main one.
3. Data source. Set up the telemetry channel and reference data the device reports through.
4. Confirmation. Review everything and confirm to add the equipment.
Once added, the device appears under Connected Devices.
Device data and configuration
Open a connected device — for example the Measurement Complex — to work with it in detail. A switch in the header toggles the device between two groups of tabs: Data (what the device reports) and Configuration (how the device is set up).
Data
The Data view is where you read what the device has sent.
Analytics
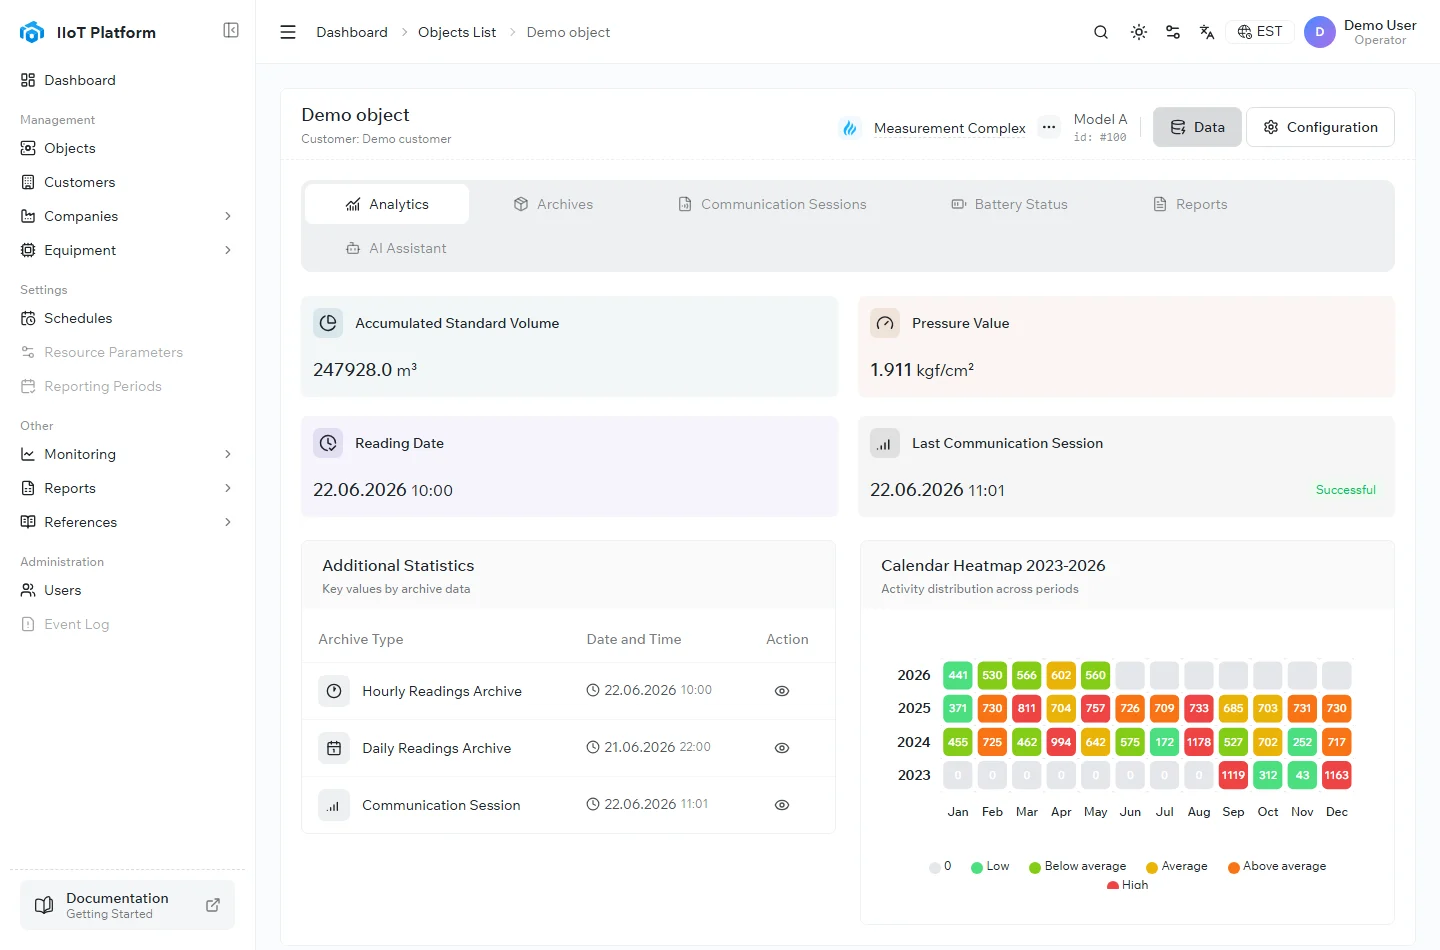
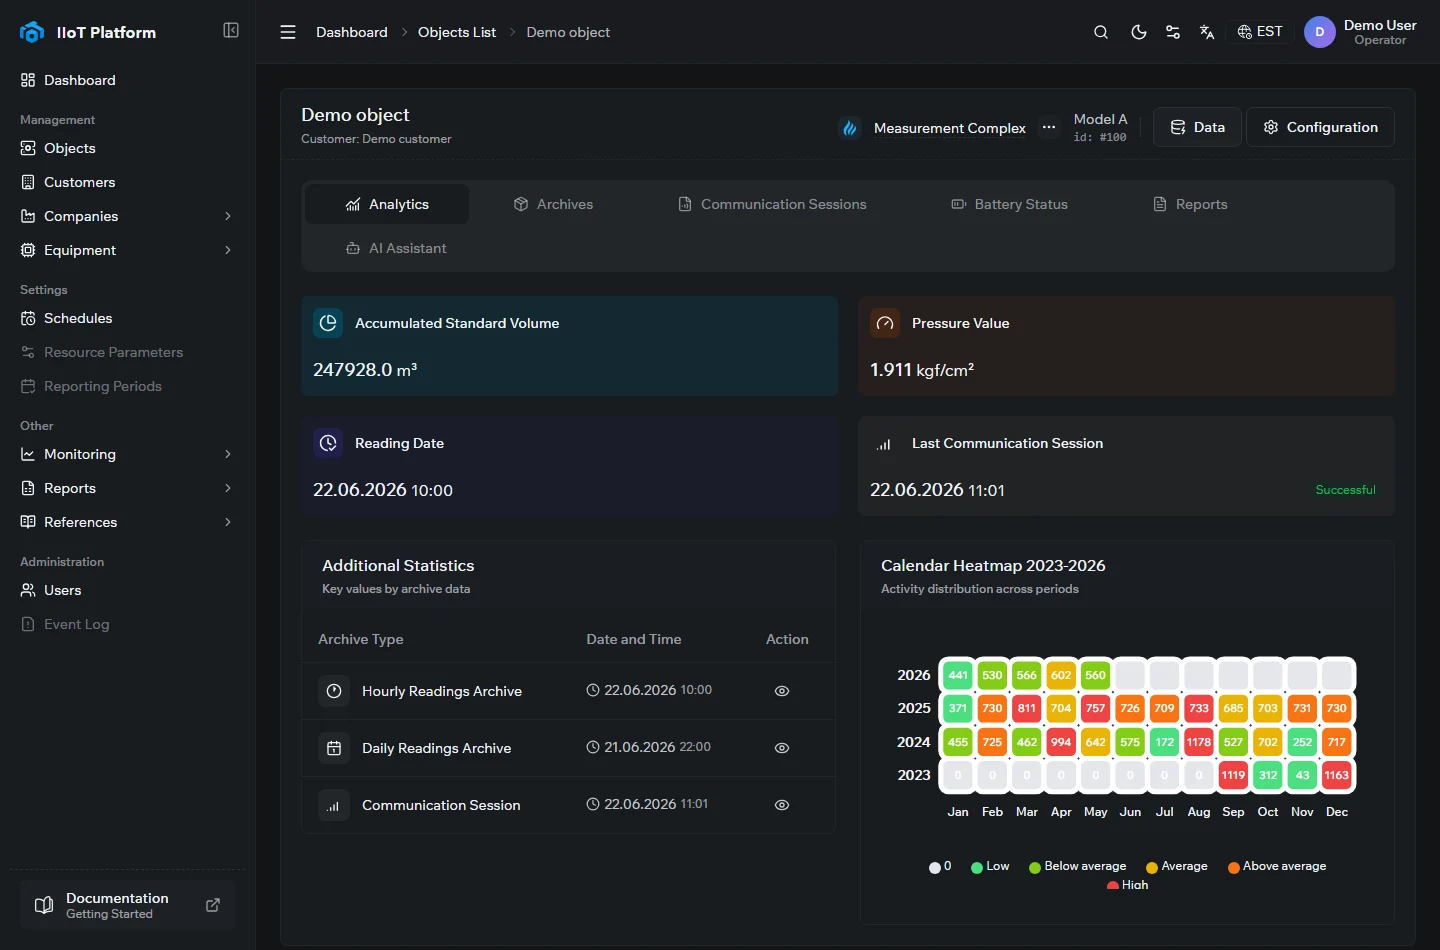
Analytics is the device’s summary: the accumulated standard volume, pressure value, last reading date, and the most recent communication session, with an archive summary and an activity heatmap below.
Archives
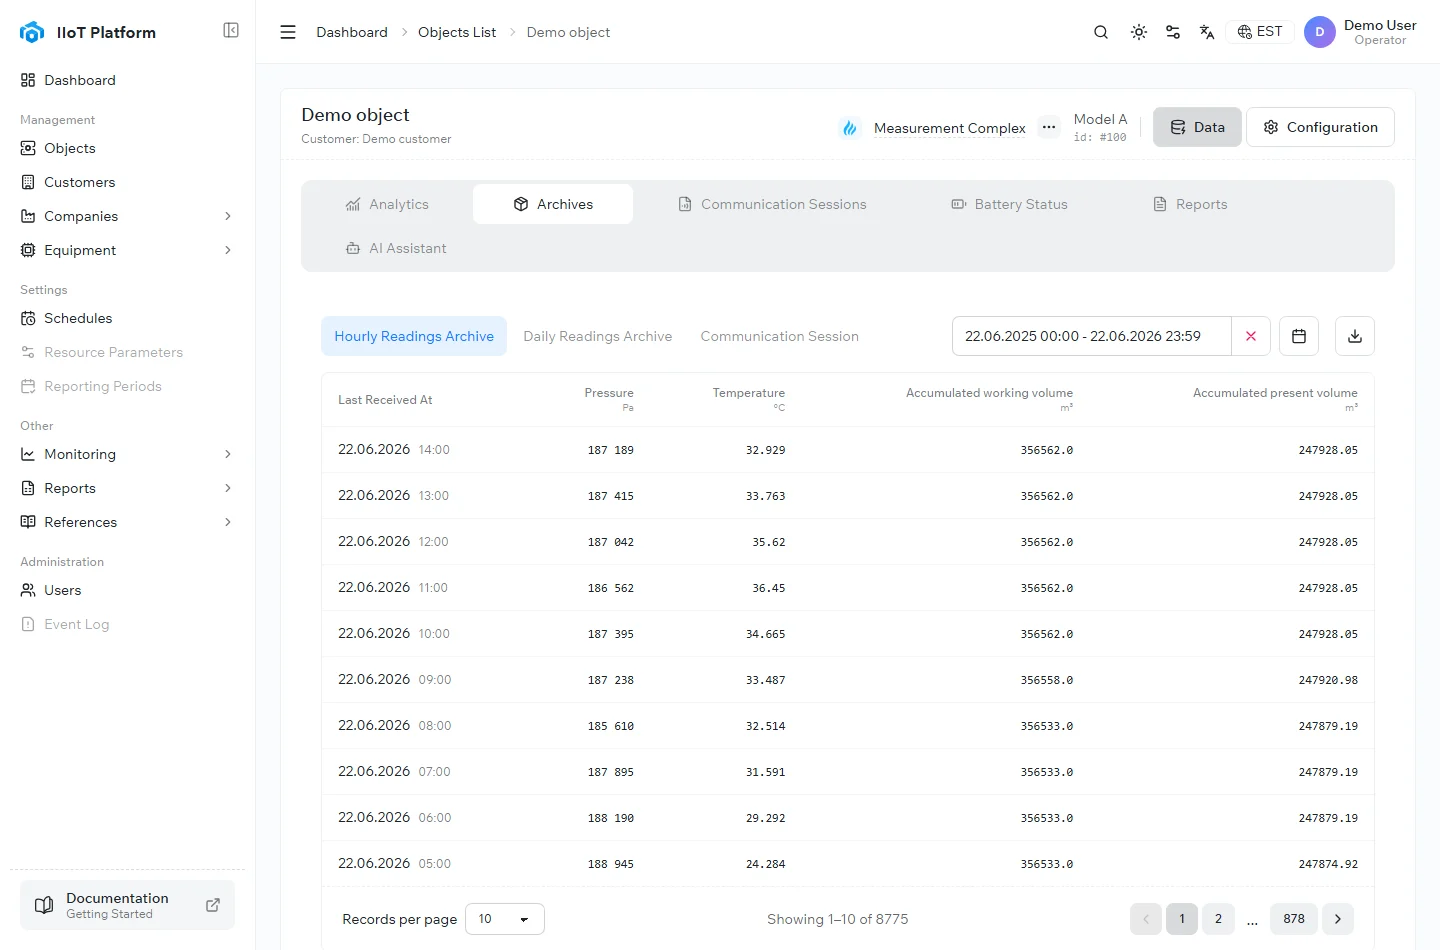
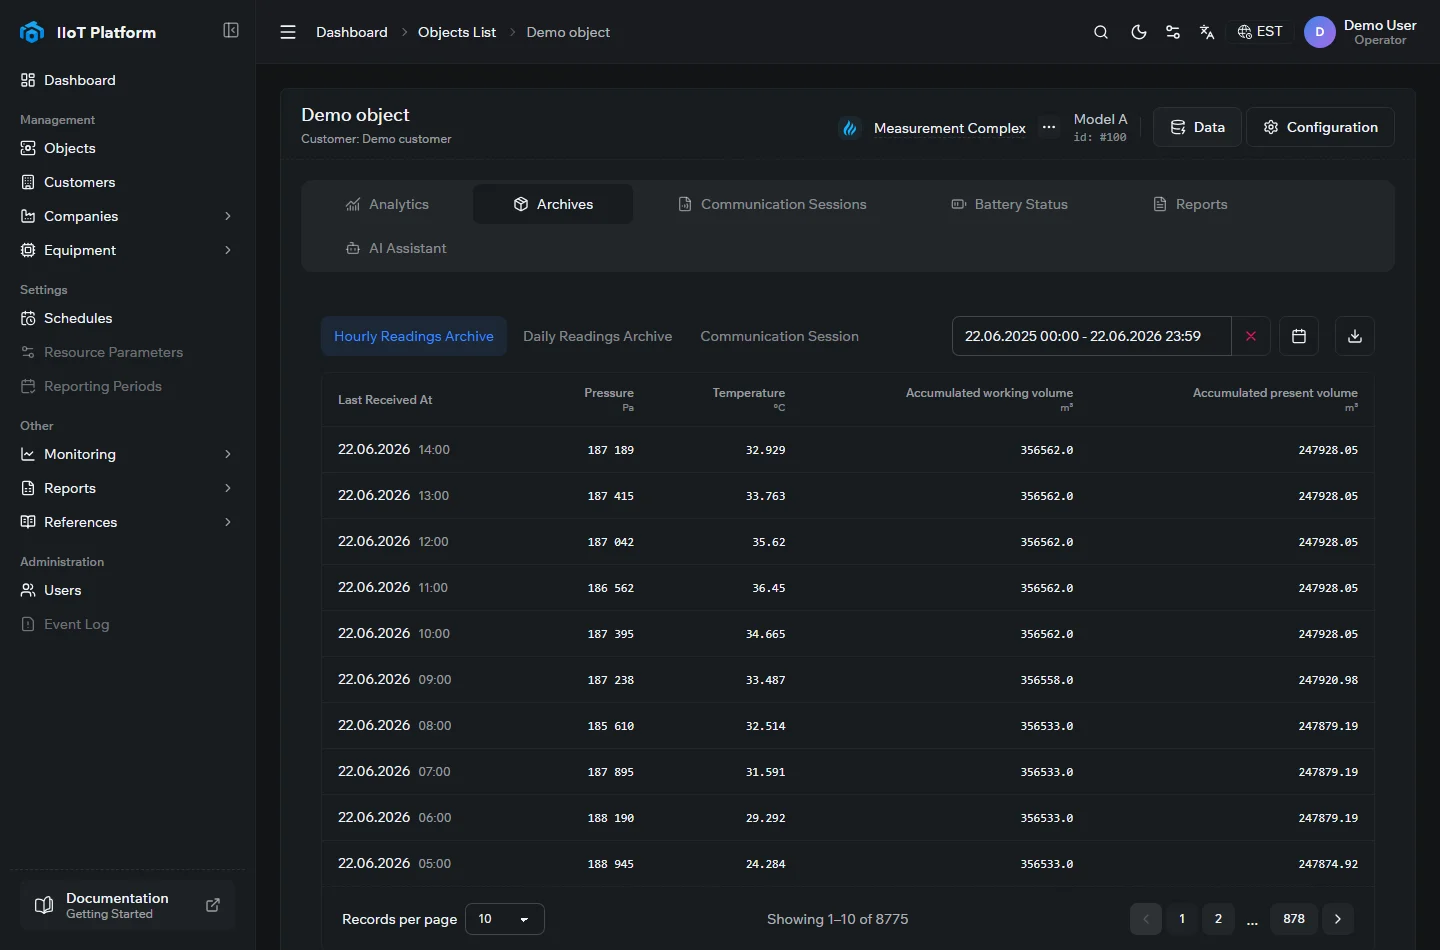
Archives holds the device’s stored readings. Switch between the Hourly, Daily, and Monthly readings archives — and the Abnormal Situations, Changes, Generalized Emergency Situations, and Communication Session logs — choose a date range, and export. Each row carries the readings for its period: pressure, temperature, accumulated working and standard volumes, the volume per period, and the change and situation counters.
Communication Sessions
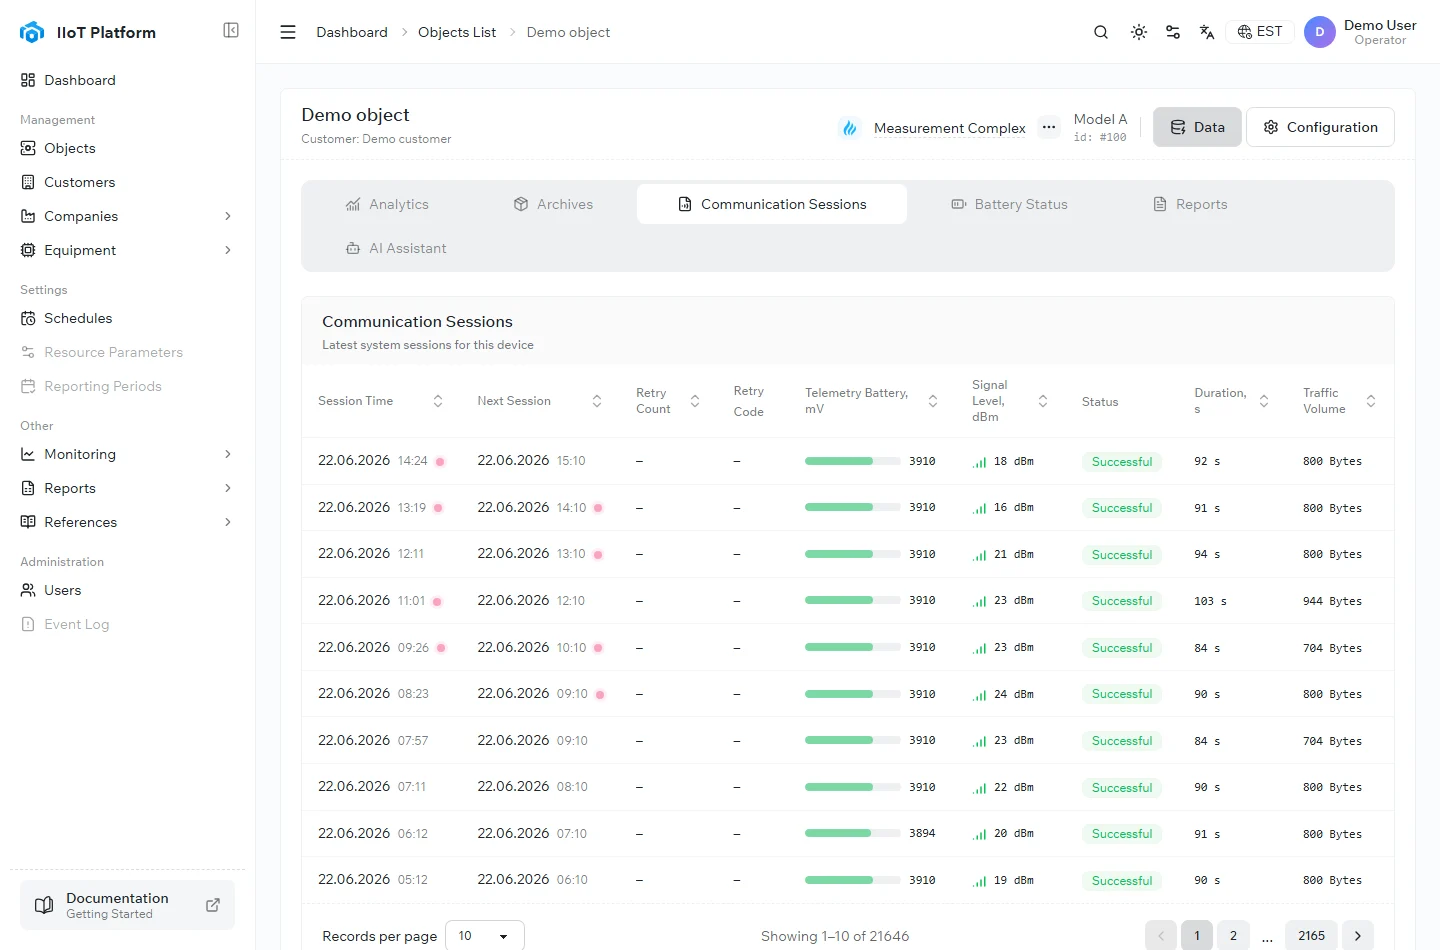
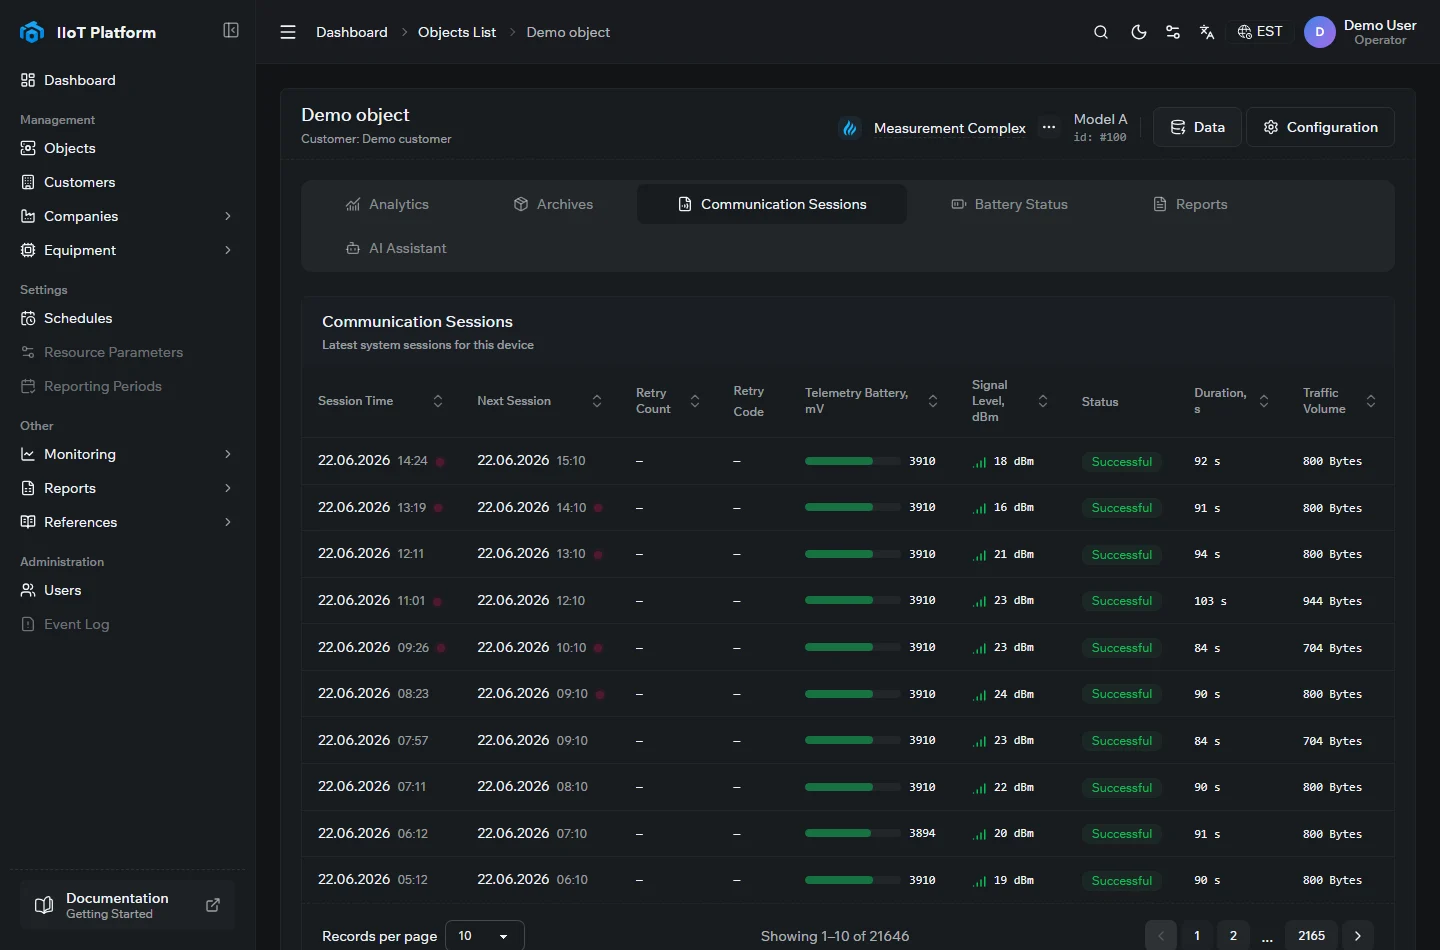
Communication Sessions is the log of every connection between the device and the server: when each session ran and when the next is due, the telemetry battery voltage and signal level at the time, the result (such as Successful or Data Transmission Interruption), and the duration and traffic of each session.
Battery Status
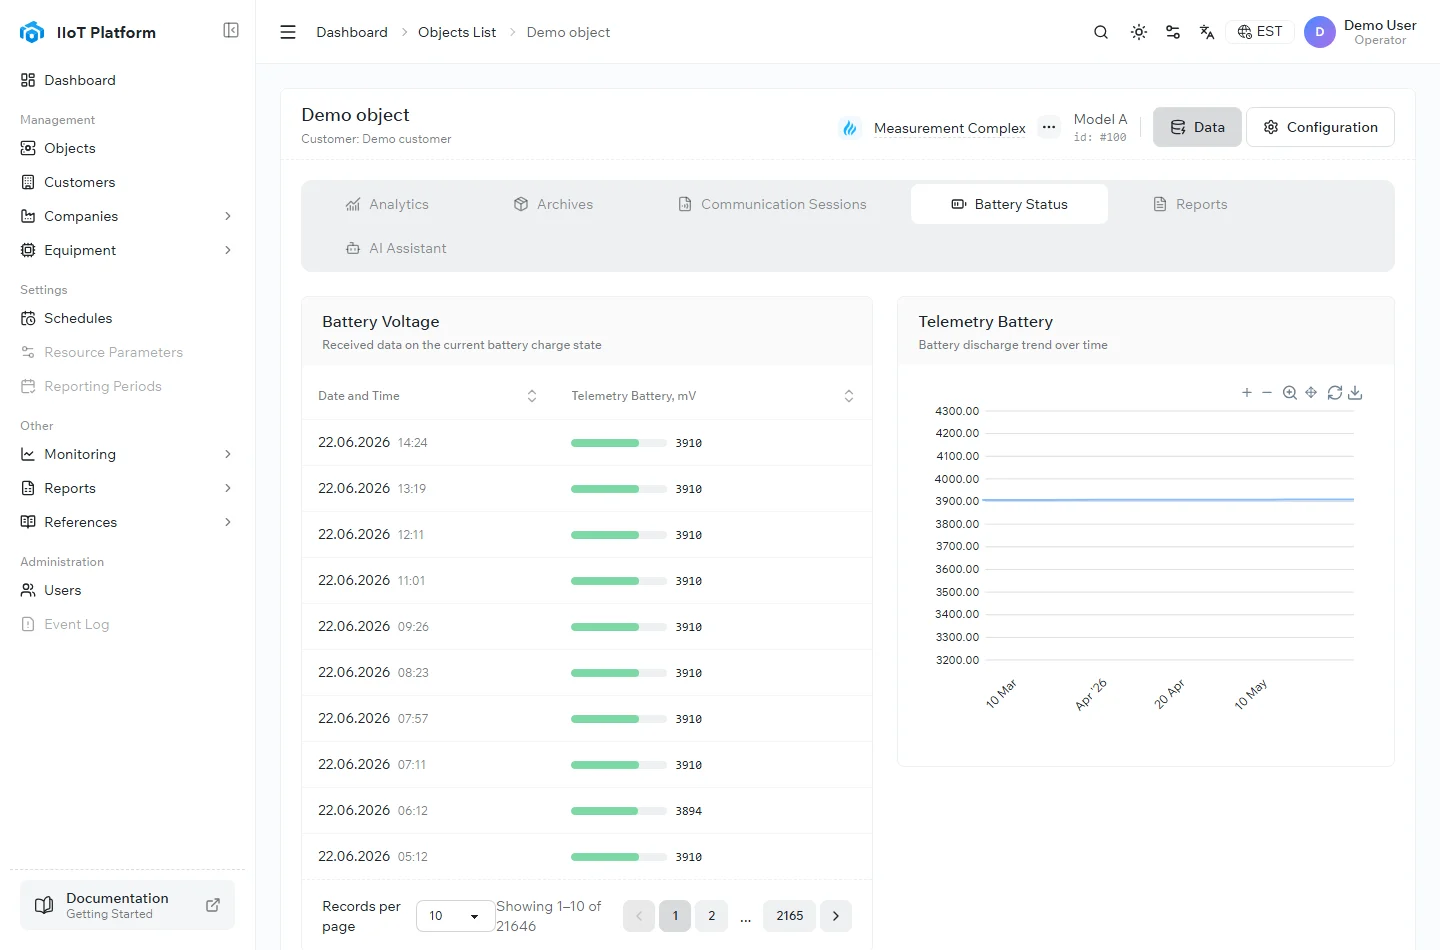
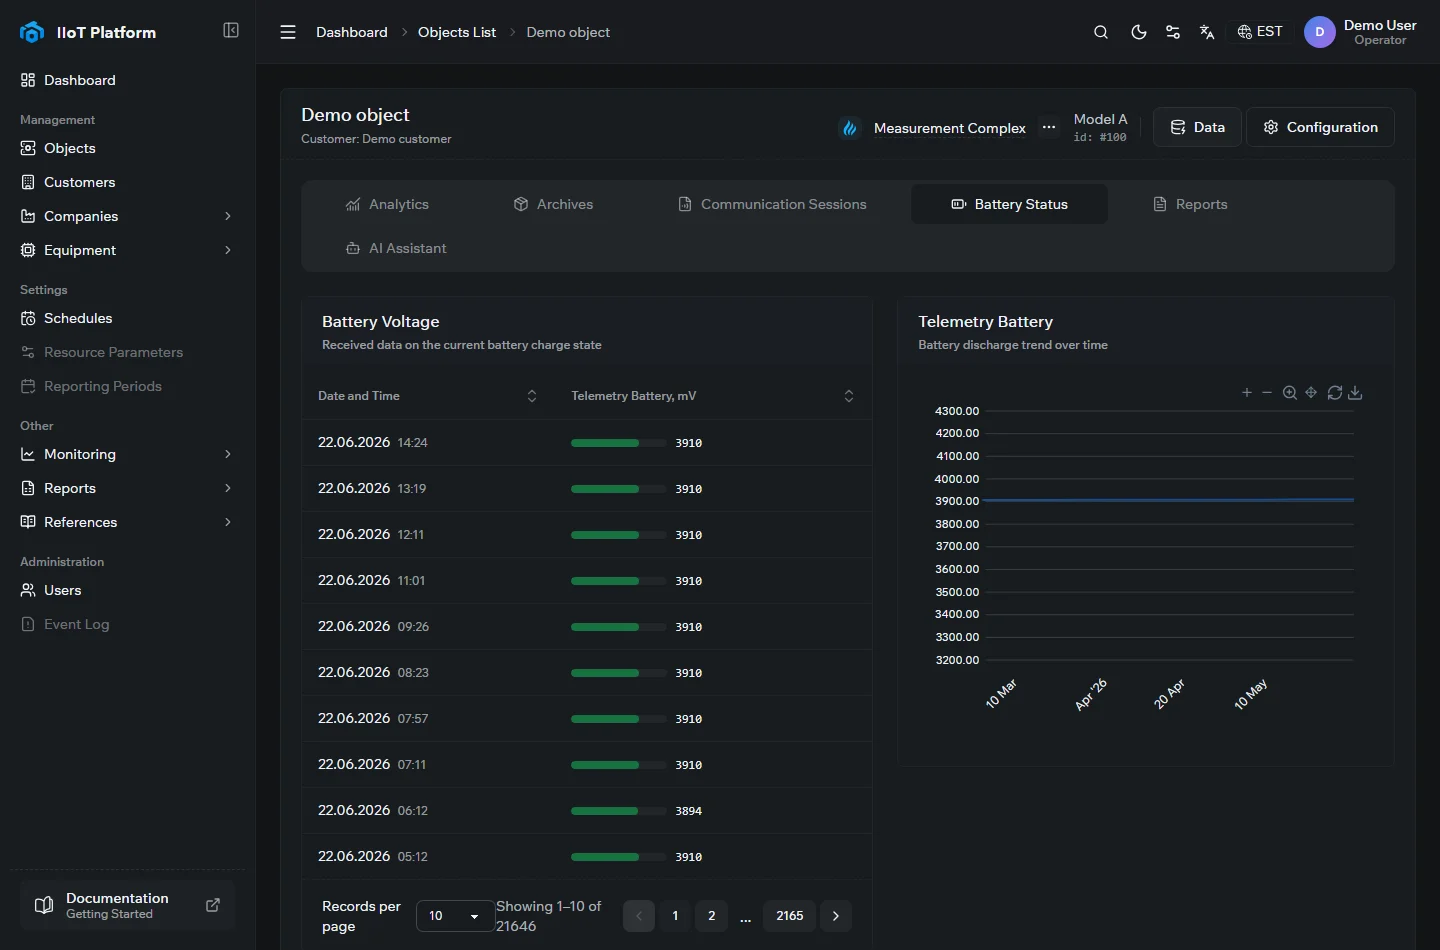
Battery Status shows the telemetry battery’s recent voltage readings as a table, alongside a discharge-trend chart over time — useful for spotting an autonomous device that is approaching the end of its battery life.
Reports
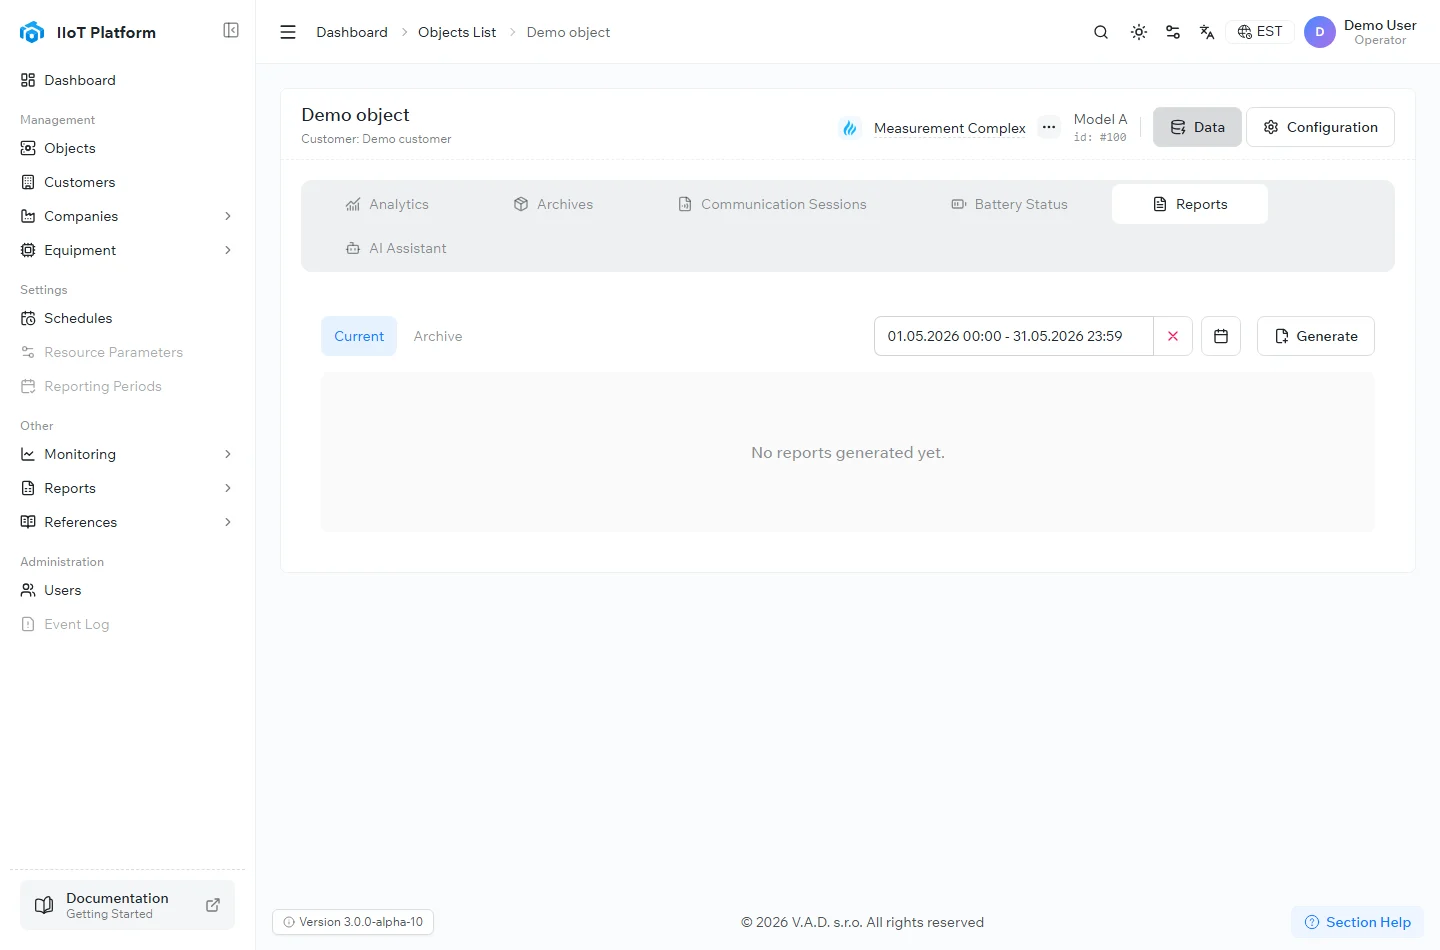
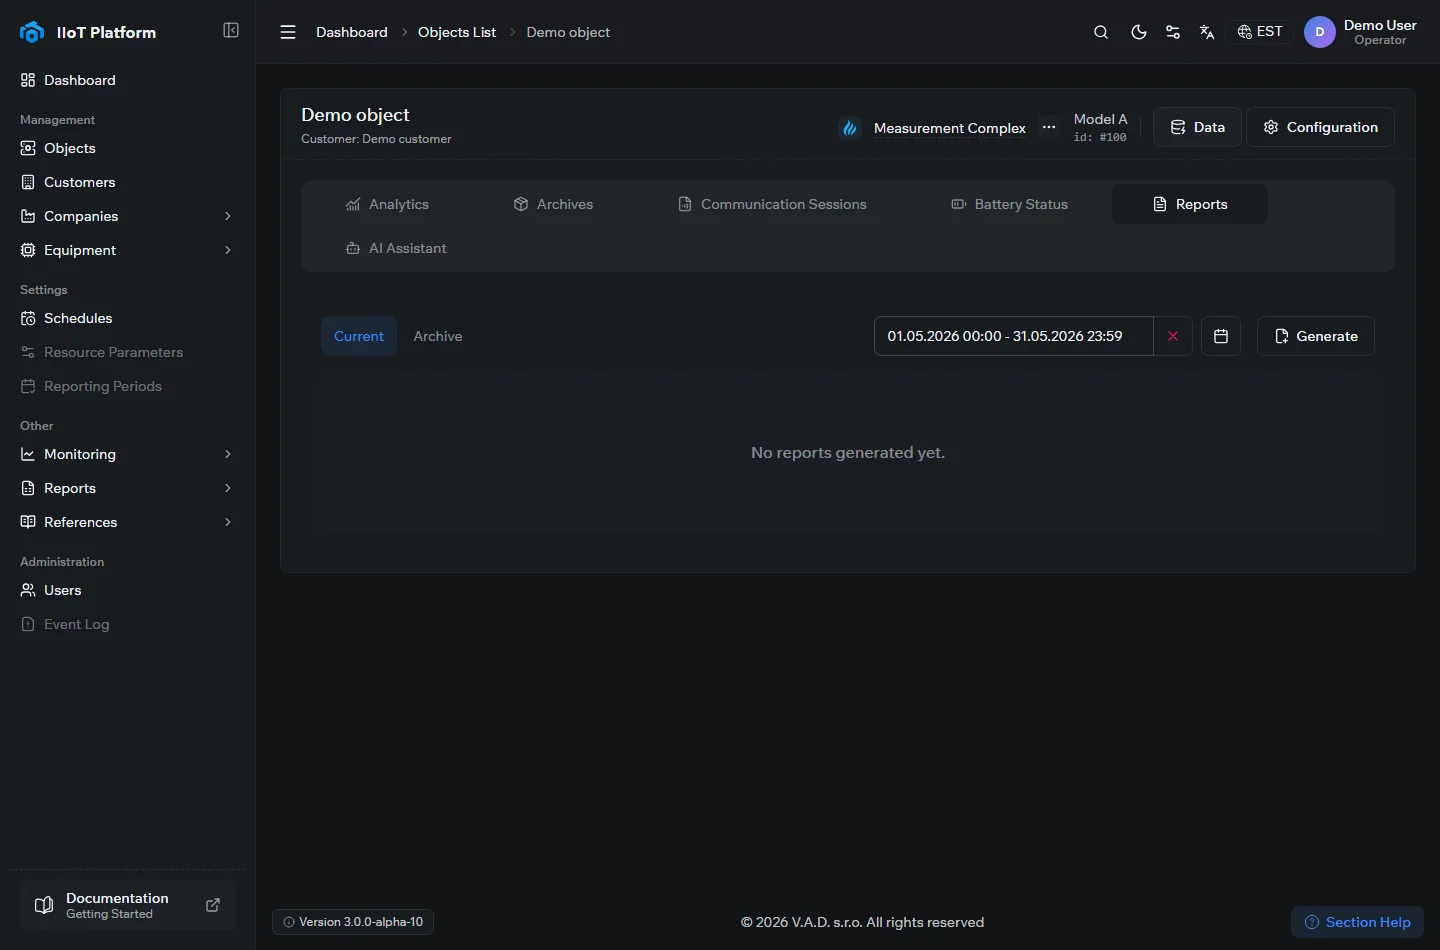
Reports generates and downloads reports for the device over a chosen period. Switch between Current and Archive, set the date range, and select Generate; the reports you create are listed here.
The AI Assistant tab rounds out the Data view, letting you ask natural-language questions about the device’s readings.
Configuration
The Configuration view is where the device is set up.
Equipment
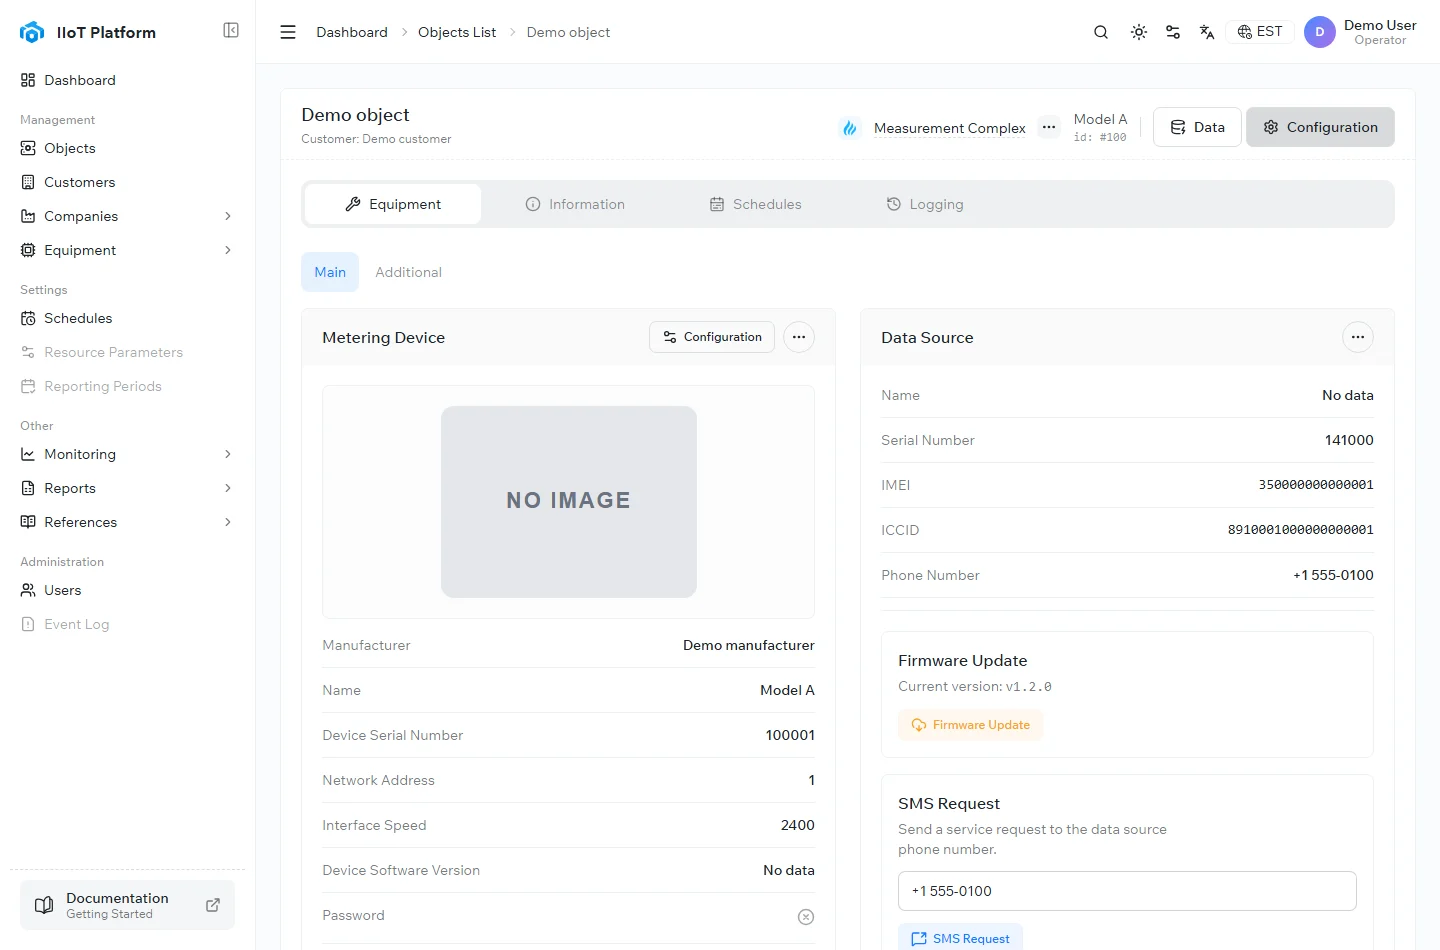
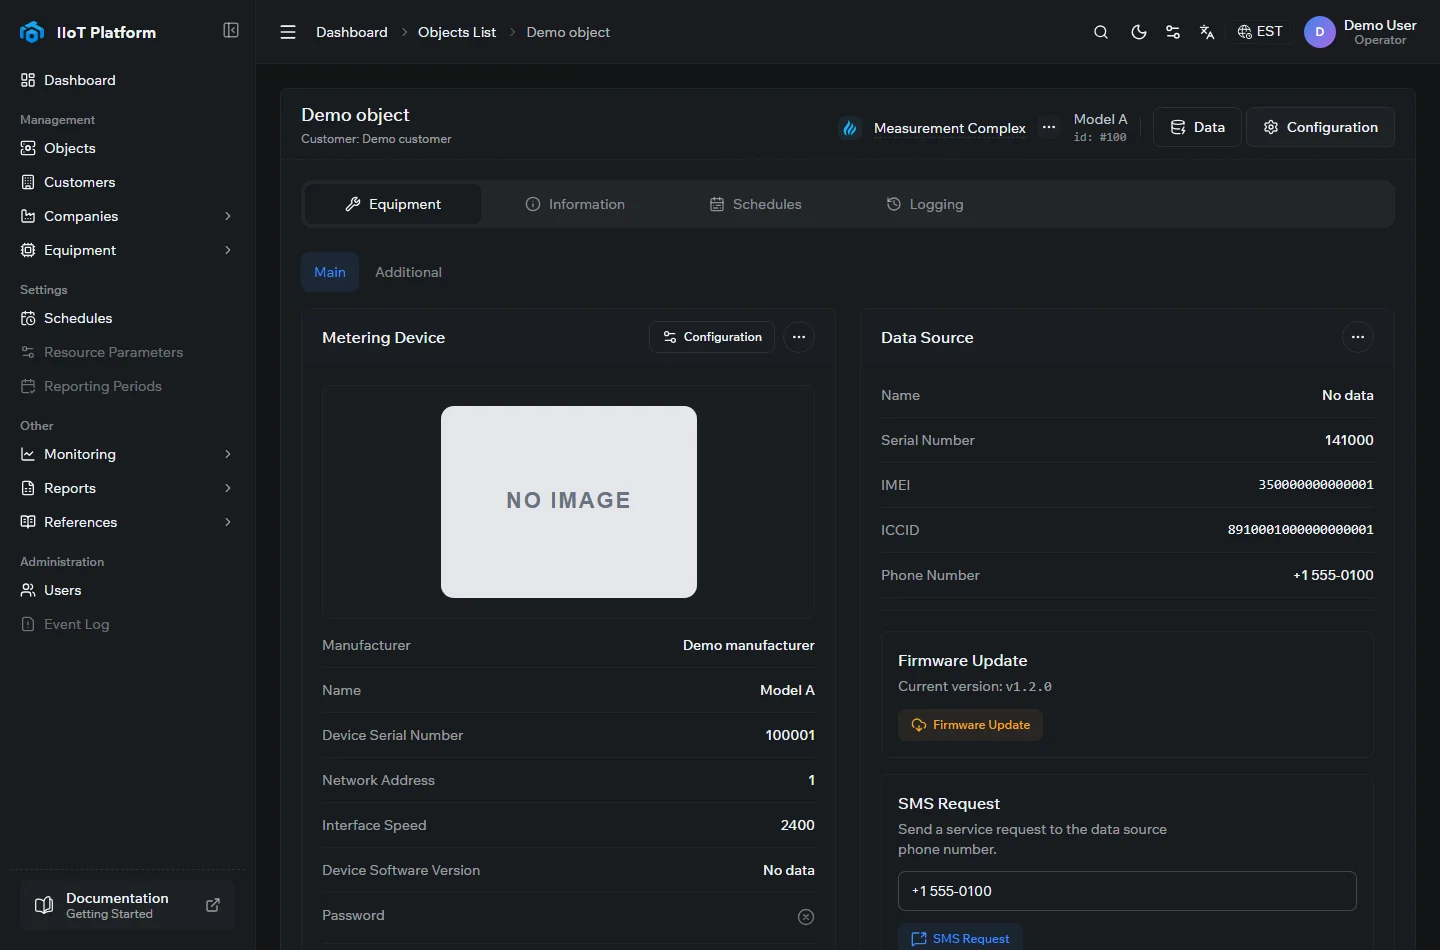
The Equipment tab is split into Main and Additional. Main holds the metering device and its data source — manufacturer and model, serial number, IMEI and ICCID, the SIM phone number, interface settings, and firmware updates. Additional holds extra parameters and any auxiliary equipment.
Information
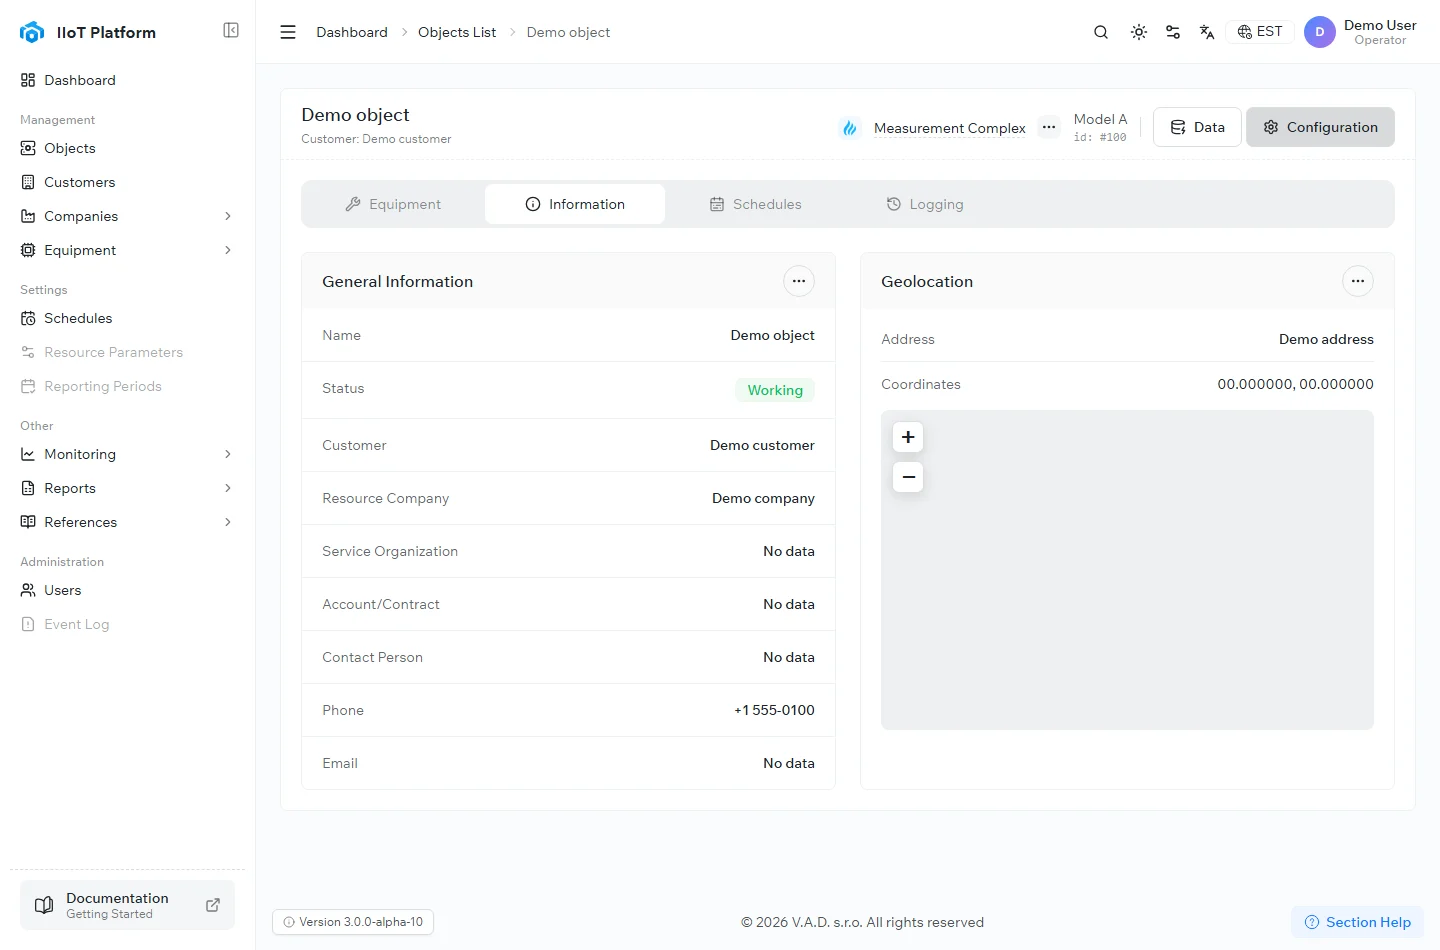
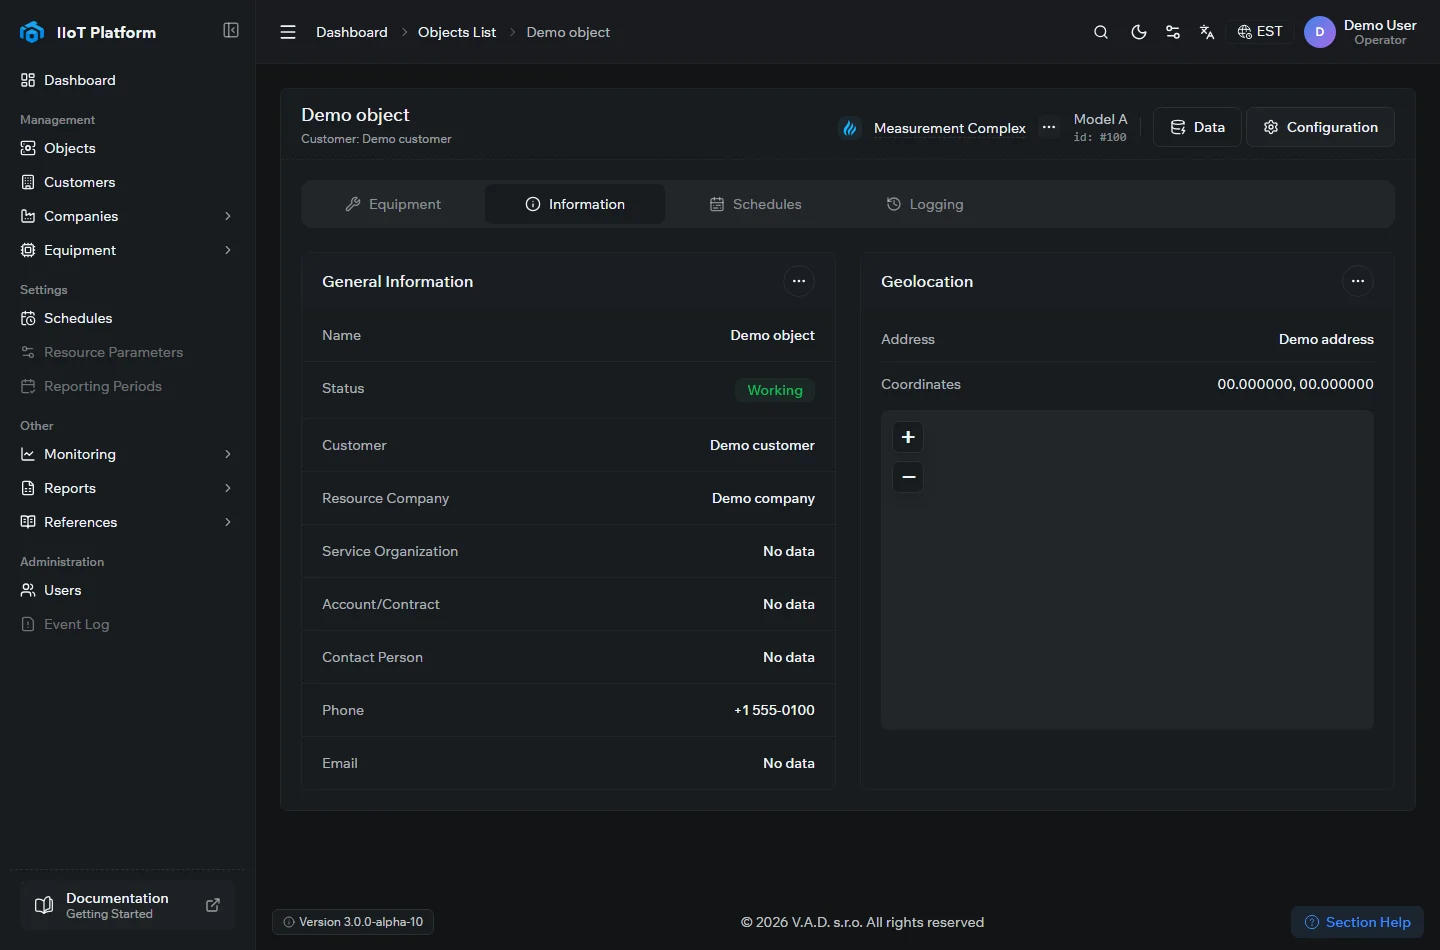
Information is the device’s passport: General Information (name, status, the customer, the resource-supply and service companies, and contacts) and Geolocation (the object’s address and its coordinates on a map).
Schedules
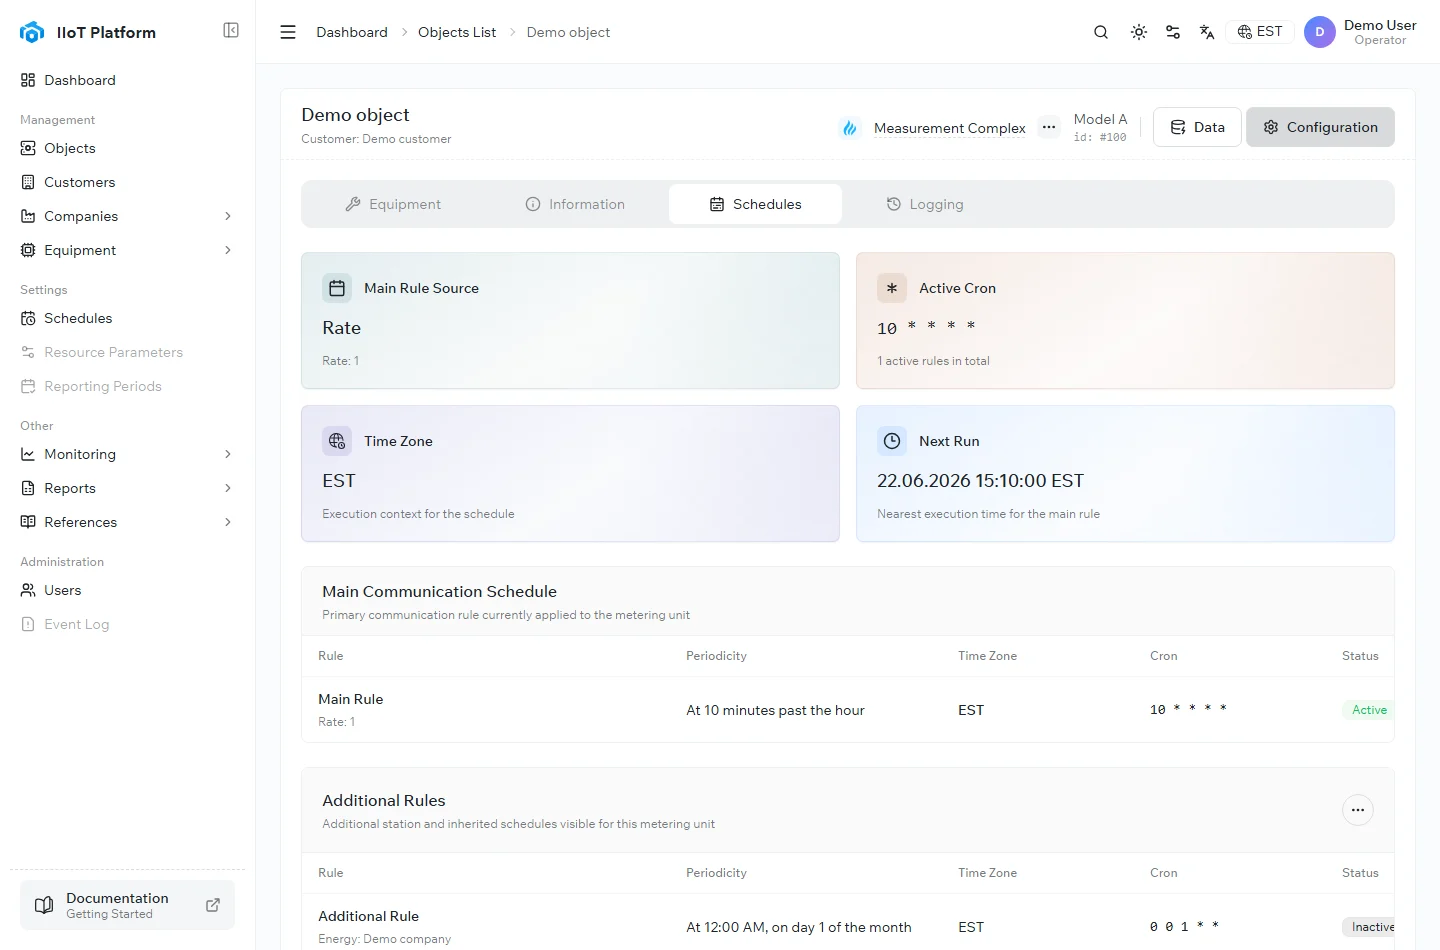
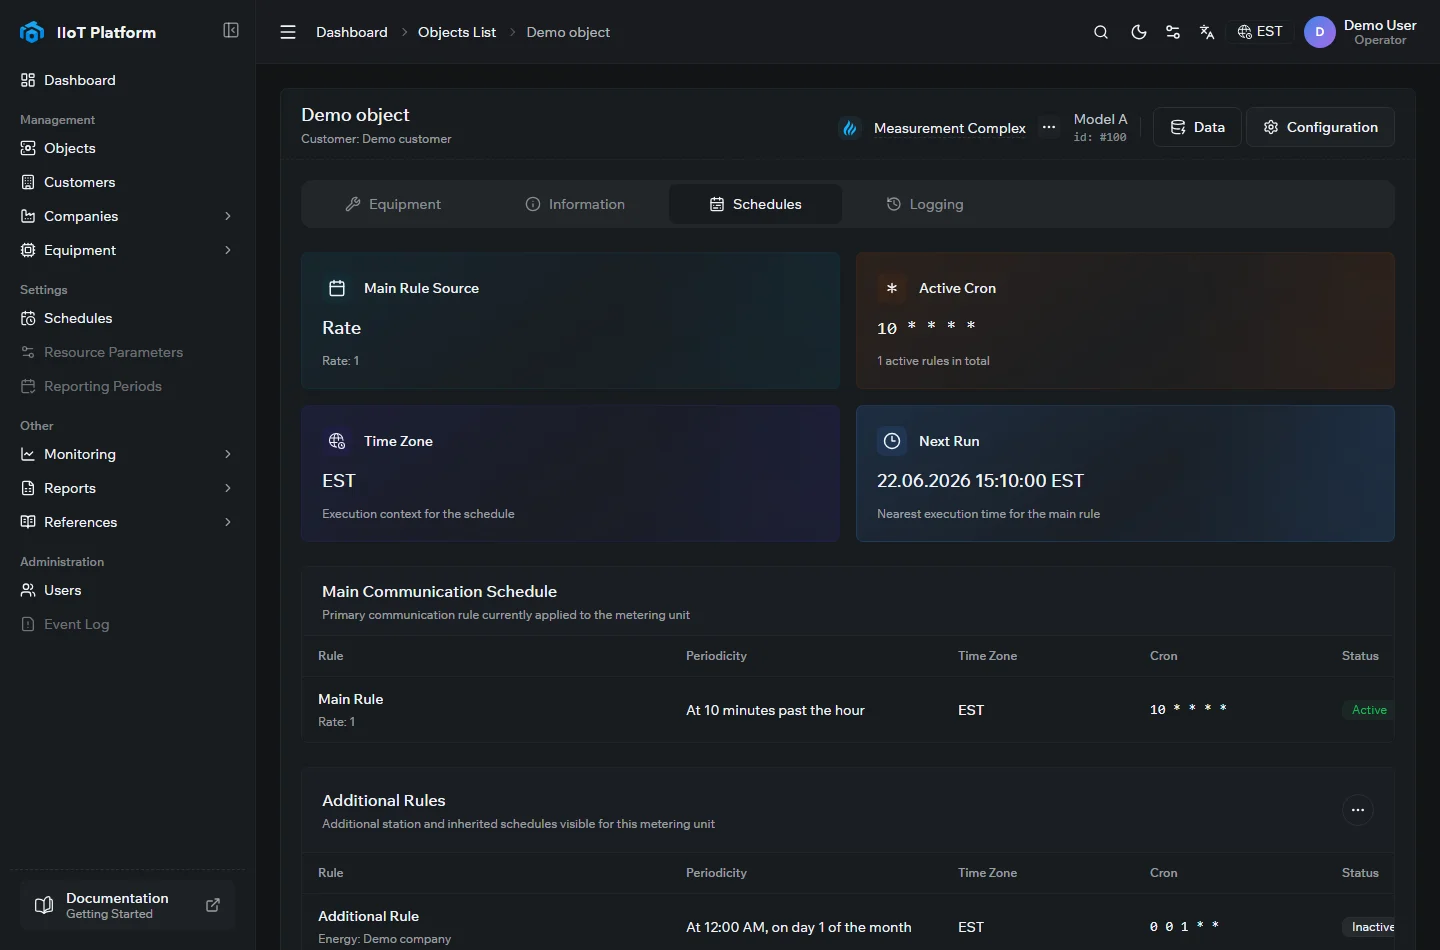
Schedules shows the communication schedule applied to the device — the main rule’s source, its cron expression and time zone, and the next run time — followed by the main communication schedule and any additional or inherited rules.
The Logging tab completes the Configuration view with a record of changes made to the device’s setup.
Related topics
Was this page helpful?
Thanks for your feedback!