Decarbonization (CO2e)
Climate, financial and operational impact of gas-metering telemetry — measured baseline, abatement potential, CO2e effect and verification readiness.
The Decarbonization report assesses the climate, financial and operational impact that gas-metering telemetry can deliver. It is built for an investor, the gas distribution organization, the ESG team, the metering team, operations and an external verifier.
The report ties together four levels of data:
- measured gas flow — how much gas is actually under monitoring;
- gas-loss candidates — where telemetry sees signs of potential under-metering, leakage or losses;
- methane and CO2e effect — what those potential losses translate into in climate units;
- investment scenario — how much it may cost to fix the identified points and what the possible payback is.
The methodology follows the GHG Protocol Corporate Standard (Scope 1), ISO 14064-1:2018, IPCC AR6 (GWP factors) and the IPCC 2006 Guidelines for National GHG Inventories.
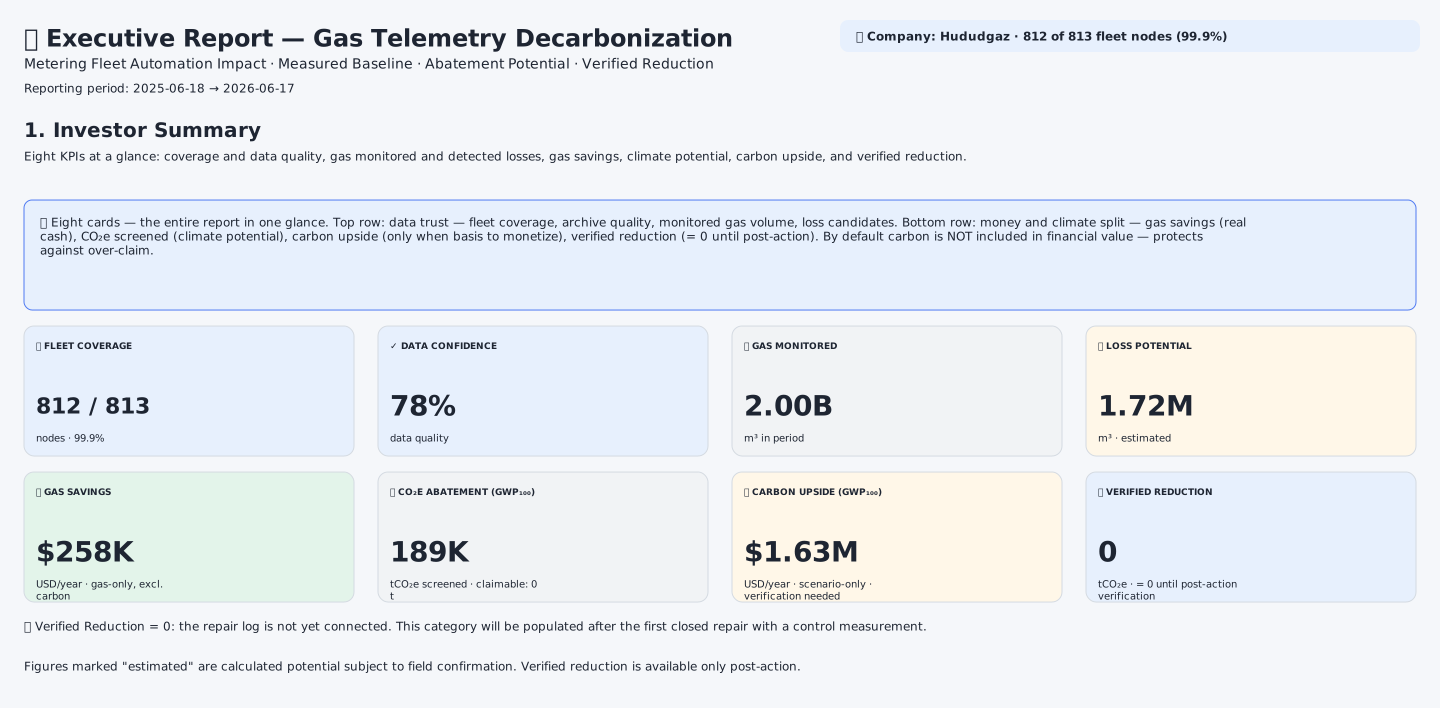
Report header and investor summary. The first block gives the investor the key indicators for a 30-second read. The first pair shows how much gas is seen and how much is presumably lost; the second translates those losses into climate terms; the third shows the economics. Figures marked “estimate” are calculated potential from behavioral signals, not a confirmed fact.
Key idea of the report
The report does not show an abstract “green” estimate but a measurable chain:
measured gas volume
→ data quality
→ potential loss hot spots
→ CH₄ calculation
→ CO₂e calculation
→ monetary valuation
→ CAPEX/OPEX scenarios
→ payback
→ verification readiness
The main principle:
first the measured baseline and data quality,
then the calculated potential,
and only after repair — the confirmed reduction.
The report must not mix these three states:
| State | Meaning |
|---|---|
Measured baseline | the measured starting base: how much gas there is and what data really exists |
Estimated potential | the calculated loss-reduction potential based on telemetry signals |
Verified reduction | the confirmed reduction after action, repair and a post-action measurement |
The main methodological split
This is the key rule of the report.
Not every loss candidate is a physical methane leak into the atmosphere. Some hot spots may represent commercial under-metering, a metering-channel failure, an archive error, an incorrect baseline, plant downtime or metering bypass with the customer actually consuming the gas afterwards. Such cases matter for economics and for the metering team, but they must not automatically turn into methane reduction and CO2e reduction.
Therefore each hot spot must carry a separate classification:
| Class | What it means | CH₄ / CO₂e reduction before field visit |
|---|---|---|
Commercial loss candidate | possible under-metering, under-billing, metering bypass | none, commercial potential only |
Fugitive methane candidate | possible physical gas leak into the atmosphere | conditional, only as calculated potential |
Metering anomaly candidate | meter / corrector / sensor / P_const / pulse-input failure | none, until confirmed |
Data-quality candidate | archive gaps, insufficient completeness, doubtful baseline | none |
Verified reduction | confirmed reduction after repair and a post-action measurement | yes |
Correct logic:
gas loss candidate
→ classification
→ abatement eligibility
→ field verification
→ repair / action
→ post-action measurement
→ verified reduction
Incorrect logic:
gas loss candidate
→ automatic methane reduction
→ automatic CO₂e abatementAbatement Eligibility Factor (AEF)
To safeguard the methodology, an eligibility coefficient for climate reduction is introduced:
where AEF_i is the share of the calculated gas-loss candidate for the i-th hot spot that is permissible to count as potential methane-emission reduction.
| Hot-spot class | Recommended AEF before field visit | Comment |
|---|---|---|
| confirmed physical leak | 1.0 | after field inspection |
| likely physical leak | 0.25–0.75 | only as scenario / calculated |
| under-metering / bypass / metering anomaly | 0.0 | commercial recovery, not methane reduction |
| archive error / data quality | 0.0 | do not count toward CO₂e |
| unknown cause | 0.0 | not claimable until classified |
Climate-eligible volume:
Total climate-eligible volume:
Commercial potential is calculated separately:
So the report has two distinct sums:
| Indicator | What it means |
|---|---|
Commercial recovery potential | the full calculated potential of gas losses / under-metering |
Methane abatement eligible potential | only the share eligible for the CH₄ / CO₂e calculation |
What the report shows and what it does not
What it shows
The report answers the following questions:
- what volume of gas is under telemetric monitoring;
- what percentage of the fleet has sufficiently high-quality data;
- how much gas can potentially be recovered or prevented as losses;
- what methane volume corresponds to the identified potential;
- what CO2e effect arises at the GWP₁₀₀ and/or GWP₂₀ horizons;
- how much the potentially saved gas is worth;
- what additional value a carbon price can provide;
- which nodes are hot spots;
- which scenario is more effective: the full fleet or quick wins;
- what CAPEX/OPEX is required and what the payback is;
- which data is suitable for ESG, GHG inventory, ISO 14064-1 and climate programmes.
What it does NOT do
The report must not:
- claim that the full calculated potential is already a confirmed saving;
- treat loss candidates as proven theft or leakage;
- add the scenario risk reserve to detected losses;
- present carbon revenue as guaranteed income before verification;
- replace an LDAR programme, field inspection or control measurement;
- build a confirmed reduction without post-action data;
- use nodes without data as zero losses;
- hide data quality;
- draw a legal conclusion about hot spots without field confirmation;
- treat the AI commentary as part of the calculation methodology.
Run parameters
Period (from / to)
Start and end dates of the analysis. Format yyyy-mm-dd. Rule: period_from ≤ period_to. The period determines which archives go into the baseline, what gas volume counts as “under monitoring”, which hot spots will be found and which seasonal effects will be visible.
Quick buttons: Today / Yesterday / Last 7d / 30d / 90d / Year-to-date / Year.
| Goal | Recommended period |
|---|---|
| quick technical test | 7 or 30 days |
| current hot-spot search | 30 or 90 days |
| investor report | 12 months |
| ESG / climate reporting | calendar year or full reporting year |
An optional energy/provider filter limits the analysis to nodes of a single resource provider; left empty, the report covers the entire fleet.
CH₄ fraction in natural gas
Range: 0.80–0.99. Typical value: 0.95. Methane is the main component of natural gas; to compute CO2e the gas volume has to be converted into methane mass:
GWP horizon
| Option | Meaning |
|---|---|
| GWP₁₀₀ | 100-year horizon — for most corporate and regulatory reports |
| GWP₂₀ | 20-year horizon — to emphasize the urgency of methane reduction |
| Both | show both options (recommended for investors) |
Gas price
Contract gas price, per 1 m³, entered in the chosen input currency. Example: 0.15 USD/m³.
Carbon-price scenario
| Scenario | Meaning |
|---|---|
| EU ETS | regulated market price |
| UAE voluntary | voluntary-market indicative price |
| World Bank shadow | indicative shadow price |
| Custom | user-defined price (filled in a separate field) |
Quick-wins scenario
Nodes are sorted by calculated reduction potential; the first N go into Quick-wins:
Recommendations: 5–10 for a pilot, 10–20 for an investor presentation, 20–50 for a first-phase programme.
Nodes for deep analysis
How many largest nodes by volume are included in the deep hot-spot analysis. Example: 60.
Interpretation:
DeepCoverage | Meaning |
|---|---|
| ≥ 80% | very good coverage of potential savings |
| 50–80% | working coverage for an investor report |
| 20–50% | preliminary estimate |
| < 20% | sample too narrow |
CAPEX / OPEX
| Field | What it includes |
|---|---|
CAPEX All Fleet per node | telemetry module, sensors, installation, cabinet, antenna, SIM, integration, commissioning |
CAPEX Quick-wins per node | field visit, diagnostics, control measurement, seal replacement, repair, photo documentation |
OPEX per node/year | SIM/connectivity, tech support, platform maintenance, updates, data storage, verification support |
AI commentary for the investor
The checkbox enables a textual explanation for the investor.
AI comment = explanation layer
AI comment ≠ calculation layer
AI comment ≠ verification layer
Currency model
The report serves an international audience, so currency is split into three explicit entities to avoid distortions between local tariffs and the carbon market.
| Parameter | Purpose |
|---|---|
input_currency | the currency in which gas price, CAPEX and OPEX are entered on the form |
reporting_currency | the currency used to display amounts in the report KPIs and tables |
fx_overrides | JSON override for FX rates if the defaults do not fit |
Internally the calculation always uses USD as the anchor currency (carbon markets, CBAM and CSRD reporting are denominated in USD/EUR). On input the form values are converted input_currency → USD; on render the output is converted USD → reporting_currency.
Where FX_X is the number of units of currency X per one USD. Default rates are indicative and refreshed roughly once a quarter; a user can supply a JSON override such as {"EUR": 0.92, "AED": 3.67}. The override is applied on top of the defaults; USD always remains the anchor at 1.0. Invalid keys or values are silently ignored. The audit trail records both currencies and the export contains gas_price_input, gas_price_usd_m3 and fx_overrides_applied, so an auditor can reproduce the calculation step by step.
Carbon revenue mode and carbon basis
A carbon component is not revenue until an off-take contract is signed and reductions are verified. Carbon is therefore explicitly gated by two parameters.
Carbon revenue mode
Determines how carbon upside enters financial value and payback:
| Mode | Behavior |
|---|---|
exclude | carbon is never shown in financials — not even as a scenario; the carbon upside card is hidden |
upside-only | recommended (default). Carbon is shown as a separate KPI card but is NOT summed into financial value — protects against over-claim |
include-if-basis | carbon enters financial value only if carbon_basis ≥ contract; otherwise it is ignored |
Carbon monetization basis
Legal basis for monetization of CO2e:
| Basis | Level | Meaning |
|---|---|---|
none | 0 | no basis — carbon is not shown even as upside |
shadow | 1 | internal shadow price (for DCF, scenario planning) |
voluntary | 2 | voluntary market candidate (verification required) |
contract | 3 | off-take agreement in place |
regulatory | 4 | regulated credit (EU ETS etc.) |
verified | 5 | verified issued credits (ready for sale) |
Carbon enters ROI only when the mode is include-if-basis and the basis is at least contract. The financial-value formula in the investor summary is:
With the default mode = upside-only, basis = shadow: the carbon card is visible (scenario potential), carbon is NOT included in financial value (gas-only saving), and payback is computed gas-only. This is the most conservative behavior — the investor sees the climate potential, but financial promises are made only against real gas.
Main methodology parameters
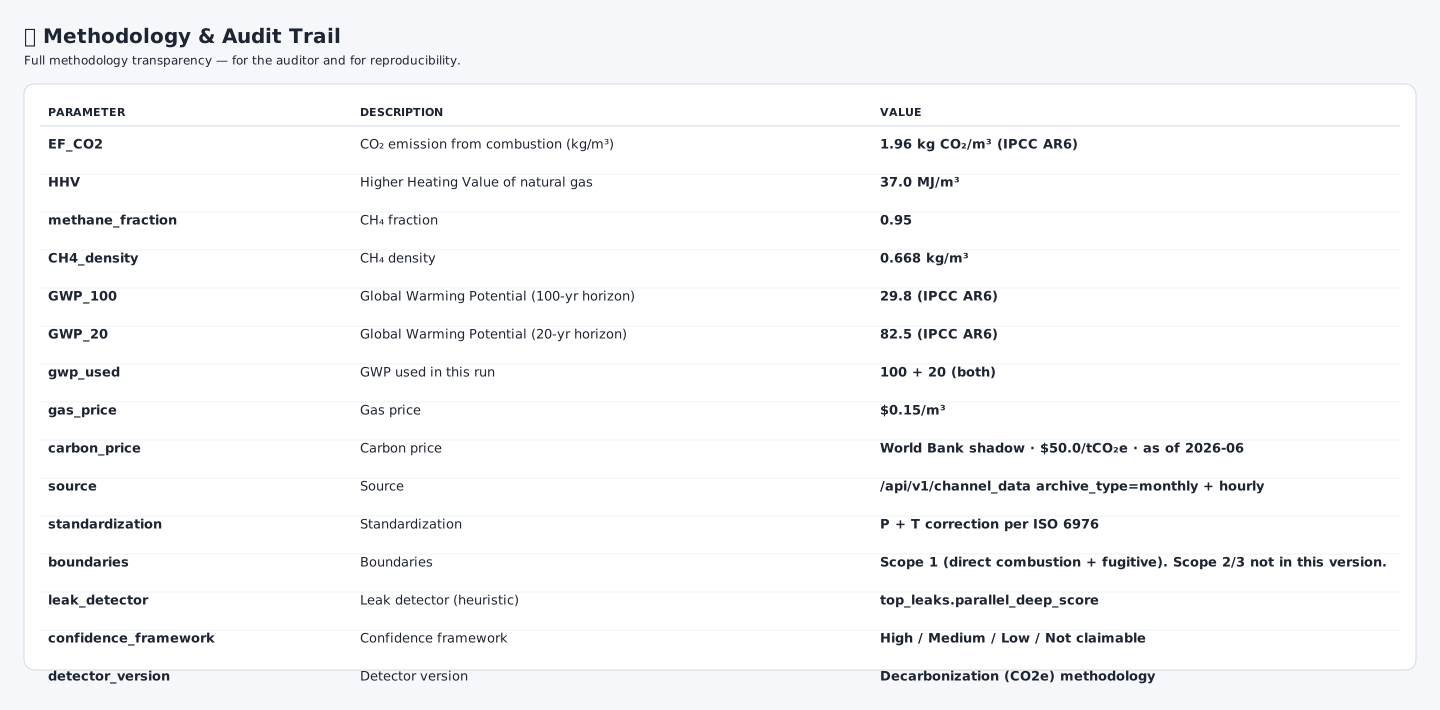
Methodology and audit trail. Full transparency of the methodology for the auditor and for reproducibility. All coefficients have sources: IPCC AR6 for GWP, ISO 6976 for pressure/temperature standardization. Boundary: Scope 1 (direct combustion + fugitive methane); Scope 2/3 are not in this version.
| Parameter | Symbol | Typical value |
|---|---|---|
| CO₂ emission from combustion | EF_CO2 | 1.96 kg CO₂/m³ (IPCC AR6) |
| Higher heating value | HHV | 37.0 MJ/m³ |
| Methane fraction | F_CH4 | 0.95 |
| Methane density | ρ_CH4 | 0.668 kg/m³ |
| GWP₁₀₀ | GWP_100 | 29.8 (IPCC AR6) |
| GWP₂₀ | GWP_20 | 82.5 (IPCC AR6) |
| Gas price | Price_gas | user-defined |
| Carbon price | Price_carbon | by scenario or Custom |
| Standardization | — | P + T correction per ISO 6976 |
| Accounting boundaries | boundaries | Scope 1 (direct combustion + fugitive methane) |
| Hot-spot quality | confidence | High / Medium / Low / Not claimable |
Investor summary — eight KPIs
The investor summary is the top block of the report for a 30-second read, arranged as two rows of four cards.
Row 1 — Data trust (can the numbers be trusted):
- Fleet coverage — how many fleet nodes report data
- Data quality — share of high-quality monthly archives
- Gas monitored — gas volume under monitoring for the period
- Loss potential — calculated loss-reduction potential (estimate)
Row 2 — Money + climate (explicitly separated streams):
- Gas-only savings — real gas-only savings (gas-only ROI)
- CO2e abatement (screened) — climate potential
- Carbon upside — potential carbon income (scenario-only, gated)
- Verified reduction — confirmed reduction (
0until post-action verification)
Payback is presented in the investment-scenarios section, with separate figures for All Fleet vs Quick-wins.
Gas under monitoring
where V_i is the measured gas volume per node; N is the number of nodes with valid data.
Gas-loss reduction potential
where K is the number of identified hot spots; V_loss,j is the calculated loss potential for the j-th hot spot.
CO2e reduction potential
For the selected GWP:
Result is expressed in tCO₂e.
Financial value
where:
Payback
If AnnualValue ≤ OPEX, the payback is not computed or shown as does not pay back under the given parameters.
Data confidence
Data confidence shows what share of the fleet has data fit for the calculation:
or, for the fleet:
The report uses a combined score taking into account the share of valid hours, the number of nodes with a high-quality monthly archive, the share of nodes without data and the deep-analysis coverage by annual volume.
Measured baseline — sample quality passport
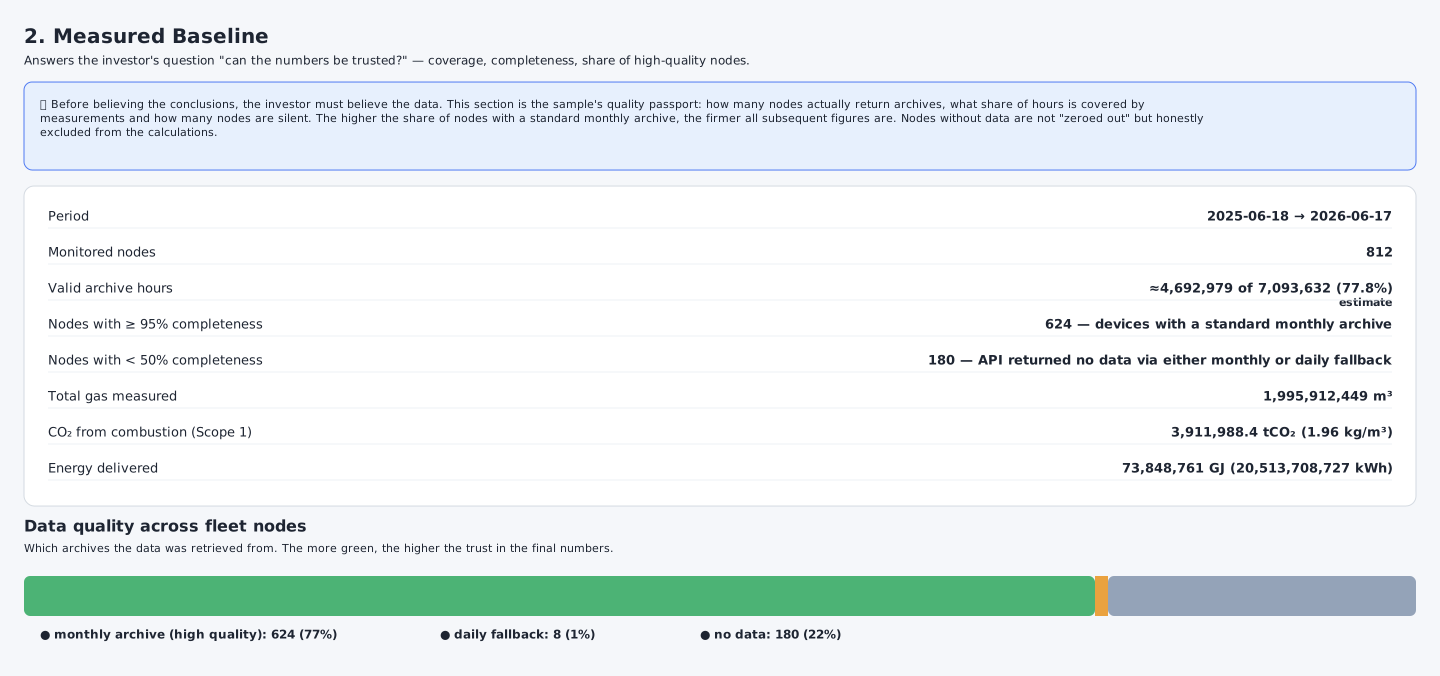
Measured baseline. Before believing the conclusions, the investor must believe the data. This section is the sample quality passport: how many nodes actually return archives, what share of hours is covered by measurements, and how many nodes are silent. The higher the share of nodes with a standard monthly archive, the firmer all subsequent figures are. Nodes without data are not zeroed out but honestly excluded from the calculations.
Expected hours
For each node:
For the fleet:
Valid hours and coverage
Nodes with high completeness
A node is considered high-quality if:
Share:
Measured gas volume
CO₂ from combustion
where EF_CO2 = 1.96 kg CO₂/m³ (IPCC AR6).
Energy delivered
where HHV = 37.0 MJ/m³.
Fleet data-quality categories
| Category | Meaning |
|---|---|
Monthly archive / high quality | the main complete archive, high level of trust |
Daily fallback | data obtained via the daily fallback archive |
No data | no data received |
Not claimable | data insufficient for inclusion in the calculation |
Hot-spot methodology — gas-loss reduction candidates
Hot spots are nodes where telemetry has detected signs of potential losses, under-metering or abnormally low recorded consumption.
Typical detected signs:
- zeros during active hours;
- pressure without flow;
- archive gaps;
- inflated baseline;
- suspected loss of metering;
- a persistent pattern requiring a field visit.
Each hot spot must additionally receive two fields:
| Field | Purpose |
|---|---|
loss_class | classification: commercial losses / fugitive methane / metering anomaly / data quality |
abatement_eligibility | whether the hot spot can be counted in the CH₄ and CO₂e calculation |
Example:
| Detected sign | loss_class | abatement_eligibility |
|---|---|---|
| zeros during active hours | commercial-loss candidate or metering anomaly | usually No until field confirmation |
| pressure without flow | metering anomaly or fugitive-methane candidate | Conditional |
| confirmed leak at field visit | confirmed fugitive methane | Yes |
| archive gap | data-quality candidate | No |
Deep analysis of the largest nodes
Baseline for a hot spot
Possible baseline options:
| Option | Formula |
|---|---|
| historical median | Baseline_h = median(Q_h outside anomaly windows) |
| hour-of-day profile | Baseline_hour = median(Q | hour_of_day = h) |
| hour-and-weekday profile | Baseline_{h,d} = median(Q | hour=h, weekday=d) |
| cohort baseline | Baseline_cohort = median(Q for similar nodes) |
Potential loss per hour and per node
Annualization
If the analysis covers less than a full year:
Confidence framework — hot-spot confidence levels

Confidence framework. Every hot spot is rated on four confidence levels. Only the High level (after repair and measurement) can be used as a confirmed reduction. The rest are only potential, only a candidate, or do not enter the total at all. This protects against substituting calculated for confirmed.
| Level | Condition | How to use |
|---|---|---|
High | measured and confirmed after repair | can be used as a verified reduction |
Medium | stable telemetry pattern ≥ 30 days | potential, field visit needed |
Low | heuristic without field verification | candidate only |
Not claimable | data insufficient | not summed into the total |
Hot spots — candidate table
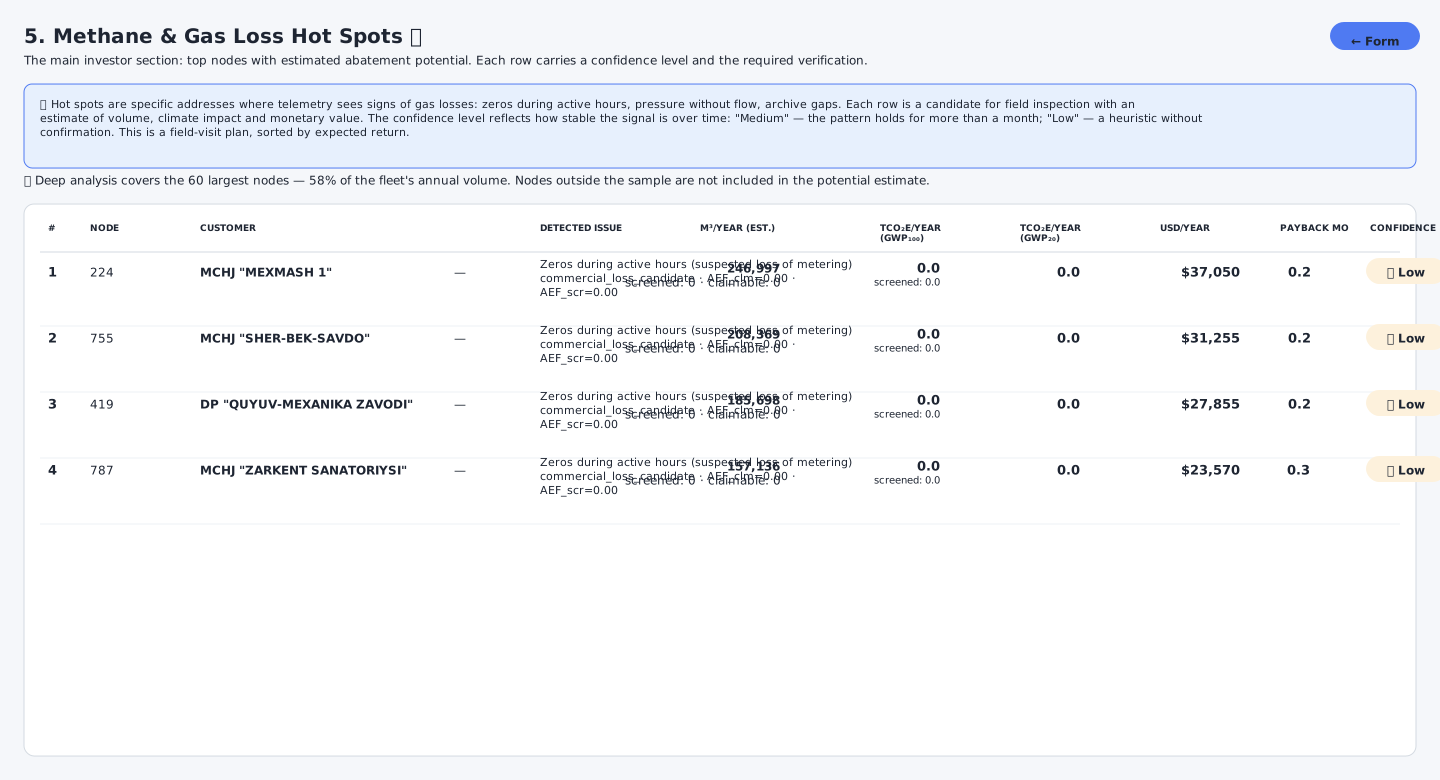
Methane and gas-loss hot spots. The main investor section: top nodes with calculated reduction potential. Each row is a candidate for field inspection with an estimate of volume, climate impact and monetary value. The confidence level reflects how stable the signal is over time. When a leading hot spot is a commercial_loss_candidate with AEF_clm=0.00 and AEF_scr=0.00, its row-level tCO2e is 0 both as claimable and as screened — the methodology separates three layers: commercial recovery, methane-screened scenario, and claimable verified reduction.
Table columns
| Column | Meaning |
|---|---|
# | hot-spot rank |
| Node | node id and name |
| Customer | organization |
Detected issue | type of identified sign + classification + AEF |
m³/year (estimate) | calculated volume + eligible share |
tCO₂e/year (GWP₁₀₀) / (GWP₂₀) | climate effect from the climate-eligible share only |
USD/year | gas value + carbon value |
Payback months | if CAPEX_per_node is set |
Confidence | High / Medium / Low |
Carbon upside
CO2e ≠ 0 appears only for hot spots classified as fugitive methane candidate or verified fugitive methane. For a commercial_loss_candidate it remains 0 — this is correct: commercial losses cannot be automatically translated into a methodological reduction.
AI Risk Matrix — priority and risk type
Hot spots can be ranked beyond financial impact with two additional columns: Priority (P1/P2/P3) and Risk Type (detection category), with a distribution badge above the table.
Risk Type — categorization by the detector
| Risk Type | Detector subscore | Meaning |
|---|---|---|
zero_flow | quiet_min | zeros during active hours — suspected loss of metering |
persistent_leak | persistence | persistent low flow ≥ 30 days — leak-like signal |
suspicious_baseline | baseline_p5 | inflated baseline P5 — possible tampering / mis-calibration |
corrector_error | drift | daily/weekly baseline drift — the corrector is malfunctioning |
data_quality | unknown | the detector could not classify |
Priority — P1/P2/P3
| Priority | Condition |
|---|---|
| P1 — immediate (field + repair) | loss_class = fugitive_methane_candidate (any) OR usd_value ≥ $20K AND confidence ∈ {medium, high} |
| P2 — scheduled inspection | usd_value ≥ $5K OR confidence = medium |
| P3 — monitoring | everything else |
Above the hot-spots table the distribution is shown as P1·N | P2·N | P3·N on a red / yellow / grey color scale, so the investor sees in seconds how many nodes require immediate action.
Usage
- The field crew takes the P1 node list as the first priority for site visits.
- A financial analyst estimates aggregate exposure across P1+P2 (lower bound) or P1+P2+P3 (upper bound).
- ESG reporting includes in disclosure only nodes with
risk_type = persistent_leak(which is leak-like; the rest is metering / data-quality risk).
Where the gas goes — volume breakdown
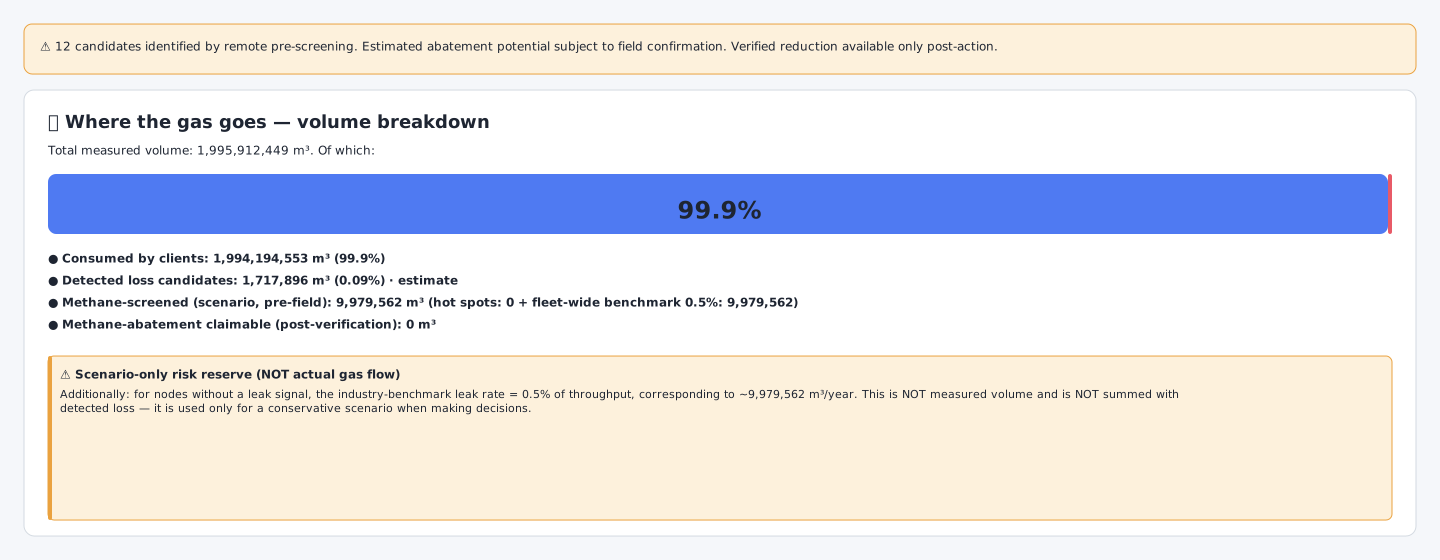
Where the gas goes. This section explains which share of measured gas is normal consumption and which is a loss candidate. In a healthy fleet, the overwhelming majority of the volume under monitoring is consumed by customers and only a small fraction lands in loss candidates. Methane-abatement claimable is 0 when all hot-spot candidates are classified as commercial_loss_candidate (AEF_clm = 0, AEF_scr = 0). The methane-screened (scenario, pre-field) volume is a fleet-wide industry-benchmark scenario of 0.5% of throughput, applied for the climate narrative before field verification, and is not claimable.
Distribution formulas
Scenario risk reserve
An additional scenario-level risk estimate for nodes with no explicit leak signal. For example, an industry benchmark:
Methane calculation
The methane calculation must not automatically include the full V_loss. First the climate-eligible volume is determined:
If a hot spot is only a commercial under-metering case or a metering anomaly:
and that volume does not enter the methane-reduction calculation.
Methane volume
Methane mass
where ρ_CH4 = 0.668 kg/m³.
CO2e calculation from avoided methane losses
Main formula
GWP₁₀₀ vs GWP₂₀
Why GWP₂₀ is larger
Methane has a strong short-term climate impact:
The GWP₂₀ estimate is roughly 2.8× the GWP₁₀₀ one — this is needed to emphasize the urgency of methane reduction.
Financial valuation
Commercial value of potentially recoverable gas
Computed across the entire Commercial recovery potential, even if that volume is not yet a methane reduction:
Carbon-upside value
Computed only on the climate-eligible and subsequently verifiable volume:
Before verification, this is a shadow / scenario value, not confirmed revenue.
Annual scenario value
For a conservative financial scenario, only the gas part may be used:
Investment scenarios
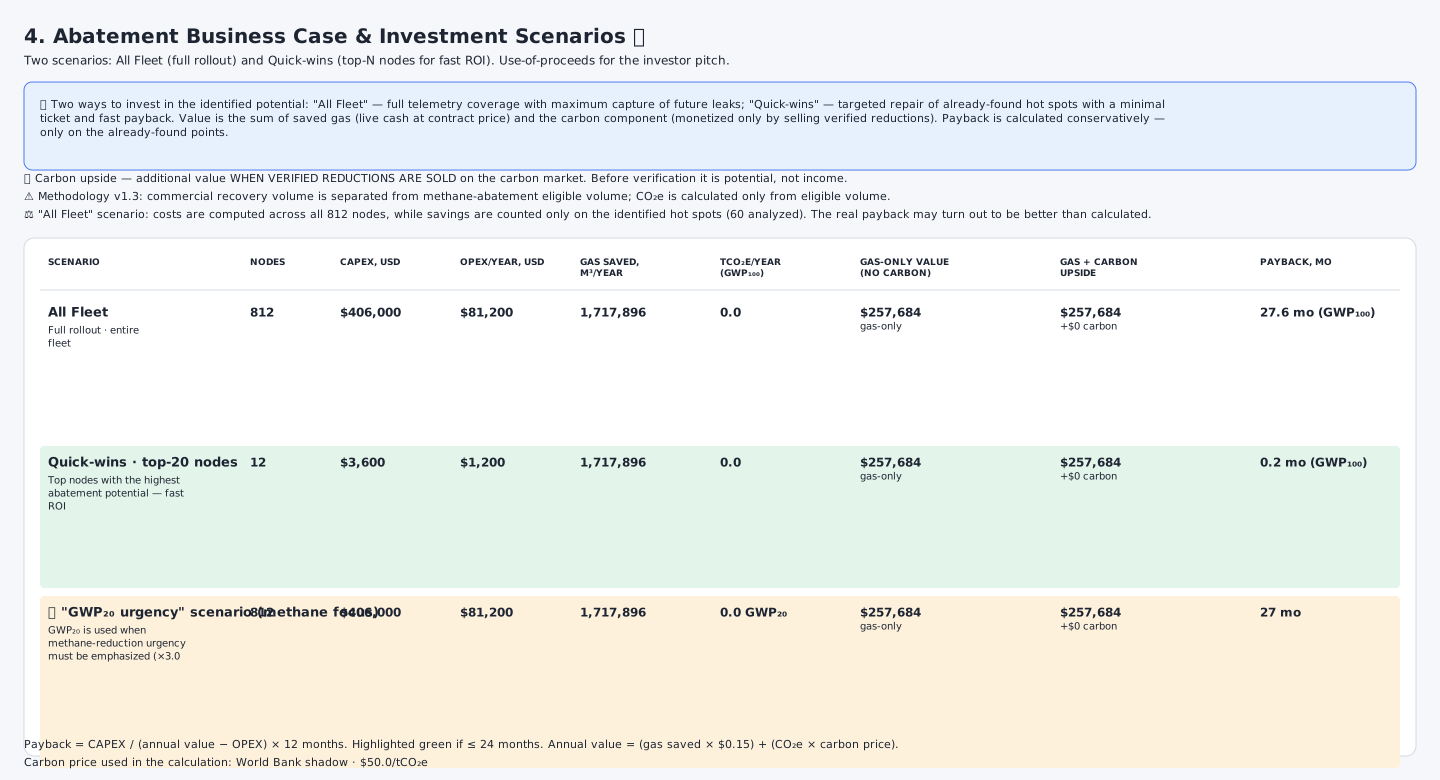
Abatement business case and investment scenarios. Two ways to invest in the identified potential: “All Fleet” — full telemetry coverage with maximum capture of future leaks; “Quick-wins” — targeted repair of already-found hot spots with a minimal ticket and fast payback. The third scenario, “GWP₂₀ urgency”, is used when methane-reduction urgency must be emphasized (×2.8 vs GWP₁₀₀).
All Fleet
This is a conservative approach — full-fleet coverage may surface additional future hot spots, but only what is already identified is counted.
Quick-wins
GWP₂₀ scenario (urgency)
The same physical gas volume, but CO2e through the 20-year horizon:
Needed to emphasize methane-reduction urgency.
Payback and ROI
If NetAnnualValue ≤ 0 — payback not computed / does not pay back.
Use of proceeds and outcome tracking
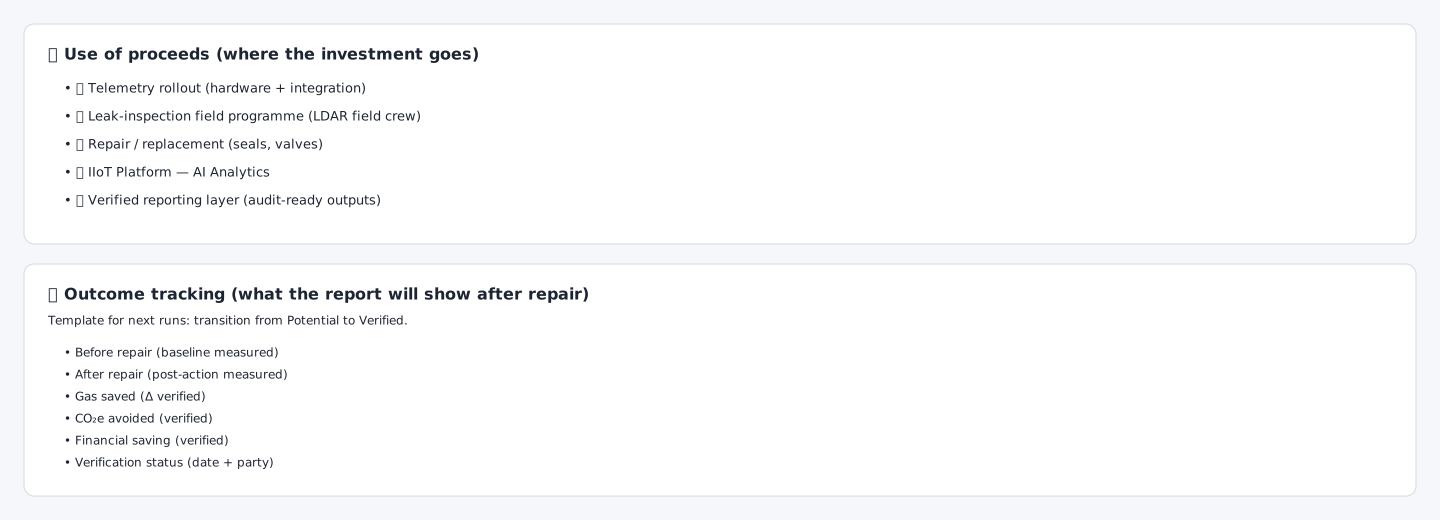
Use of proceeds + Outcome tracking. “Use of proceeds” tells the investor where the money goes; “Outcome tracking” is the template for how the report will display results after the first closed repair. This turns “a promise of potential” into “an evidentiary track record”.
Use of proceeds — typical lines
- telemetry rollout (hardware + integration);
- field inspection / LDAR programme;
- repair and replacement (seals, valves);
- analytics platform;
- audit-ready reporting (verifiable reporting layer).
Outcome tracking — from potential to verified
| State | Formula |
|---|---|
| Before repair | V_before (measured baseline) |
| After repair | V_after (post-action measurement) |
| Verified gas reduction | V_saved,verified = V_baseline,expected − V_after,normalized |
| Verified CO₂e | CO2e_verified = V_saved,verified × F_CH4 × ρ_CH4 × GWP / 1000 |
Verification statuses
| Status | Meaning |
|---|---|
Potential | calculated potential identified |
Field checked | field visit completed |
Repair completed | action completed |
Post-action measured | post-repair period obtained |
Verified | reduction confirmed |
Rejected | reduction not confirmed |
Not claimable | data insufficient |
UAE Net Zero — regulatory alignment
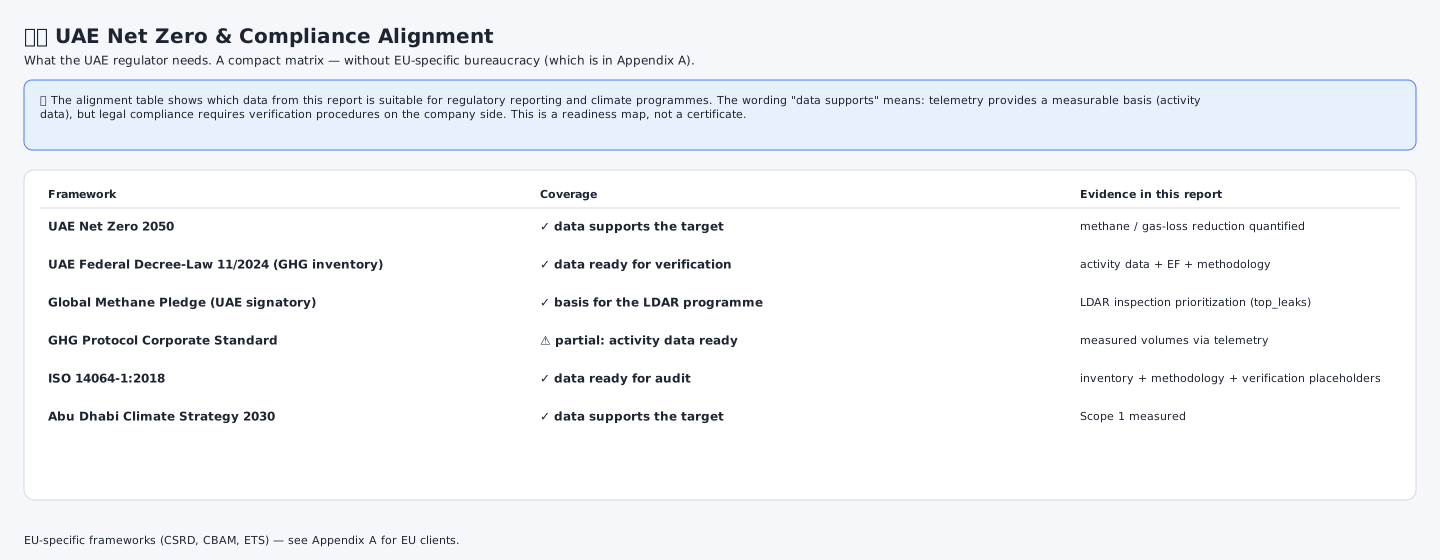
UAE Net Zero — regulatory alignment. A compact regulatory-alignment matrix. The wording “data supports” means: telemetry provides a measurable foundation (activity data), but legal compliance requires verification procedures on the organization’s side. This is a readiness map, not a certificate.
UAE Net Zero 2050
The report supports the target through measuring gas under monitoring, identifying potential methane reduction, estimating CO2e and prioritizing actions.
GHG inventory
A GHG inventory requires: activity data, emission factor, accounting boundaries, methodology, audit trail, verification status.
GHG Protocol Corporate Standard
The report supports Scope 1 inventory preparation because it contains the measured gas volume, emission factor, Scope 1 boundaries, methodological parameters and source transparency.
ISO 14064-1:2018
ISO 14064-1 requires: organizational boundaries, emission sources, factors, calculation method, uncertainty, activity data, audit possibility, change history, verification status.
The report provides the basis:
inventory + methodology + verification placeholdersAppendix A — EU framework support
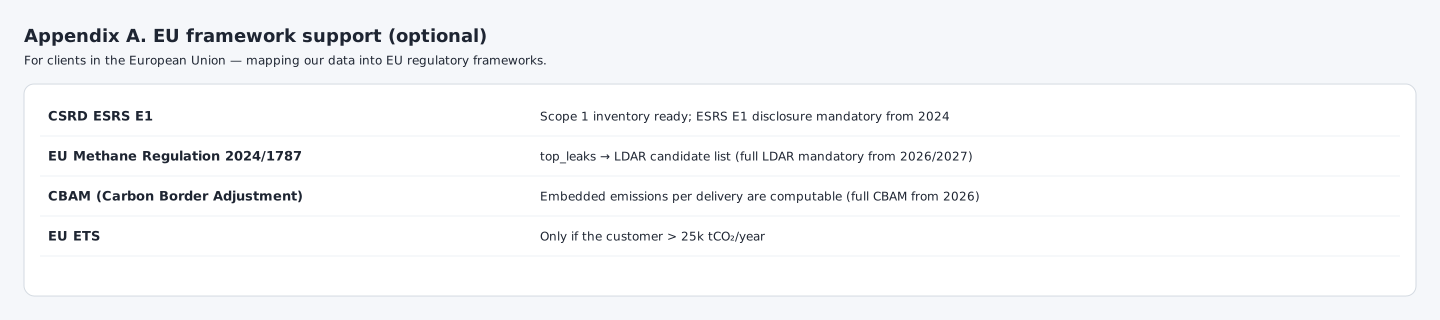
Appendix A — EU framework support. An additional matrix for EU clients, separated from the main UAE alignment block. For an EU client, this appendix shows how the data maps to CSRD ESRS E1, the EU Methane Regulation 2024/1787, CBAM and EU ETS.
| Framework | How it is connected |
|---|---|
CSRD / ESRS E1 | Scope 1 inventory and disclosure (mandatory from 2024) |
EU Methane Regulation 2024/1787 | LDAR candidate list (full LDAR mandatory from 2026/2027) |
CBAM | embedded emissions per delivery (full CBAM from 2026) |
EU ETS | applicable only to large emitters (> 25k tCO₂/year) |
AI commentary for the investor

AI commentary for the investor. A textual explanation of the report in human language: the main takeaway, strengths and weaknesses, due-diligence questions. The AI commentary does not influence the calculation — it is an explanation layer, not a calculation layer.
What AI can do
- briefly state the main takeaway;
- explain the payback;
- point out weak spots;
- pose due-diligence questions;
- explain data quality.
What AI cannot do
AI cannot:
- change the KPIs;
- change the hot spots;
- change the CO2e;
- change the payback;
- replace the methodology;
- replace the audit trail;
- confirm a verified reduction.
How to read the report
Step 1 — Investor summary
Start with the KPIs: gas under monitoring, gas-loss reduction potential, CO2e reduction, financial value, payback, data confidence.
Step 2 — Measured baseline
Check how reliable the base is: how many nodes are monitored, how many hours are valid, how many high-quality nodes there are, how many are without data.
Step 3 — Hot spots
Open the hot-spot list and check the type of detected sign, the calculated m³/year, confidence, whether the node is in Quick-wins, whether a field visit is needed.
Step 4 — Business case
Check: CAPEX, OPEX, gas price, carbon price, annual value, payback, the difference between All Fleet and Quick-wins.
Step 5 — Regulatory alignment
Make sure the report says not “certified” but “data ready for verification”, “data supports the target”, “activity data available”.
Step 6 — Audit trail
Check the coefficients, methodology, accounting boundaries, the verified/potential status, the export.
Common interpretation mistakes
Mistake: calculated potential = verified reduction
Wrong. Calculated potential requires field verification. A verified reduction appears only after action.
Mistake: detected loss = proven leak
Wrong. It is a candidate for inspection. Once a hot spot is classified as commercial_loss_candidate, it has AEF_clm=0 and AEF_scr=0, so neither claimable nor screened CO2e is computed at the row level. The climate narrative is provided only by the fleet-wide industry-benchmark scenario (0.5% of throughput).
Mistake: carbon value = guaranteed income
Wrong. Carbon value is possible only on the sale of verified reductions.
Mistake: nodes without data = zero losses
Wrong. They are excluded or marked as “not claimable”.
Mistake: the scenario reserve can be added to detected losses
Wrong. The scenario reserve is a separate scenario layer.
Mistake: GWP₂₀ can be used instead of GWP₁₀₀ without explanation
Wrong. GWP₂₀ is needed to emphasize methane urgency, while GWP₁₀₀ is for standard comparable reporting.
Mistake: fast payback means an already-confirmed saving
Wrong. Fast payback shows investment attractiveness once actions are confirmed and implemented.
Minimum criteria for a complete report
A report is considered methodologically complete if it contains:
- the analysis period and the company / fleet;
- the number of monitored nodes, fleet coverage, data quality;
- measured gas volume, CO₂ from combustion, energy delivered;
- the hot-spot list with
loss_classandabatement_eligibilityclassification; - the
AEFcoefficient for each hot spot; - the confidence framework;
- separation of detected losses from the scenario reserve;
- the CH₄ calculation, the CO2e calculation (GWP₁₀₀ and/or GWP₂₀);
- gas price, carbon price, financial valuation;
- CAPEX, OPEX, payback;
- All Fleet and Quick-wins scenarios;
- the reduction-verification process;
- regulatory alignment;
- the methodology and audit trail, raw-data export;
- a disclaimer about calculated values, the carbon upside and the AI commentary.
Audit trail and raw-data export
What the audit trail must contain
| Block | Contents |
|---|---|
| period | start and end dates |
| company | organization / fleet |
| form parameters | CH₄ fraction, GWP, prices, CAPEX/OPEX |
| coefficients | EF_CO2, HHV, GWP, density |
| data sources | volume archives, hourly data, settings |
| data quality | coverage, no data, fallback archive |
| hot-spot method | candidate-search rules |
| confidence framework | High / Medium / Low / Not claimable |
| export | CSV/JSON for verification |
| methodology version | calculation version |
| generation date | report timestamp |
Raw-data export — per hot spot
| Field | Purpose |
|---|---|
station_id | node identifier |
customer | customer |
detected_issue | type of identified sign |
estimated_m3 | calculated gas potential |
confidence | confidence level |
loss_class | classification |
AEF | eligibility coefficient |
CO2e_100 | tCO₂e per GWP₁₀₀ |
CO2e_20 | tCO₂e per GWP₂₀ |
gas_value | monetary valuation of the gas |
carbon_value | potential carbon value |
verification_status | verification status |
methodology_params | calculation parameters |
Calculation lineage
For each headline KPI the methodology section states the data source and the exact formula, so an auditor can reproduce any number step by step.
| KPI | Formula |
|---|---|
| Gas monitored (m³) | Σ V_standard (per-node, PT-corrected per ISO 6976) |
| Data quality (%) | valid_hours / expected_hours · 100% |
| Detected loss candidates (m³) | Σ (node_composite_score / 100 × annual_volume × 0.05) for composite ≥ 60 |
| Screened methane (m³) | Σ (leak_m3 × aef_screened) + (total_measured × 0.5%) |
| Claimable methane (m³) | Σ (leak_m3 × aef_claimable) = 0 until field verification |
| CH₄ mass (t) | V_methane × CH₄_density (0.668 kg/m³) ÷ 1000 |
| CO2e (tCO₂e) | CH₄_mass × GWP_horizon (GWP₁₀₀=29.8, GWP₂₀=82.5) |
| Gas savings (USD/y) | loss_m3 × gas_price_usd_per_m3 |
| Carbon upside (USD/y) | tCO₂e_screened × carbon_price_usd_per_t (scenario-only) |
| Payback (months) | CAPEX_total / (annual_value − OPEX_total) × 12 (carbon included only if it enters ROI) |
The calculation lineage satisfies the methodology-disclosure requirement of ESRS E1 (CSRD) and ISO 14064-1:2018. A carbon trader or ESG consultant can immediately see which numbers are backed by measurements, which are scenario-only, and which are zero placeholders until field verification.
Summary formula of the report
Recommended disclaimer
The report assesses the decarbonization and financial potential of gas
telemetry based on measured volumes, data quality and identified hot
spots. All values marked "calculated" are calculated potential and
require field verification. A confirmed reduction appears only after
repair, a control measurement, a post-action period and verification.
Carbon value is an additional scenario and is not treated as confirmed
income until verified reductions are sold.
Related topics
Was this page helpful?
Thanks for your feedback!