Long Sessions
Fleet nodes whose communication sessions run abnormally long relative to their own norm, with per-node IQR thresholds, a severity score and incident-based root-cause analysis.
The Long Sessions report analyses telemetry communication sessions across the entire fleet of metering nodes and identifies devices, locations, days and corrector types where communications work unstably or take excessive time to transmit data.
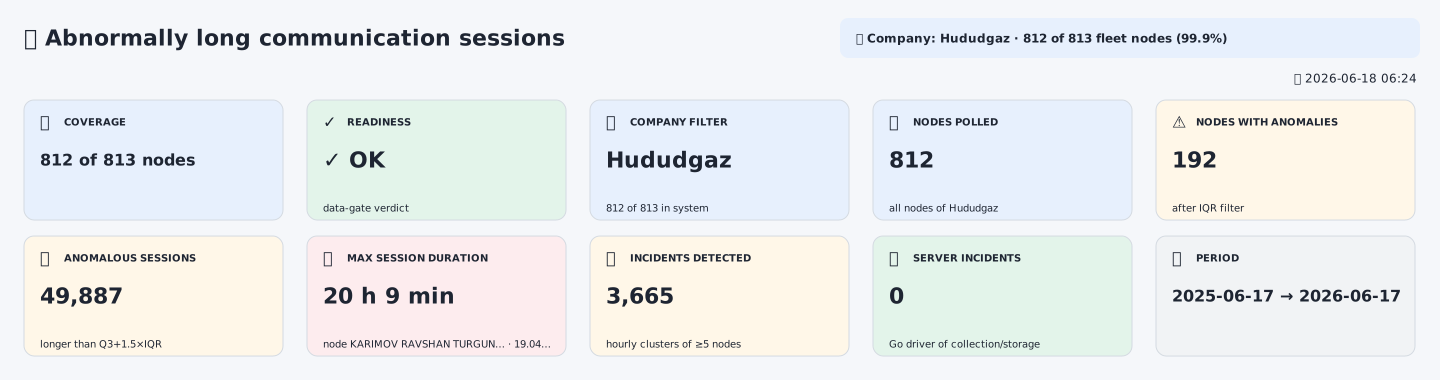
The report header carries seven KPIs: company, fleet coverage, data readiness, number of nodes with anomalies, number of anomalous sessions, maximum session duration, total number of hourly incidents and the analysis period. The headline number is the count of nodes with anomalies out of the fleet total; incidents are hourly clusters where five or more nodes have long sessions simultaneously.
The report answers practical operational questions:
- which nodes have communication sessions that are too long;
- which sessions are considered anomalous for this specific node;
- where the problem is local: antenna, SIM card, power supply, modem, installation site;
- where the problem looks like a base station or mobile network operator incident;
- whether there are mass hourly incidents across the fleet;
- which days were the most problematic;
- which corrector types more often fall into long sessions;
- how much energy was approximately spent on retransmissions or extended transmissions;
- which nodes require a field visit with an external antenna, repeater or SIM check;
- where the mobile network operator or the quality of coverage at a specific location should be checked.
Where the report fits
The report belongs to the operational diagnostics of telemetry. It must not mix two different situations:
- No communication at all. The node does not connect, there are no data.
- Communication exists, but sessions are too long. The node transmits data but does it slowly, unstably or with retries.
This report analyses the second situation. Where there is no communication, archive or data at all, use the Top Problem Nodes report; where you need to check whether a single node’s data are suitable for metering, use Consumption Analytics.
Who the report is for
| Role | What they get from the report |
|---|---|
| Operations manager | overall picture of the fleet, number of nodes with anomalies, mass incidents |
| Communications engineer | list of nodes with bad RSSI, long sessions and local problems |
| Dispatcher | prioritised list of tickets and problem days |
| Field crew | top nodes for antenna, SIM, power and installation-site checks |
| Integration engineer | data-readiness diagnostics, API coverage and cases of missing session data |
| Procurement specialist | comparative breakdown by corrector type |
| Fleet analyst | root-cause hypotheses: base station, carrier, firmware, local node |
What the report does not do
The report must not:
- prove a specific modem is faulty without a field visit;
- treat a long session as direct proof of a bad device;
- automatically blame the server or the mobile network operator;
- mix “no data” with “no anomalies”;
- compare the session duration of all nodes by a single common threshold;
- treat a short period with few sessions as statistically reliable;
- draw conclusions about a device model’s quality without accounting for the number of devices in the sample;
- replace a radio-technical survey of the installation site;
- treat the battery-loss estimate as a precise measurement;
- use the AI commentary as a source of diagnostics.
Key terms
| Term | Meaning |
|---|---|
| Communication session | one episode of the device connecting to the data transmission system |
| Session duration | time from session start to completion |
| Normal session | a session whose duration falls within the node’s individual norm |
| Long session | a session whose duration exceeds the node’s individual IQR threshold |
IQR | interquartile range: Q3 − Q1 |
Q1 | first quartile of session durations |
Q3 | third quartile of session durations |
UpperFence | upper bound of the norm: Q3 + 1.5 × IQR |
RSSI | radio signal level, dBm |
CSQ | GSM signal quality index, can be converted to dBm |
Btm | battery voltage or device power-supply indicator |
Long share | share of long sessions among all of a node’s sessions |
Severity score | final assessment of a node’s problem level by long sessions |
| Incident | hourly cluster where long sessions appeared simultaneously at several nodes |
RCA | probable cause analysis: base station, network, server, firmware, local node |
Battery loss | approximate estimate of the energy spent on excess transmission duration |
General report logic
The report is built as a fleet-wide communication-session analysis.
List of fleet nodes
→ retrieve communication sessions
→ check data readiness
→ individual session norm for each node
→ search for long sessions via IQR
→ compute score for each node
→ group long sessions into hourly incidents
→ determine probable RCA cause
→ distribute hypotheses across nodes
→ top problem nodes
→ breakdown by corrector type
→ breakdown by days and months
→ recommendations for operations
The main principle:
a long session is defined relative to the norm of a specific node,
not relative to a common fixed threshold across the entire fleet.
This matters because different devices, regions, mobile network operators and polling modes can have different normal session durations.
Run parameters
| Parameter | Meaning |
|---|---|
| From date / To date | analysis window boundaries |
| Analysis window, days | fallback window used when dates are empty (default 30) |
| Nodes per corrector type | sample size per type; 0 means all fleet nodes |
| Minimum sessions per node for IQR | the minimum number of sessions a node needs to qualify (default 30) |
| Number of problem nodes in the report | size of the top-N table (default 50) |
| LLM analysis | optional AI narrative explaining the results |
| Utility company | restricts the analysis to one supplier’s fleet |
Input data
Main data
| Data | What it is needed for |
|---|---|
| List of nodes | determine the analysis fleet |
| Corrector type | build the breakdown by model |
Equipment ID | retrieve sessions of a specific device |
| Communication sessions | core of the report |
| Session start time | grouping by days, months and hours |
| Session duration | the main analysed indicator |
RSSI / CSQ | radio signal quality estimate |
Btm / battery | power-supply influence estimate |
| Organization / location | incident attribution: local customer, base station, fleet |
Minimum required set
For correct analysis of a node, the following are needed:
- device identifier;
- at least the minimum number of sessions;
- duration of each session;
- timestamp of each session.
If session duration is missing, that session does not participate in the IQR analysis.
Data readiness: the data gate
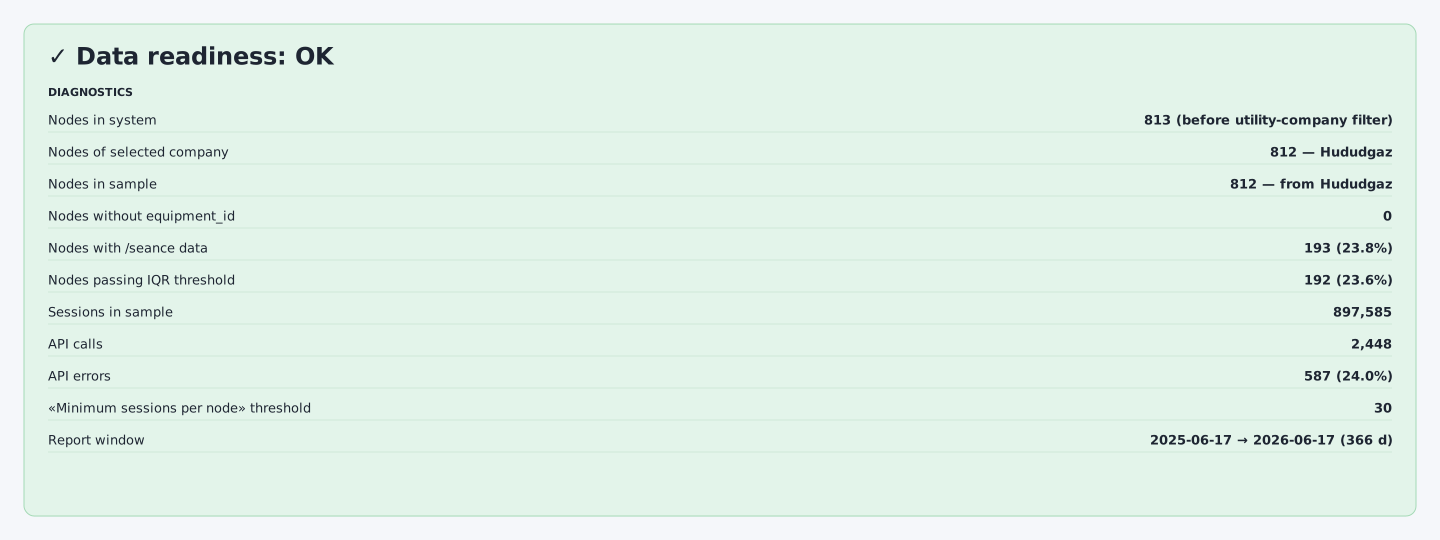
Before computing anomalies, the report checks whether analysis can be performed at all. The data-readiness block shows the fleet size, the size after the company filter, how many nodes returned session data, and how many of those passed the minimum sessions for IQR. This is a critically important diagnostic — without it, “no anomalies” is easily confused with “no data for analysis”.
Main readiness indicators
| Indicator | Formula / value |
|---|---|
| Nodes in the fleet | N_park |
| Nodes in the sample | N_sampled |
| Nodes with session data | N_with_data |
| Nodes that passed the session minimum | N_qualified |
| Total sessions | N_sessions |
| API calls | N_calls |
| API errors | N_errors |
| API error rate | N_errors / N_calls × 100% |
| Data coverage | N_with_data / N_sampled × 100% |
| IQR sample coverage | N_qualified / N_sampled × 100% |
API error rate
Data coverage
Coverage by nodes suitable for IQR
Readiness statuses
| Status | Condition | What it means |
|---|---|---|
OK | sufficient sample for IQR exists | the report can be read as a working one |
DEGRADED | sample is small but analysis is possible | conclusions are cautious |
INCONCLUSIVE | many errors or critically low coverage | anomaly conclusions are unreliable |
NO_DATA | no session data | analysis is impossible |
NO_FLEET | no nodes after filtering | nothing to analyse |
Critical conditions
Analysis is considered impossible if:
or:
or:
Minimum sessions per node
For a reliable IQR analysis, each node must have a sufficient number of sessions.
Minimum threshold
By default:
If a node has fewer sessions, the individual norm is considered statistically unreliable and the node does not pass the IQR filter.
Why a minimum is needed
IQR uses quartile estimates. With a small number of observations, the quartile becomes unstable:
- one random long session can overstate the threshold;
- one short communication period can understate the threshold;
- it becomes impossible to distinguish the node’s norm from randomness.
Individual session-duration norm
Why the norm is individual
You cannot use a single common threshold for the entire fleet, e.g. “all sessions longer than 10 minutes are bad”. Different nodes have different communication conditions:
- different corrector types;
- different mobile network operators;
- different RSSI;
- different archive volumes;
- different polling schedules;
- different installation sites;
- different antennas.
Therefore, each node has its own statistical norm calculated.
Selection of valid durations
For each node, only positive durations are taken:
where:
d_i— duration of the i-th session in seconds.
Quartiles
Durations are sorted in ascending order.
First quartile:
Median:
Third quartile:
Interquartile range
Tukey-fence upper bound of the norm
For each node, an individual upper bound of the norm is computed:
This is the classical Tukey-fences rule for outlier detection.
Long session
A session is considered abnormally long if:
where:
d_i— session duration;UpperFence— the individual threshold of this node.
Basic node indicators
For each node, the following indicators are calculated.
Total number of sessions
Number of long sessions
Share of long sessions
Average duration of all sessions
Average duration of long sessions
Maximum duration
Average RSSI
where N_RSSI is the number of sessions with an available RSSI value.
Node problem score
Meaning of the score
The score shows how problematic a node is in terms of long sessions. It takes into account three dimensions:
- share of long sessions;
- how much long sessions exceed the norm;
- absolute number of long sessions.
This approach avoids overestimating a one-off outlier and avoids underestimating a node with a large number of moderately long sessions.
Component A — share of long sessions
Interpretation:
| Share of long | A |
|---|---|
| 5% | 20 |
| 10% | 40 |
| 25% | 100 |
| >25% | 100 |
Component B — relative duration
where MedianDuration is the median session duration of the node.
Interpretation:
| AvgLong / Median | B |
|---|---|
| 2× | 16 |
| 5× | 40 |
| 10× | 80 |
| 12.5× | 100 |
Component C — number of long sessions
That is, 100 or more long sessions give the maximum contribution from this component.
Final score
where:
A— share of long sessions;B— relative duration of long sessions;C— absolute number of long sessions.
The final score is bounded by the range:
Score interpretation
| Score | Level |
|---|---|
| ≥ 80 | critical communication node |
| 60–80 | high priority |
| 40–60 | medium priority |
| 20–40 | observation / scheduled check |
| < 20 | weak signal |
Battery-loss estimate on long sessions
Meaning
A long session increases transmission time and may additionally consume battery. The report gives an approximate estimate of the excess energy expenditure. This is not a precise battery measurement but an operational estimate.
Excess transmission time
For each long session, the excess over the node’s median norm is calculated:
Total excess time:
Transmission current
A base transmission current is used for the approximate estimate:
Battery loss
where:
ExtraTime_total— in seconds;I_TX— current in milliamperes;- result — in mAh.
For display in Ah:
Limitation
This estimate does not take into account:
- the actual current profile of the specific model;
- sleep mode;
- retries at the modem level;
- transmitter power;
- temperature;
- battery age;
- battery capacity;
- network quality at the moment of transmission.
It should therefore be read as an order-of-magnitude estimate, not a laboratory measurement.
RSSI and CSQ
RSSI
RSSI shows the radio signal level in dBm. The closer the value is to zero, the stronger the signal.
Approximate interpretation:
| RSSI | Rating |
|---|---|
| ≥ −65 dBm | good signal |
| −65…−75 dBm | acceptable |
| −75…−85 dBm | weak |
| < −85 dBm | very weak |
CSQ
Some devices transmit not RSSI in dBm but CSQ — the GSM signal quality index. If the value looks like CSQ, it can be converted:
Example:
Locally weak signal
If:
and the node’s anomalies do not coincide with mass fleet incidents, the cause can be classified as:
weak signal at the installation siteGrouping long sessions into incidents
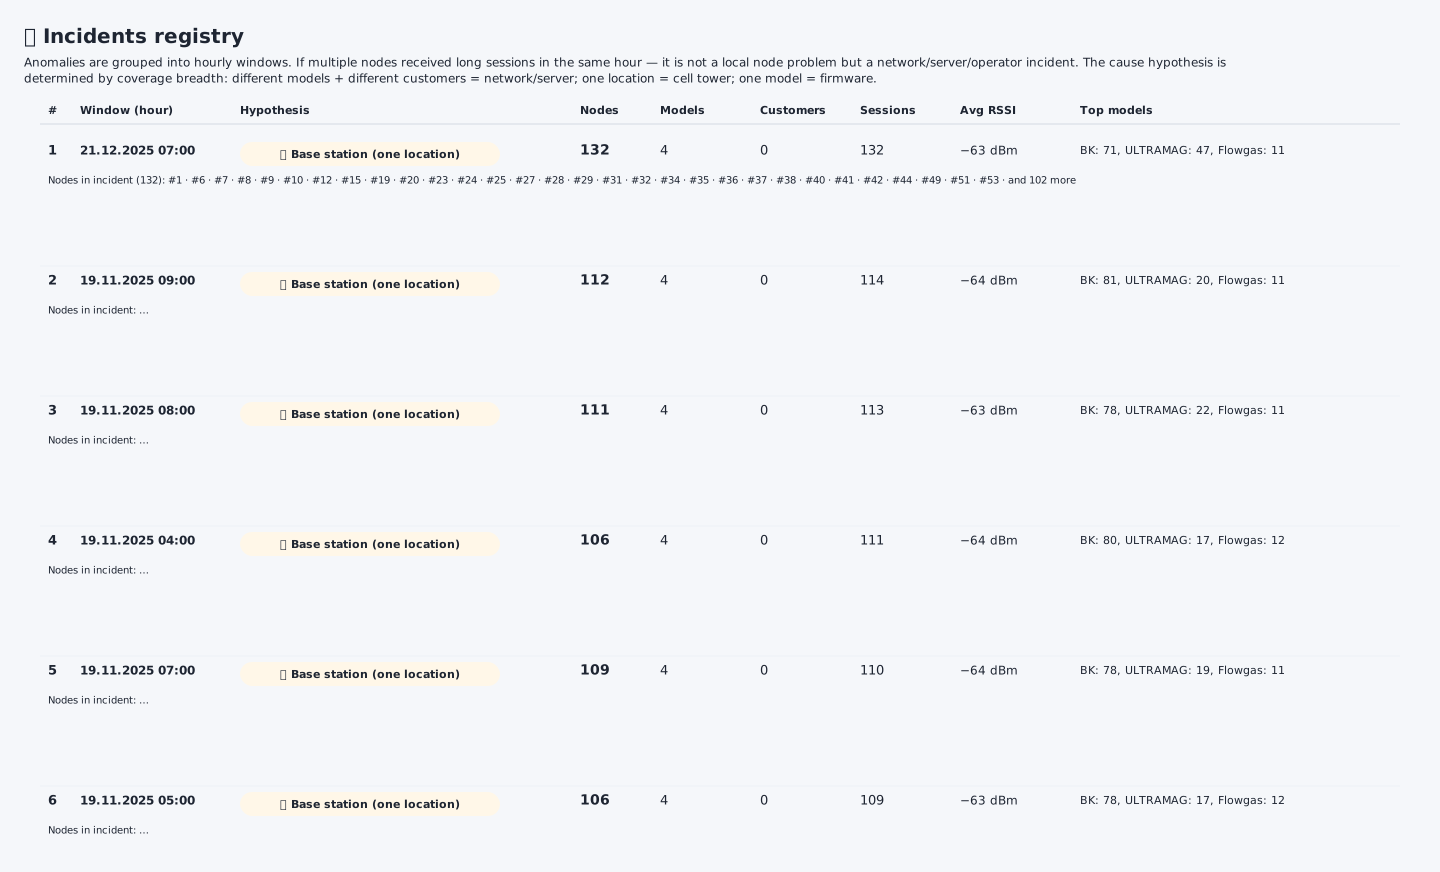
Anomalies are grouped into hourly windows. If several nodes received long sessions in the same hour, this is not a local node problem but a network, server or operator incident. The hypothesis is determined automatically by the breadth of coverage — the number of nodes, models and customers in the window.
Why grouping is needed
If long sessions appeared at many nodes in the same hour, it is most likely not a local problem of one device. It could be:
- a base station problem;
- local carrier overload;
- a mass network incident;
- a scheduled server operation;
- a peculiarity of a specific model’s firmware.
Hourly bucket
Each long session is placed into an hourly bucket:
That is, all events within one hour fall into one bucket.
Incident
An hourly bucket is considered an incident if at least:
nodes are affected.
Incident indicators
For each incident, the following are calculated:
| Indicator | Formula |
|---|---|
| number of nodes | count(unique station_id) |
| number of models | count(unique equipment_type) |
| number of customers / locations | count(unique customer_id) |
| number of sessions | count(long sessions in bucket) |
| average RSSI | average(RSSI) |
| top models | top equipment types by count |
RCA: incident-cause attribution
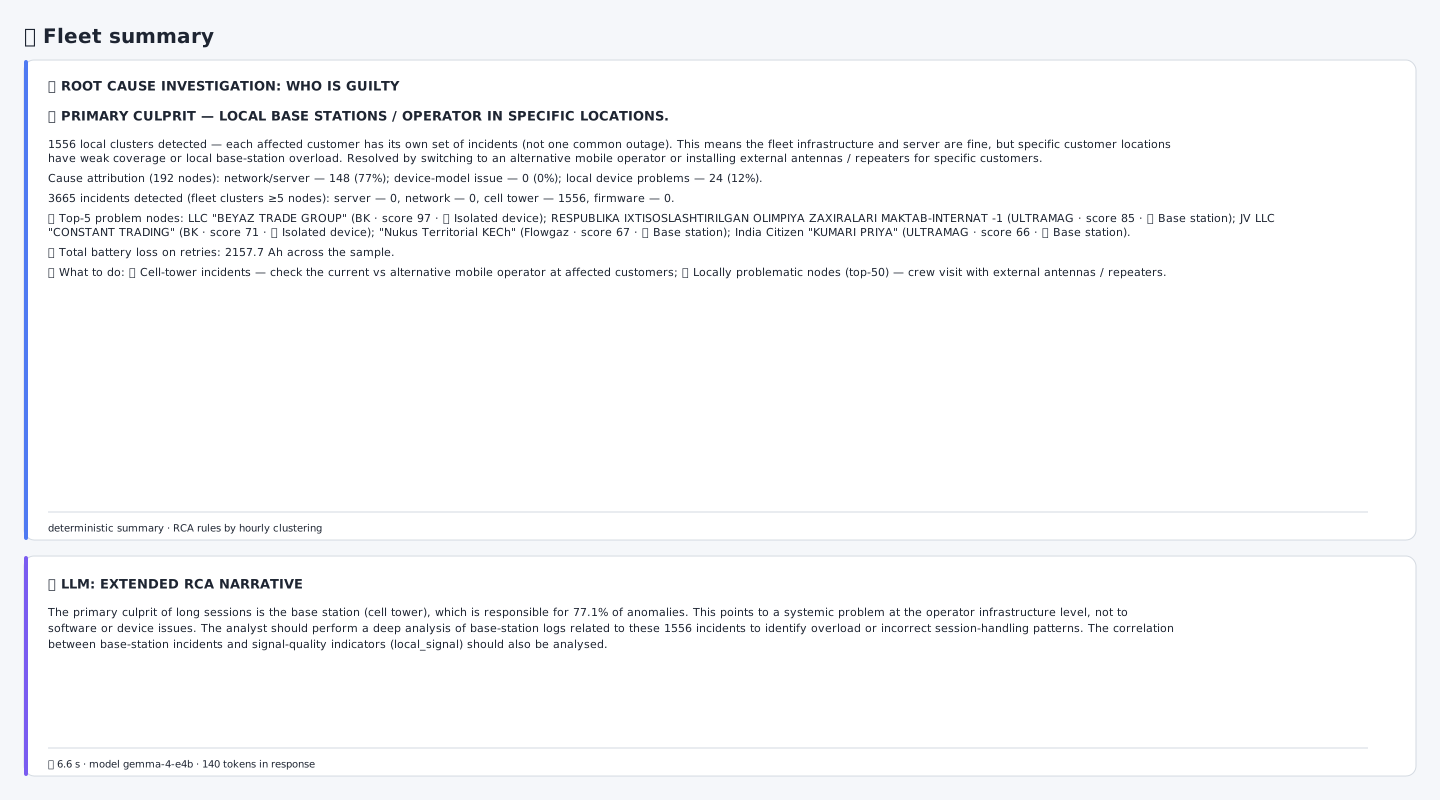
The fleet summary identifies the main culprit — cell tower, server, network, firmware or local node — provides a blame attribution across the nodes with anomalies and forms an action plan. An optional AI narrative at the bottom explains the numbers in plain language but does not change them.
RCA is the classification of the probable cause of long sessions.
Possible hypotheses
| Hypothesis | Meaning |
|---|---|
Server driver | mass collection driver failure |
Server routine | regular server operation or maintenance |
Network outage | mobile network operator failure |
Cell tower | problem with a specific base station or location |
Firmware | device model / firmware problem |
Local signal | weak signal at the installation site |
Battery low | low power / battery degradation |
Isolated device | local malfunction of a specific node |
Mixed causes | mixed causes |
Wide server incident
An incident is classified as a server one if many nodes, many models and many customers are affected simultaneously. Conditionally:
In the report, this means:
wide fleet incident, not similar to a local single-node problem.Carrier network outage
If several models and several customers are affected, but the scale does not reach a server failure:
and:
then the hypothesis is:
mobile network failure / operator incidentBase station problem
If many nodes are affected, but they belong to one or two locations / customers:
and:
then the hypothesis is:
base station problem or local coverage problemFirmware or model problem
If one model is affected, but across different customers:
and:
then the hypothesis is:
firmware / device model peculiarityMixed causes
If the conditions do not yield an unambiguous classification, the incident receives the status:
mixed causesRecurring server routine
Sometimes mass server incidents happen at the same hour of the day.
Condition
If there are at least three server-wide incidents at the same hour of the day:
they can be classified as:
server routineMeaning
This may indicate a regular nightly job, archive maintenance, a batch process or a mass operation that affects session duration.
Cause attribution per node
After searching for fleet incidents, the report determines what dominates at each node: external incidents or a local problem.
Share of a node’s anomalies that fall into fleet incidents
If most anomalies coincided with fleet incidents
If:
then the node’s dominant cause is taken from the fleet incident:
network_outage / cell_tower / firmware / serverThis means:
the device is probably not the main culprit; it suffered together with others.Low battery check
If the anomalies are not explained by fleet incidents, the power supply is checked. Let:
be the first available battery value in the long sessions, and:
be the last available value. The drop:
The battery_low hypothesis is possible if:
and:
Locally weak signal check
If:
then the hypothesis is:
weak signal at the installation siteIsolated node malfunction
If:
- the anomalies do not coincide with fleet incidents;
- the battery does not explain the picture;
- the RSSI is not critically weak;
then the cause is classified as:
local malfunction of the nodeHypothesis distribution across the fleet
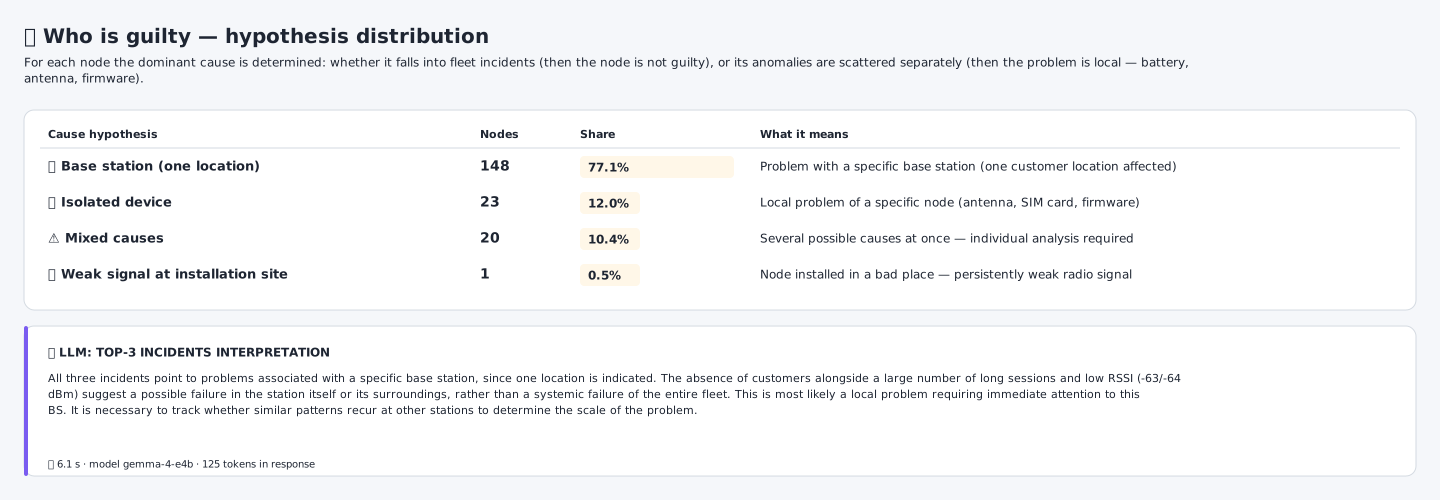
For each node, the dominant cause is selected. When most nodes suffered from fleet incidents, the node itself is not to blame; only a minority have an isolated local problem. This changes the action plan: the main effort goes to base stations and the carrier, not to a mass field visit to every node with anomalies.
The report shows how many nodes are attributed to each dominant cause.
Hypothesis-share formula
Cause groups
For the management summary, the hypotheses can be grouped:
| Group | Includes |
|---|---|
| network / server | server_driver, server_routine, network_outage, cell_tower |
| local device problems | isolated_device, local_signal, battery_low |
| model / firmware | firmware |
| mixed | mixed |
Interpretation
| Dominates | What to do |
|---|---|
Cell tower | check coverage, the carrier, external antennas at affected customers |
Local signal | field visit to the specific node, antenna, repeater, installation site |
Isolated device | modem, SIM, power, firmware diagnostics |
Firmware | check the software version and contact the supplier |
Server routine | check regular platform processes |
Network outage | query the mobile network operator by time and zone |
Top problem nodes
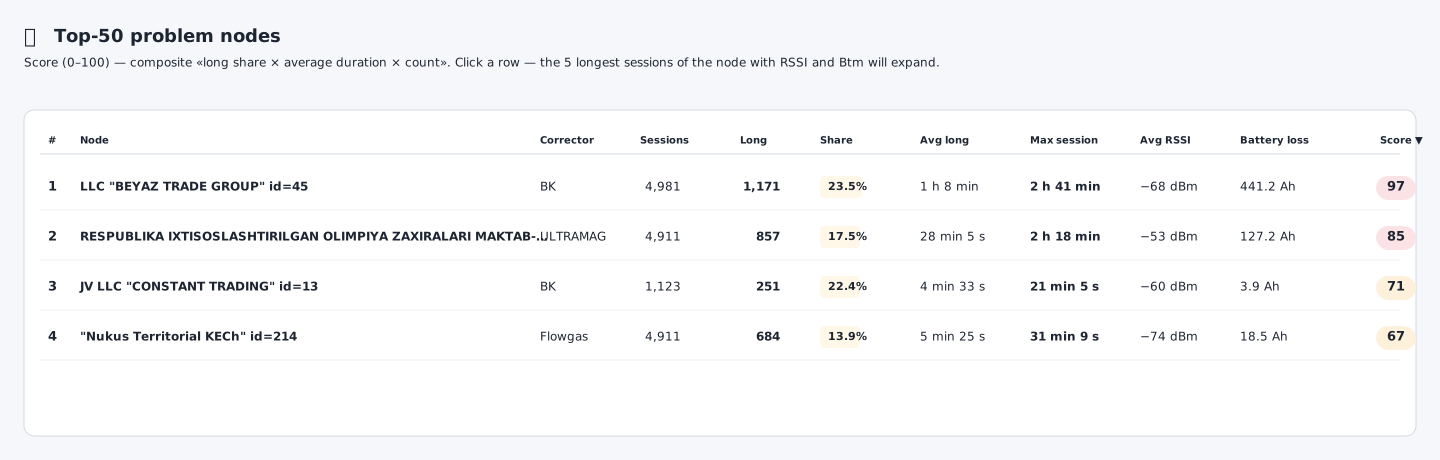
The top problem nodes table ranks nodes by a composite score (0–100) built from the share of long sessions, their average duration and their count. Clicking a row expands the node’s longest sessions with RSSI and Btm values — used for planning a field visit.
Purpose
The table shows where to go or what to check first.
Table columns
| Column | Meaning |
|---|---|
| Node | name and ID of the node |
| Corrector | device type |
| Sessions | total number of valid sessions |
| Long | number of abnormally long sessions |
| Share | percentage of long sessions |
| Average long | average duration of long sessions |
| Maximum session | worst session found |
RSSI average | radio signal quality |
| Battery loss | estimated excess energy |
| Score | composite problem score |
How to read the top
A high score can arise for different reasons:
- a large share of long sessions;
- very long individual sessions;
- a large absolute number of long sessions;
- a combination of these factors.
For planning a field visit, read not only the score but also:
RSSI;- the RCA hypothesis;
- battery loss;
- maximum session;
- whether it falls into fleet incidents;
- corrector type.
Top problem days
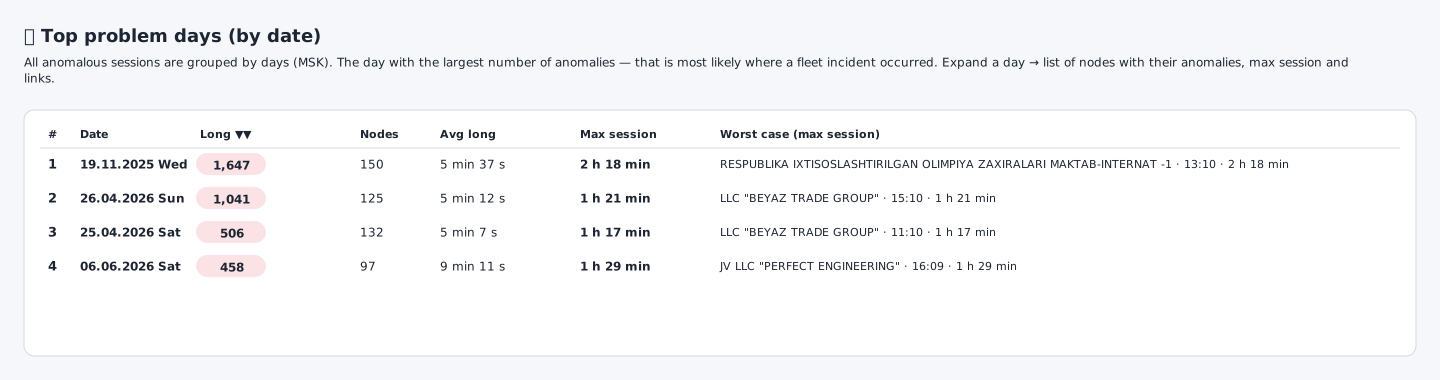
All anomalous sessions are grouped by calendar day. The day with the largest number of anomalies is most likely where a fleet incident occurred. Each day expands into the list of nodes with their anomalies, the maximum session and links. This is useful for investigating mass events and checking recurrence.
Purpose
The breakdown by days shows the days when long sessions appeared en masse across the fleet.
Day indicators
| Indicator | Meaning |
|---|---|
| Date | calendar day |
| Long sessions | number of long sessions for the day |
| Nodes | how many nodes are affected |
| Average long | average duration of long sessions |
| Maximum session | worst case of the day |
| Worst node | node with the maximum session |
Interpretation
| Picture | Possible cause |
|---|---|
| many nodes on a single day | network or fleet incident |
| one node every day | local problem |
| a spike on a weekend | carrier network / maintenance work |
| spikes at the same time | regular task or schedule |
| monthly growth | network degradation, seasonal overload, polling-mode change |
Breakdown by corrector type
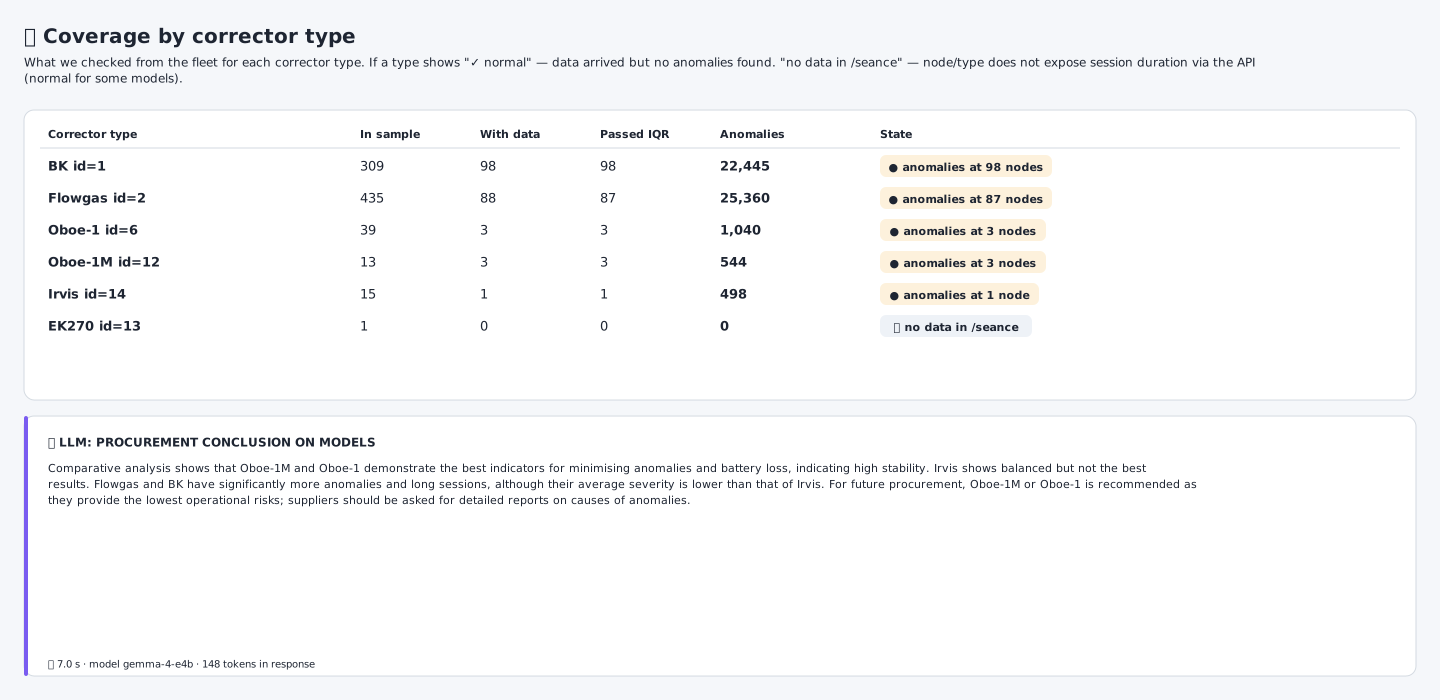
The coverage block shows what was checked from the fleet for each corrector type: how many nodes are in the sample, how many returned data, how many passed IQR and how many show anomalies. If a type shows “norm”, data arrived but no anomalies were found. “No data” means the type does not return session duration in the API — for some models this is normal.
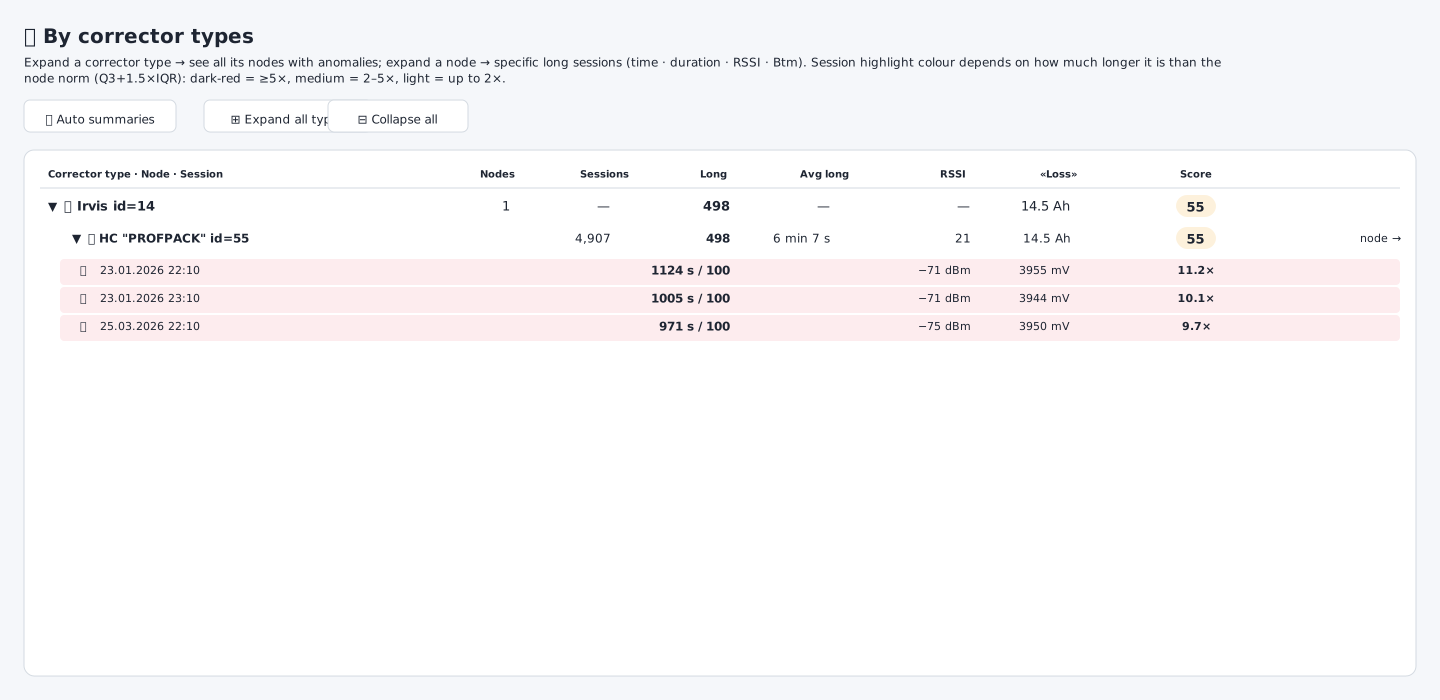
Expand a type to see all its nodes with anomalies; expand a node to see its specific long sessions with time, duration, RSSI and Btm. The session highlight colour depends on how much longer the session is than the node’s norm.
Purpose
The breakdown by corrector type shows which models more often fall into abnormally long sessions.
Indicators by type
| Indicator | Meaning |
|---|---|
| In sample | how many nodes of this type are in the fleet |
| With data | how many nodes returned session data |
| Passed IQR | how many nodes have the minimum sessions |
| Anomalies | number of long sessions |
| State | norm / anomalies / no data |
Important limitation
You cannot directly compare corrector types by the number of anomalies alone. You must take into account:
- how many devices of this type are in the fleet;
- how many of them returned data;
- how many passed the session minimum;
- where they are installed;
- which networks they operate in;
- whether they have the same polling schedule;
- whether they are concentrated at a single customer.
Normalised anomaly share by type
For correct comparison, you can use:
or:
Breakdown by time: dynamics and months

The daily dynamics chart shows how many anomalous sessions occurred across the fleet on each day of the window. “Flares” are visible — days of bad communication across the entire network. A peak that coincides with the incidents registry is typically a series of base station problems at a single location.
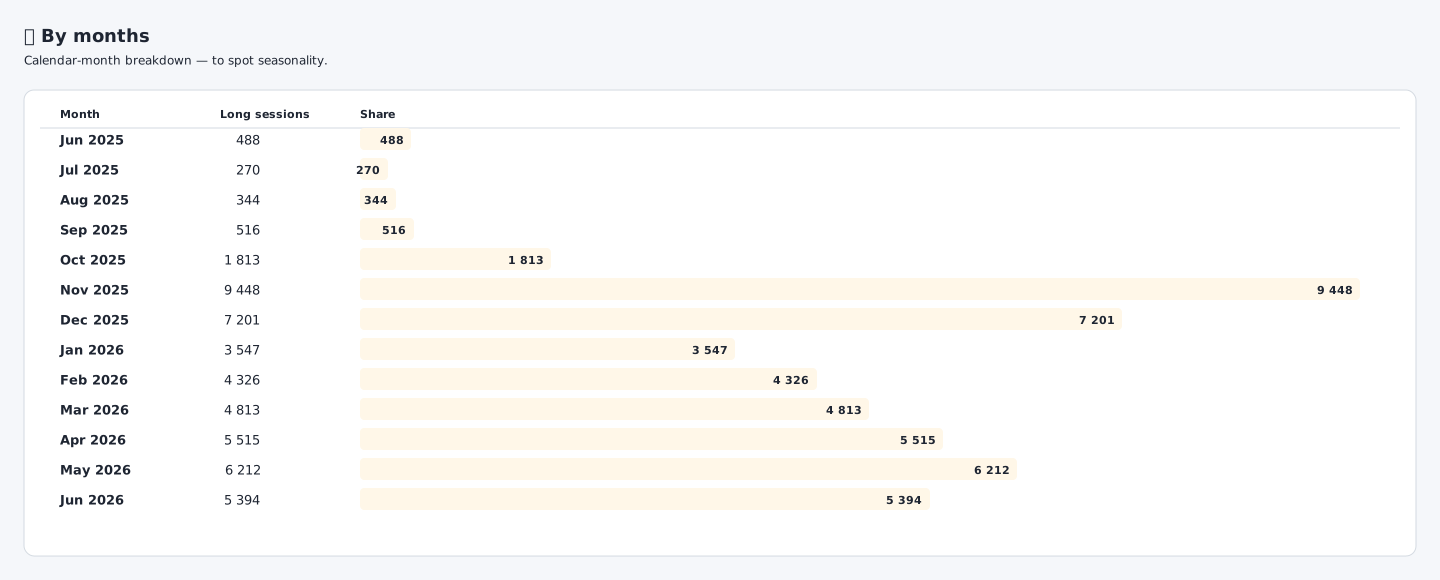
The breakdown by calendar months helps to see seasonality or a long-term trend. A mass monthly peak corresponds to the same series of incidents seen in the daily dynamics; gradual growth over time is a candidate for communication or battery degradation.
Purpose
The breakdown by months shows seasonality or a long-term trend of long sessions.
Month indicator
Month share
If you need to show a share:
Interpretation
| Picture | Possible explanation |
|---|---|
| sharp monthly spike | network change, mass failure, seasonal load |
| gradual growth | communication or battery degradation |
| winter spike | weather conditions, network load, power |
| spike after an update | firmware, settings, polling schedule |
Per-session colour highlighting

When a node is expanded, its individual long sessions are highlighted by the strength of overshoot of the individual threshold, and the precise RSSI and Btm values at the moment of each long session are shown. These are what the field crew needs: a low RSSI points to a radio-signal problem, while a normal battery voltage rules the battery out.
Overshoot ratio
Interpretation
| Ratio | Colour / level |
|---|---|
| 1–2× | weak overshoot |
| 2–5× | medium overshoot |
| ≥5× | strong overshoot |
This helps to quickly distinguish moderately long sessions from extreme ones.
What to do based on the report results
If the cause is a base station
Check:
- coverage quality at the location;
- an alternative mobile network operator;
- an external antenna;
- a repeater;
- recurrence of incidents by day;
- neighbouring nodes at the same location;
- network overload at specific hours.
If the cause is a local node
Check:
- antenna;
- SIM card;
- modem;
- power supply;
- battery;
- connectors;
- installation site;
- interference;
- firmware version;
- transmission-schedule settings.
If the cause is a weak signal
Actions:
- measure RSSI on-site;
- try to relocate the antenna;
- check antenna orientation;
- check an alternative carrier;
- install an external antenna or repeater.
If the cause is the battery
Actions:
- check
Btmon-site; - replace the battery if necessary;
- check the consumption current;
- check the retry frequency;
- check whether the device is overloading the network with retries.
If the cause is the model / firmware
Actions:
- group nodes by software version;
- check the supplier’s release notes;
- request known issues;
- compare with other models at the same locations;
- test the communication mode in a lab.
AI commentary

The optional AI commentary reads the RCA and writes a short, human-readable field-visit plan for the crew. This is a language explanation, not a source of diagnostics — all numbers and causes are determined by the formulas and rules above.
What AI can do
- briefly retell the RCA;
- explain the main probable culprit;
- highlight top nodes;
- formulate a field-visit plan;
- explain the breakdown by models.
What AI cannot do
AI cannot:
- change the IQR threshold;
- change the list of long sessions;
- change the score;
- determine the true cause without data;
- replace a radio-technical survey;
- replace a field visit;
- serve as an evidentiary basis.
Typical interpretation errors
Error: long session = bad device
Incorrect. A long session can be caused by the network, base station, weak signal, server routine, local antenna, SIM card or battery.
Error: many anomalies for a model = the model is bad
Incorrect. You must normalise by the number of devices, number of sessions, locations and mobile network operators.
Error: no anomalies = everything is fine
Incorrect if there are no session data or coverage is too low.
Error: high RSSI rules out a communication problem
Not always. There can be operator problems, overload, firmware, server-side reception, retries or protocol errors.
Error: battery loss = exact battery consumption
Incorrect. This is an estimate built on excess transmission time and a notional current.
Error: one extremely long session makes the node the main problem one
Not always. The score takes into account not only the maximum, but also the share, average duration and number of long sessions.
Minimum criteria for a complete report
A report is considered methodologically complete if it contains:
- analysis period;
- fleet coverage;
- data-gate status;
- number of nodes in the fleet;
- number of polled nodes;
- number of nodes with session data;
- number of nodes that passed the IQR threshold;
- number of sessions in the sample;
- number of long sessions;
- number of nodes with anomalies;
- maximum session duration;
- number of hourly incidents;
- distribution of RCA hypotheses;
- IQR threshold formula;
- node score formula;
- battery-loss formula;
- RCA classification rules;
- top problem nodes table;
- breakdown by days;
- breakdown by corrector type;
- breakdown by months;
- disclaimer on the approximate nature of battery loss;
- disclaimer on the role of AI;
- recommendations for actions.
Consolidated report formula
For each node:
Excess battery-consumption estimate:
Incident grouping:
Recommended disclaimer
The report detects abnormally long communication sessions relative to each
node's individual norm. The result is used for prioritising diagnostics of
communications, antennas, SIM cards, power, carriers and base stations. The
report is not proof of a specific device's malfunction without a field visit and
does not assess the correctness of commercial gas metering.
Relation to other reports
| If you need to understand | Use |
|---|---|
| which nodes hold communication long and drain the battery | this report |
| which nodes have no communication or archive | Top Problem Nodes |
| whether the period can be closed for a specific node | Consumption Analytics |
| whether there is suspicion of undermetering | Suspicious Nodes |
| why a specific node is suspicious | Metering Bypass |
| when to replace batteries | Battery Forecast |
This separation keeps long communication sessions from being mixed with commercial, metrological and forensic conclusions.
Related topics
Was this page helpful?
Thanks for your feedback!