Metering Bypass (node)
Single-node metering-bypass suspicion score (0-100) with patterns, formulas, evidence confidence, legal readiness and a field-visit checklist.
The Metering Bypass report performs a formalised analysis of a single metering node over a selected period, with the goal of detecting signs of possible under-metering, substitution of the measuring channel, incorrect sensor behaviour or other events that require attention from the metering service. It relies on the same standards that govern gas metering: ISO 5167 (orifice plates), ISO 6976 (calorific value), EN 12405-1 (electronic gas-volume conversion), OIML R 137 (gas meters), OIML R 140 (measuring systems for gaseous fuel) and EN 1359 (diaphragm meters).
Report purpose
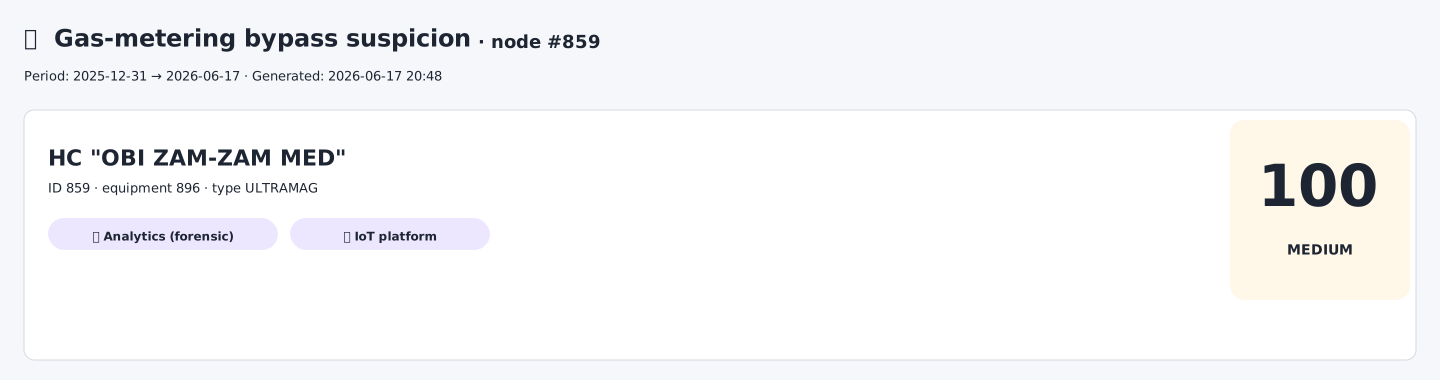
Report header. The first thing the reader sees: the node identifier, the device identifier, the corrector type, the covered period, the generation time, the final suspicion score and its textual severity. The score on its own proves nothing — it is a composite indicator that must always be read together with the six neighbouring indicators (see the investigation summary below).
The report is not a formal statement of violation. It does not establish the fact of theft, does not replace a field inspection and is not a legal opinion. Its job is to describe suspicious patterns mathematically and metrologically, show the confidence of the sources, set the inspection priority and give the field crew a clear list of what to check on site.
The report answers the following questions:
- are there
Q≈0periods in the hourly archive that look atypical; - was the pressure channel
Pstuck at a substitution or near-constant value; - did the temperature
Tchange while the pressure stayed still; - was there a sharp recovery of
QandPafter a zero period; - are there matches with the abnormal-events archive;
- are there direct device signals: physical access, parameter change, reset, clock change;
- how complete are the data sources;
- can the suspicion be considered confirmed;
- is a field visit needed and at what priority;
- what potential scale of unmetered volume requires verification;
- which alternative hypotheses must be ruled out before any conclusion about tampering.
Target audience
| Role | What they get from the report |
|---|---|
| Head of the metering service | overall suspicion level, evidence confidence, legal readiness, field-visit priority |
| Metrologist | check of the Q/P/T channels, the P_const regime, applicability of the physical model, passport gaps |
| Telemetry engineer | link with the sessions archive, completeness of sources, suspicious gaps |
| Field crew | top windows for inspection and the inspection checklist |
| Compliance service | list of suspicious patterns, device events and alternative hypotheses |
| Billing analyst | indicative exposure volume as the scale of the potential blind spot |
| Utility-company lawyer | base for preparing a formal act once hard evidence is confirmed |
What the report must NOT do
The report must not:
- automatically accuse a consumer of metering bypass;
- call the computed exposure a confirmed loss;
- treat zero flow as a violation without checking the operating regime;
- treat a stuck sensor as proof of tampering;
- apply Gay-Lussac’s law without checking its physical applicability;
- treat
P=100 kPaas illegal without the passport and theP_constregime; - raise legal readiness based on an AI comment alone;
- form a conclusion about tampering when the hourly archive is missing;
- replace a field act with an automatic score.
Key terms
| Term | Meaning |
|---|---|
Q | hourly gas flow, m³/h |
P | pressure, kPa |
T | gas temperature, °C |
Q≈0 | flow below the near-zero threshold |
P_default | pressure close to a substitution value: e.g. 100, 101.325, 103, 105 or 0 kPa |
P_stuck | pressure barely changes during the period |
zero-flow run | a continuous period where flow is near zero |
recovery | sharp return of flow and/or pressure after a zero period |
event | a detected window of a suspicious pattern |
severity | strength of the indicator: low / medium / high / high_plus |
pattern score | mathematical suspicion score based on archive patterns (0..100) |
event score | score based on direct or classified device events (0..100) |
final score | overall suspicion score, max(pattern, event) |
evidence confidence | completeness of the evidence base |
legal readiness | readiness for a legally meaningful conclusion |
field priority | field-visit priority P0..P3 |
exposure | estimated potentially unmetered volume, not a proven loss |
hard evidence | direct proof: housing breach, parameter change, archive reset, confirmed device event, formal act |
Overall report logic
The overall logic of the report is built in several layers:
Hourly archive Q/P/T
→ search for zero-flow periods
→ pressure channel P check
→ temperature T check
→ recovery check after a zero window
→ check of additional patterns
→ matching against the device log
→ pattern score computation
→ event score computation
→ severity cap limitation
→ evidence confidence evaluation
→ legal readiness
→ field priority
→ exposure estimate
→ root cause matrix
→ field-visit checklistIt is essential that the report separates:
- statistical pattern in the hourly archive;
- device event in the corrector log;
- source confidence;
- legal readiness;
- field inspection.
Each of the five layers is evaluated independently. A high score on one of them does not raise the readiness for action on another. For example, score=100 with no device events and no field visit may stay partial on legal readiness and P1 on field priority.
Input data
Mandatory data
| Source | Purpose |
|---|---|
Hourly archive Q/P/T | main source for pattern search |
| Analysis period | window bounds |
| Node and device identifiers | linking the result to a specific object |
Without the hourly archive the report can only show absence of data, and must not build a full suspicion conclusion.
Desirable data
| Source | Purpose |
|---|---|
| Communication-sessions archive | check whether the node was online during events |
| Abnormal-events archive | search for hard evidence: housing breach, reset, parameter_change |
| Corrector passport | check legality of P_const, Qmin/Qmax, pulse weight |
| Field inspection | confirmation of seals, pipework layout, actual regime |
| Corrector display photo | record of Q/P/T/V, date, time, regime |
| External-meter readings | reconciliation of the accumulated volume |
Minimum reliable period
A period shorter than 30 days automatically downgrades the evidence-base confidence by one level: high → medium, medium → low. A reasonable minimum is 90 days; the recommended period is 366 days (one year gives seasonality for all patterns).
Evidence map
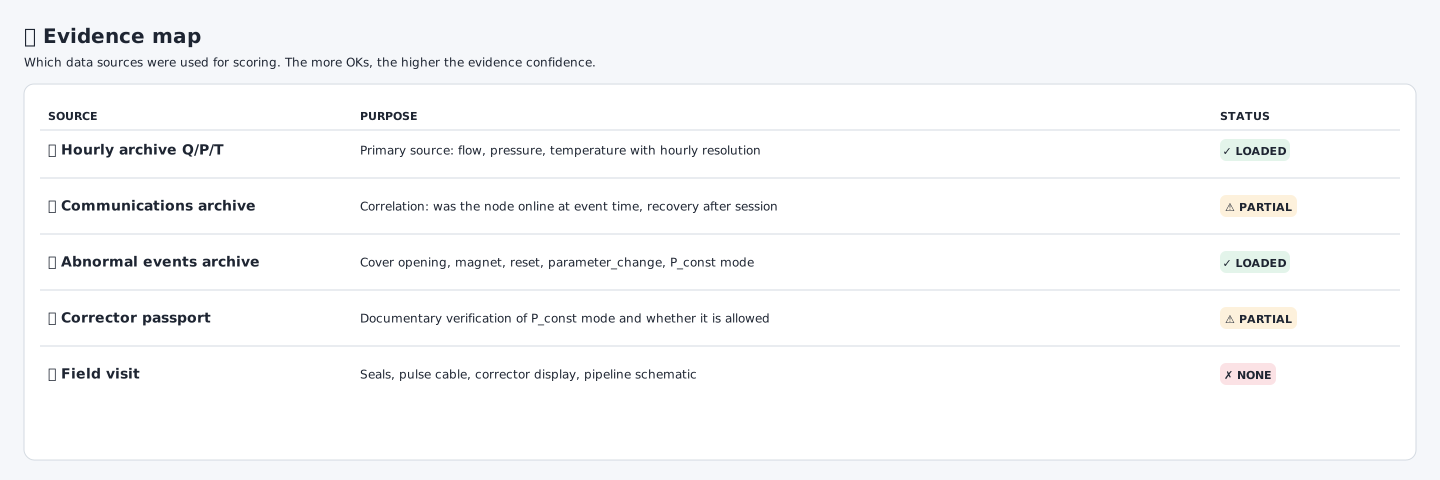
Evidence map. Which data sources were used for scoring and how complete they are. The more green “OK” marks, the higher the confidence in the evidence. Each source has a weight in the evidence-confidence formula, and a partial or missing status lowers the resulting percentage.
| Source | Status | Weight in evidence |
|---|---|---|
| Hourly archive Q/P/T | ok / partial / missing | 3 |
| Communication-sessions archive | ok / partial / missing | 2 |
| Abnormal-events archive | ok / partial / missing | 3 |
| Corrector passport | ok / partial / missing | 1 |
| Field inspection | ok / partial / missing | 3 |
Source confidence formula
Let:
w_i— weight of the source;s_i— source status coefficient.
Statuses:
Then the overall source-confidence percentage is:
Evidence confidence interpretation
| EvidenceSourcePct | Evidence confidence |
|---|---|
| ≥ 70% | high |
| 35–70% | medium |
| < 35% | low |
Zero-flow period
Most signs in the report start with the search for periods where the flow is near zero.
Near-zero threshold
Baseline threshold:
An hour is considered zero if:
Minimum duration
A zero period becomes a candidate for analysis if it lasts at least:
That is:
Q≈0 continuously for 6 hours or moreWhy exactly 6 hours
The 6-hour threshold avoids reacting to short operational pauses, random idle periods or single zero points. For a bypass or substitution pattern, what matters is not isolated zeros but a steady window in which the flow is absent while the other channels behave suspiciously.
Empirically, 6 hours covers most real “night shutdown → morning restart with substitution” patterns without false positives on lunch breaks or short planned stops at industrial sites.
Substitution pressure P_default
One of the key indicators is pressure close to typical substitution values.
Substitution values
| Group | Values |
|---|---|
| Atmospheric / contractual | 100.0, 101.325, 103.0, 105.0 kPa |
| Zero / disconnected sensor | 0.0 kPa |
Tolerance
For atmospheric and contractual values:
For the zero value:
Closeness formula
Pressure is considered close to the substitution value if:
where:
P_mean— average pressure inside the zero window;P_default— one of the substitution values.
Important limitation
P_default is not proof of violation on its own. It may be:
- a legal
P_constregime; - a device setting used when the sensor is absent;
- an emergency fallback value;
- a consequence of sensor disconnection;
- a particular feature of the corrector model.
That is why the passport is required for any conclusion:
Check: is P_const allowed, what value of P_const is set, why it was applied.Stuck pressure channel P_stuck
Standard deviation of pressure
Within the zero window, the standard deviation of pressure is computed:
The pressure channel is considered stuck if:
Temperature change
For the physical check, the temperature in the window must change noticeably:
Condition:
If the temperature barely changed, it is impossible to say with confidence whether P should have changed.
Gay-Lussac law check
Physical formula
For a closed volume of gas with a constant amount of substance:
where:
Given initial values:
Expected pressure change:
Comparison with the actual change
Actual pressure variability is assessed via the standard deviation or the range:
or:
If:
and at the same time:
then the pressure channel is treated as suspiciously stuck.
Divergence coefficient
For the report explanation the following ratio can be used:
where ε is a small constant to guard against division by zero.
If K_GL is large, the report states that the expected pressure change is many times greater than the actual variability.
Important physical limitation
Gay-Lussac’s law is applicable only to a closed volume of gas.
It is not applicable or only partly applicable if:
- the node is connected to the grid;
- the pressure is maintained by a regulator;
- the upstream/downstream is open;
- the pressure is gauge, not absolute;
- the passport specifies a
P_constregime; - the volume is not isolated;
- the pressure sensor rounds or filters values.
Catalogue of detected patterns
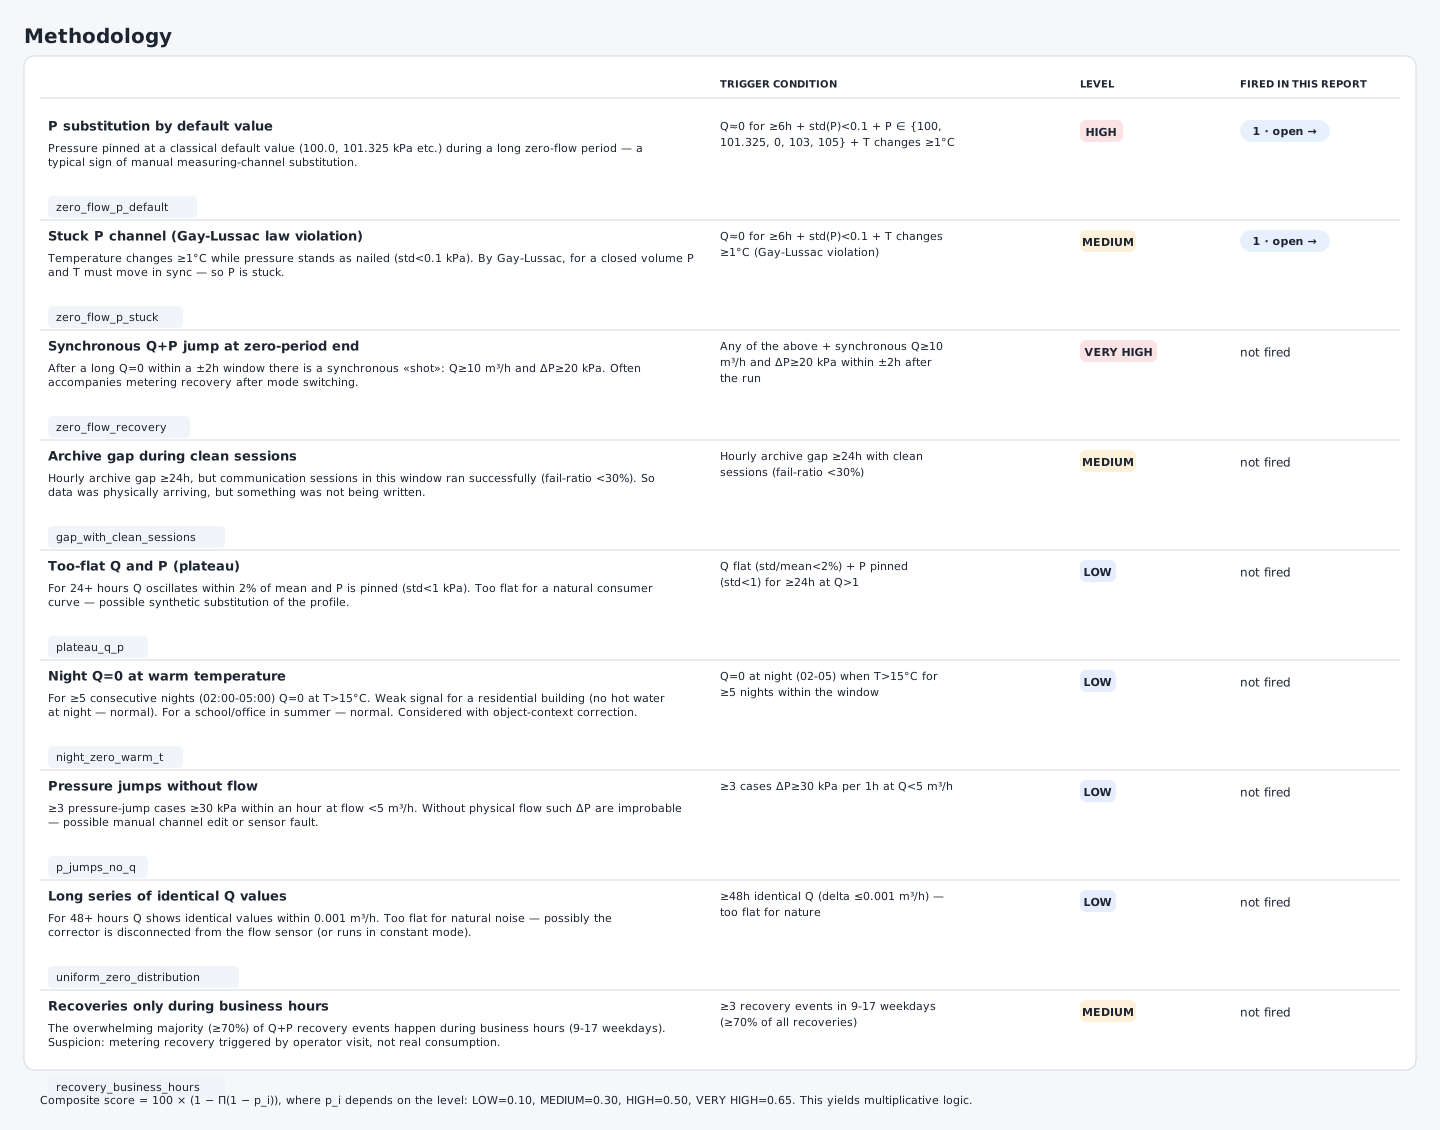
Methodology table. All nine indicators the report can search for, with their formal condition, severity level (low / medium / high / very_high) and a clickable “triggered in this report” mark. The table immediately shows which indicators triggered on the given node, and lets you jump straight to the event card.
Substitution of P with a default value
Formal condition:
and:
and:
and:
Meaning: pressure sits at a typical substitution value during a long zero-flow period. This may indicate substitution of the pressure channel, but may also be a legal P_const regime.
Stuck pressure channel P (Gay-Lussac violation)
Formal condition:
and the Gay-Lussac model shows that the expected pressure change should be noticeable.
Meaning: temperature changes but pressure is almost still. This may indicate a stuck pressure channel, the P_const regime, a grid regulator or substitution of the measuring channel.
Synchronous Q+P jump after a zero period
Formal condition:
There is a zero period:
and after it ends, within a window of:
the following is recorded:
and:
Meaning: after a long zero, both flow and pressure are restored simultaneously. This may indicate that metering has resumed after a regime switch, but may also be a normal technological start-up.
Gap in the archive with successful communication sessions
Formal condition:
There is a gap in the hourly archive:
and in the same window there were successful communication sessions:
Meaning: the node was online, but the hourly archive was not delivered or recorded. This looks more like a delivery, export, parsing or integration issue than a physical bypass of metering.
Too-flat Q and P (plateau)
Formal condition:
The period lasts:
flow is non-zero:
flow is too flat:
pressure is almost stuck:
Meaning: a very flat curve can be normal for some technological processes, but it can also indicate a synthetic or substituted profile.
Night Q=0 at warm temperature
Formal condition:
In night hours:
flow equals zero:
temperature is above the threshold:
and this happens on at least 5 nights.
Meaning: weak indicator. For schools, offices, seasonal sites and residential buildings, zero night-time flow can be the norm.
Pressure jumps without flow
Formal condition:
At least 3 occurrences:
with:
Meaning: strong pressure jumps with no matching flow may point to a sensor fault, a telemetry artefact or a manual channel edit.
Long run of identical Q values
Formal condition:
The flow stays identical for:
within:
Meaning: natural flow normally has noise and variability. Long-running identity may indicate a constant, a transmission error or a disconnected flow sensor.
Recoveries only during business hours
Formal condition:
There are at least 3 recovery events, and the share of recoveries during business hours is:
Business hours:
and the day of the week is a weekday.
Meaning: if metering recovery often happens only during business hours, this may indicate manual maintenance, operator visits or regime actions. But it is not proof of tampering.
Data-quality pre-filters
Before interpreting tampering patterns, the report must rule out obvious artefacts.
Physically impossible pressure
If:
for a low- or medium-pressure node, this may be a telemetry artefact.
Such points must not inflate suspicion.
Flow spike
A flow spike can be treated as an artefact if:
and at the same time:
Such a point may be a totalizer dump, a transmission error or an archive reset.
Broken P sensor
If the pressure channel is stuck for:
then P-dependent tampering detectors must be turned off or marked as non-evidential.
This means:
Issue: metrological reliability of the P sensor.
Not a conclusion: proof of bypass.
Network node where Gay-Lussac is not applicable
If:
and:
and the sensor is not deemed broken, the node may be a low-pressure grid object where pressure is held by a regulator.
In that case GL-dependent indicators must be downgraded or excluded from scoring.
Severity levels and probability weights
Every triggered indicator is assigned a strength level.
| Severity | Probability weight p_i |
|---|---|
| info | 0.00 |
| low | 0.10 |
| medium | 0.30 |
| high | 0.50 |
| high_plus | 0.65 |
These values are not the probability of a legal violation. They are internal weights for combining independent indicators.
Composite suspicion score
Why not a simple sum
If we simply summed all indicators, a node with many weak events would receive an excessively high score. Therefore a multiplicative logic of independent signals is used.
Formula
For each event the weight p_i is taken according to its severity.
Probability that none of the indicators points to suspicion:
Then the combined estimate is:
Score:
or, expanded:
Example
Suppose there are two events:
- medium:
p=0.30; - low:
p=0.10.
Then:
Events excluded from the score
Some events may appear in the report but not participate in the score:
- informational events;
- events with non-applicable physics;
- events suppressed by a quality gate;
- grid GL events;
- events explained by a broken sensor.
Severity cap
Even if the score comes out high, the final textual level must not be inflated when all the events are weak.
Cap matrix
| Composition of events | Maximum level |
|---|---|
has high_plus | very_high |
has high | high |
has 2 or more medium | high |
has 1 medium | medium |
only low | medium |
only info | low / no suspicion |
Why the cap is needed
The cap protects the report from a situation in which many weak events produce a very high mathematical score while the evidential value of each event remains low.
Example:
Score = 100
But there are no high/high_plus events.
Final level: medium.
Event score — device events
The report takes into account not only the Q/P/T statistics but also the device events.
Device-event classes
| Class | Meaning |
|---|---|
physical | physical access, housing breach, clock change, access events |
substitution | indications of substitution or change of the measuring regime |
metrology | metrological deviations |
system_error | system errors of the device |
comm | communication events |
other | other events |
Why the event score can dominate
Device events can be more reliable than statistical heuristics. For example:
- housing breach;
- parameter change;
- reset;
- archive reset;
- date/time change;
- password/default access;
- parameter_change.
If such events exist, the final score may be driven by them even when the statistical score is lower.
Important limitation
Not every device event is direct proof of tampering.
For example:
- metrological deviations may be regular;
- abnormal-event summaries require decoding;
- repeated RAISE/CLEAR must be grouped;
- “flow = 0” may be normal operation.
Final score and Root Cause Matrix
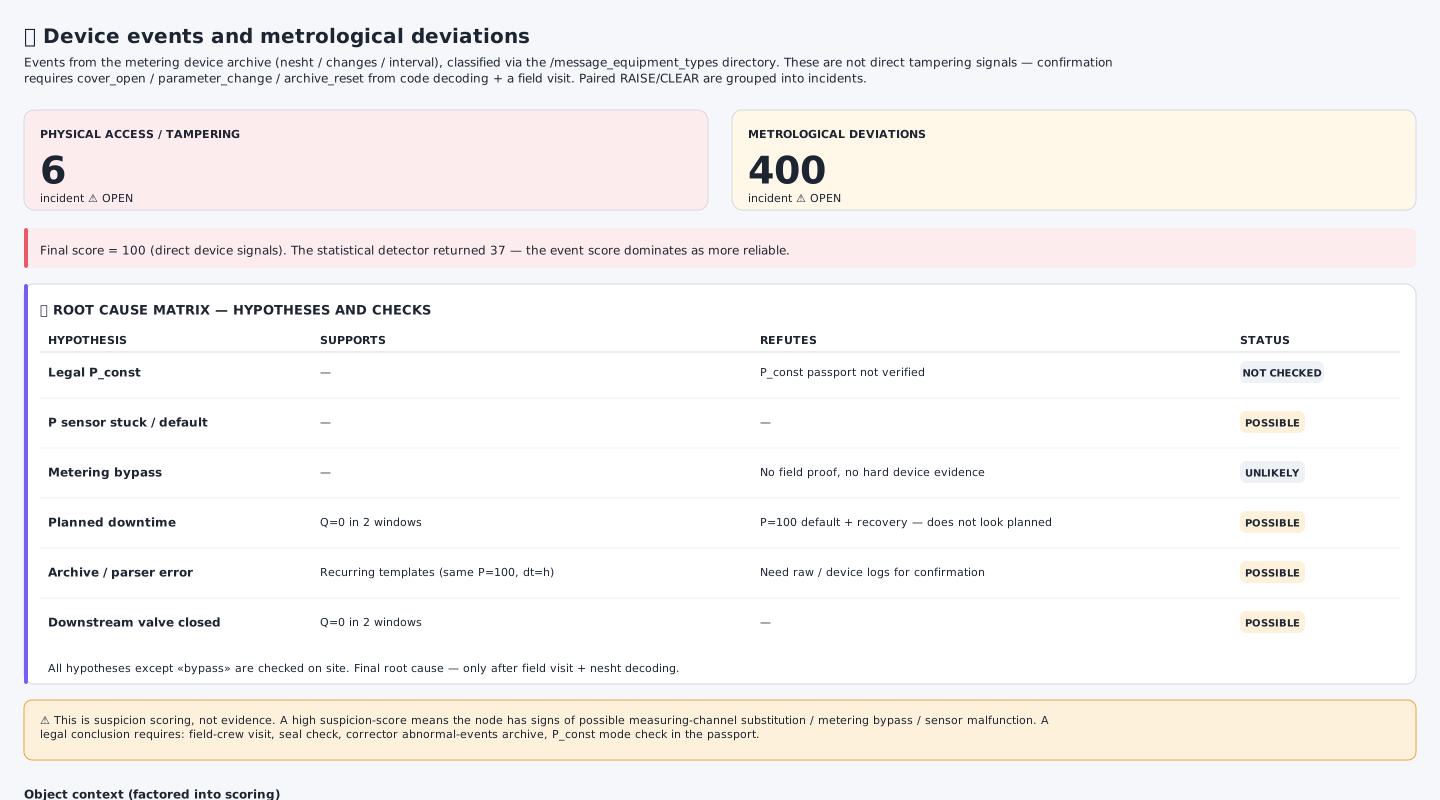
Final score and hypothesis matrix. The block shows which of the two layers (statistical pattern or event score) drove the final score, and immediately offers a root-cause matrix with alternative hypotheses. All hypotheses except “bypass” are checked on site. The final root cause is set only after the field visit and decoding of the abnormal-events log.
The final score must take both layers into account:
statistical pattern score
device event score
One of the principles:
If EventScore is higher, the report must explain:
The final score is driven by direct or classified device events.
The statistical detector gave a lower score.
If PatternScore is higher, the report must explain:
The final score is driven by a repeated Q/P/T pattern.
Direct device signals are insufficient.
Evidence confidence
Evidence confidence reflects not the strength of suspicion but the completeness of the evidence base.
Formula
The source map is used:
| Source | Weight |
|---|---|
| Hourly archive | 3 |
| Sessions | 2 |
| Device events | 3 |
| Passport | 1 |
| Field visit | 3 |
Source status:
Overall percentage:
Levels
| Percentage | Level |
|---|---|
| ≥ 70% | high |
| 35–70% | medium |
| < 35% | low |
Important interpretation
Suspicion scoreanswers: how strong the pattern is.Evidence confidenceanswers: whether sources are sufficient for a confident conclusion.Legal readinessanswers: whether a legally meaningful conclusion can be made.
These are three different scales, and one cannot be derived from another.
Investigation summary: seven scales
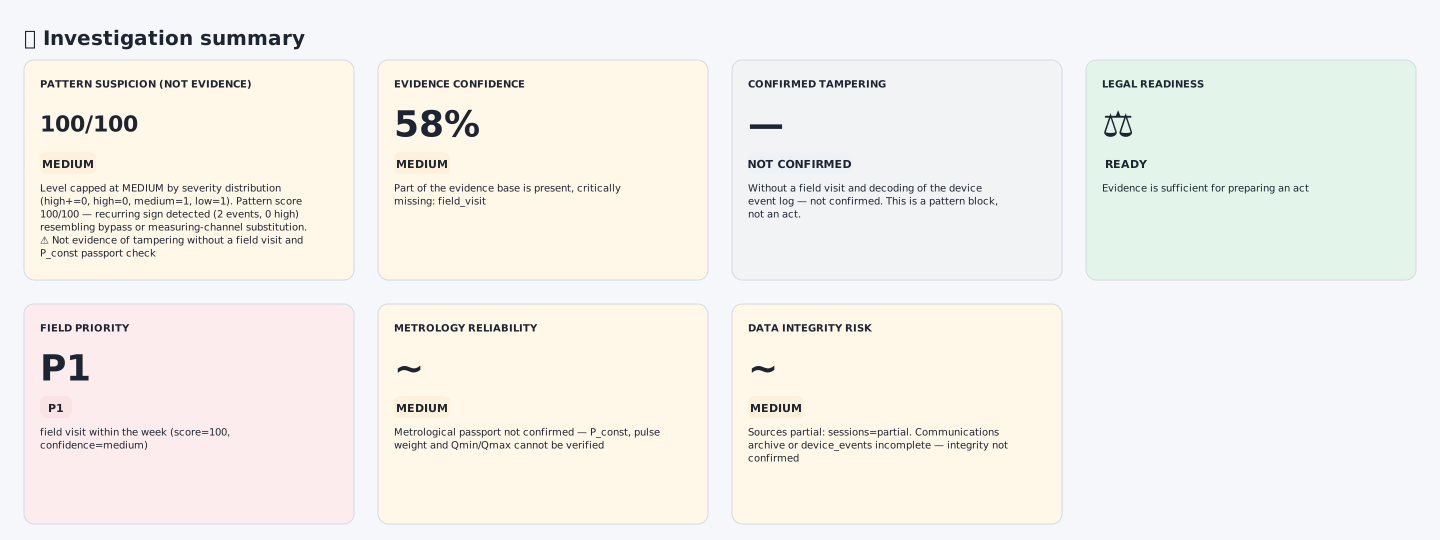
Investigation summary. Right under the report header — seven indicators that are read together, not separately. For example, Pattern Score = 100 with Evidence Confidence = 58% and Confirmed Tampering = ”—” means: mathematically the node looks very suspicious, but there is not yet enough evidence for a formal act — a field visit is needed.
Each of the seven scales has its own meaning, formula and sources:
| Scale | What it shows | Source |
|---|---|---|
| Pattern Suspicion | strength of the mathematical indicators | hourly archive |
| Evidence Confidence | completeness of the evidence base | source map |
| Confirmed Tampering | fact of tampering (juridical) | field act + hard events |
| Legal Readiness | readiness for legal action | confidence + hard events |
| Field Priority | visit urgency | score + confidence + recency |
| Metrology Reliability | reliability of physical assumptions | passport + sensors |
| Data Integrity Risk | integrity of sources | archives + sessions |
Legal readiness
Legal readiness is the assessment of whether the conclusion is ready for a legally meaningful action.
Possible statuses
| Status | Meaning |
|---|---|
not_ready | not enough evidence |
partial | strong indicators exist, but confirmation is needed |
ready | enough evidence for a formal act or formal action |
Conditions for not_ready
statistical patterns only
and no field visit
and no hard device evidence
and the passport is incomplete
Conditions for partial
there are substitution events
or evidence confidence is high
or there is a field visit but some sources are missing
Conditions for ready
ready is possible only if the evidence base is sufficient. Examples:
- a hard physical event in the device log;
- confirmed housing breach;
- confirmed parameter change;
- field visit + device events;
- formal photo documentation;
- proven illegal
P_const/parameter_change.
Field priority
Field priority defines the urgency of the visit.
Possible levels
| Priority | Meaning |
|---|---|
P0 | urgent, today / 24–48 hours |
P1 | visit within a week |
P2 | planned check |
P3 | monitoring |
Matrix
| Condition | Priority |
|---|---|
| physical event in the last 7 days | P0 |
| physical event older than 7 days | P1 |
| score ≥ 70 and confidence medium/high | P0 |
| score ≥ 70 and confidence low | P1 |
| score 50–70 | P1 |
| score 30–50 | P2 |
| score < 30 | P3 |
Why score 100 can be P1
If the score is high but:
- few events;
- no
high/high_plus; - confidence is medium;
- no field visit;
- the passport is incomplete;
- there is no hard evidence;
then the visit may be P1, not P0.
Metrology reliability
Metrology reliability shows how correct the physical and metrological assumptions are.
What reduces reliability
- passport not confirmed;
P_constunknown;- pulse weight unknown;
Qmin/Qmaxunknown;P≈100 kParepeats without explanation;- the P channel is stuck;
- the T channel is stuck;
- pressure type unknown: absolute or gauge;
- Gay-Lussac is applied to a non-closed grid node.
Levels
| Level | Meaning |
|---|---|
| high | passport and channels confirmed, no substantial metrological limitations |
| medium | there are passport gaps or isolated anomalies |
| low | the physical model is not applicable or the sensors are clearly degraded |
Data integrity risk
Data integrity risk shows how complete the investigation data is.
What raises the risk
- partial sessions archive;
- missing device-events log;
- incomplete hourly archive;
- gaps with successful sessions;
- contradictions between sources;
- timestamp from the future;
- incomplete event decoding;
- raw logs unavailable.
Levels
| Level | Condition |
|---|---|
| low | sources complete and consistent |
| medium | some sources partial/missing |
| high | there are data-integrity events or serious contradictions |
Root Cause Matrix — typical hypotheses
The Root Cause Matrix exists so that the report does not collapse into a single accusation.
Typical hypotheses
| Hypothesis | What may support it | What may refute it |
|---|---|---|
Legal P_const | P near default, passport allows the regime | passport does not confirm P_const |
| P sensor stuck | low std(P), repeatability | P changes normally outside the window |
| Metering bypass | Q=0 + P default + recovery + hard evidence | no field proof, no device evidence |
| Planned downtime | Q=0 in line with the site’s regime | P_default / recovery atypical |
| Archive / parser error | gaps, repeated patterns, sessions mismatch | raw device logs confirm reality |
| Downstream valve closed | Q=0 with operating P | no confirmation of valve position |
| Grid regulator | P stable at low pressure | the site is not a grid node |
| Seasonal shutdown | site profile allows downtime | consumption was due under contract |
Hypothesis statuses
| Status | Meaning |
|---|---|
not_checked | not checked |
possible | possible |
unlikely | unlikely |
likely | likely |
confirmed | confirmed |
The final root cause is set only after a field visit and decoding of the abnormal-events log.
Potential exposure-volume estimate
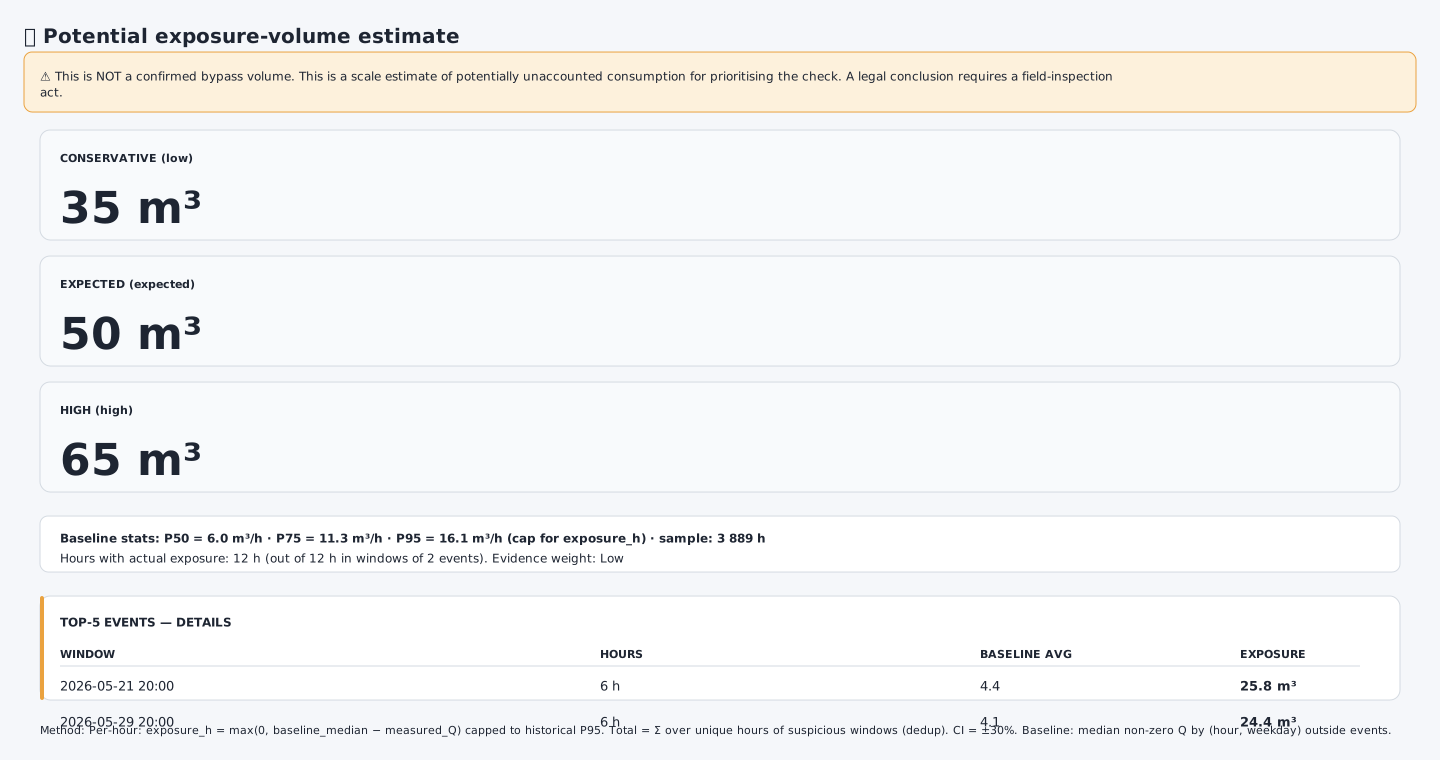
Potential exposure-volume estimate. Not a theft volume, but a scale estimate for prioritising the check. The three numbers (low / expected / high) form a ±30% range around the expected value. The baseline is computed as the median of non-zero flows for the same hour of week outside events. Without a field inspection, all numbers remain a heuristic.
Exposure is a computation of the scale of potentially unmetered consumption in suspicious windows.
Baseline
For each hour a baseline is built from historical non-event data.
The median of non-zero flows is used for the same combination:
hour of day + day of weekFormula:
Hour exposure
For each hour of a suspicious window:
Upper cap
To avoid overestimation, the hourly exposure is capped at the historical P95:
If Qmax is known, the cap can be tightened:
Deduplication
If suspicious windows overlap, the same hour is counted only once:
Total expected exposure
Uncertainty range
For the indicative range, ±30% is used:
Exposure evidence weight
Exposure has low or medium evidence weight until there is:
- a field visit;
- external-meter readings;
- confirmation of the site’s regime;
- confirmation that Q should indeed have been >0;
- verification of the passport parameters.
Correlation with the abnormal-events archive
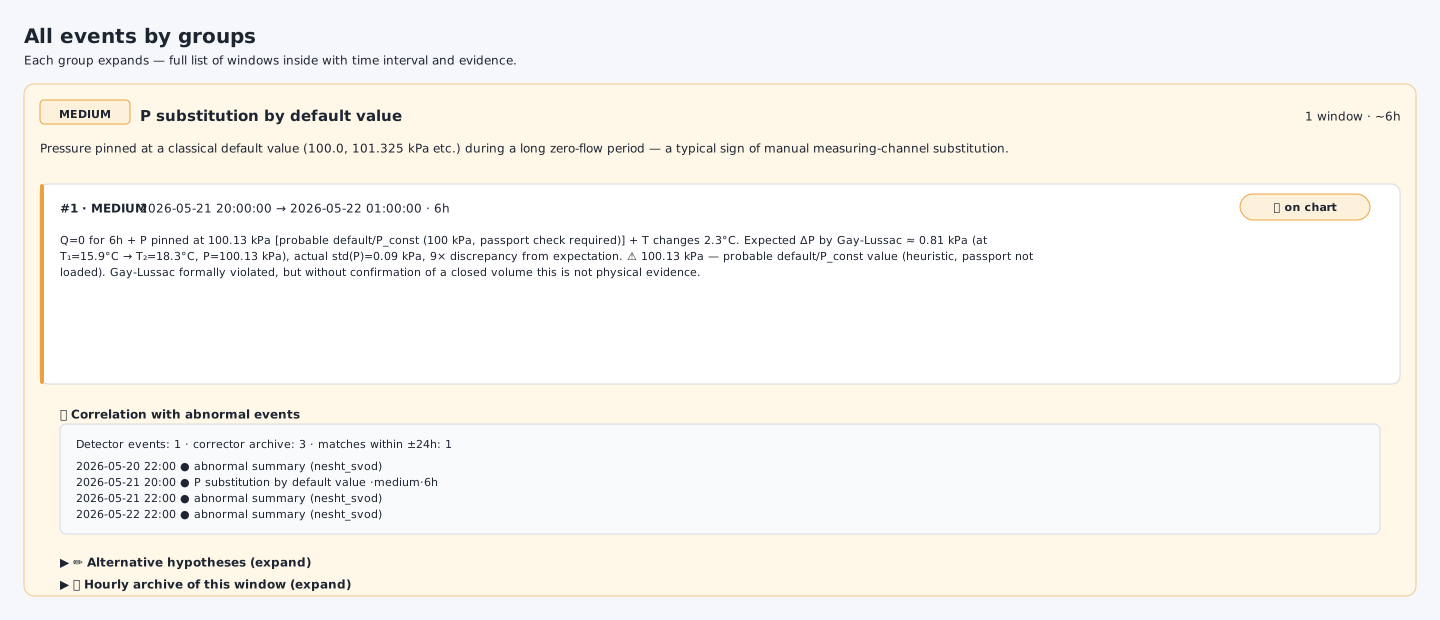
Events by groups. Each suspicious-pattern window expands into a full card: detailed values, correlation with the abnormal-events log (device events within ±24h), the list of alternative hypotheses and the hourly archive of this window. A strong correlation (parameter_change / reset inside the window) is a hard-evidence candidate.
The correlation shows whether device events sit near a suspicious window.
Correlation window
For each event the following window is used:
What counts as a match
A match is any device event that falls inside the window.
Examples:
- abnormal-events summary;
- a single abnormal event;
parameter_change— change of a device parameter;reset— reset;cover_open— housing breach;clock_change— clock change;archive_reset— archive reset.
Interpretation
| Result | Meaning |
|---|---|
| no matches | the device log does not confirm the window |
| only summaries | weak correlation |
parameter_change / reset | strong correlation |
cover / magnet / physical | hard-evidence candidate |
| log is empty | confirmation is impossible |
AI commentary
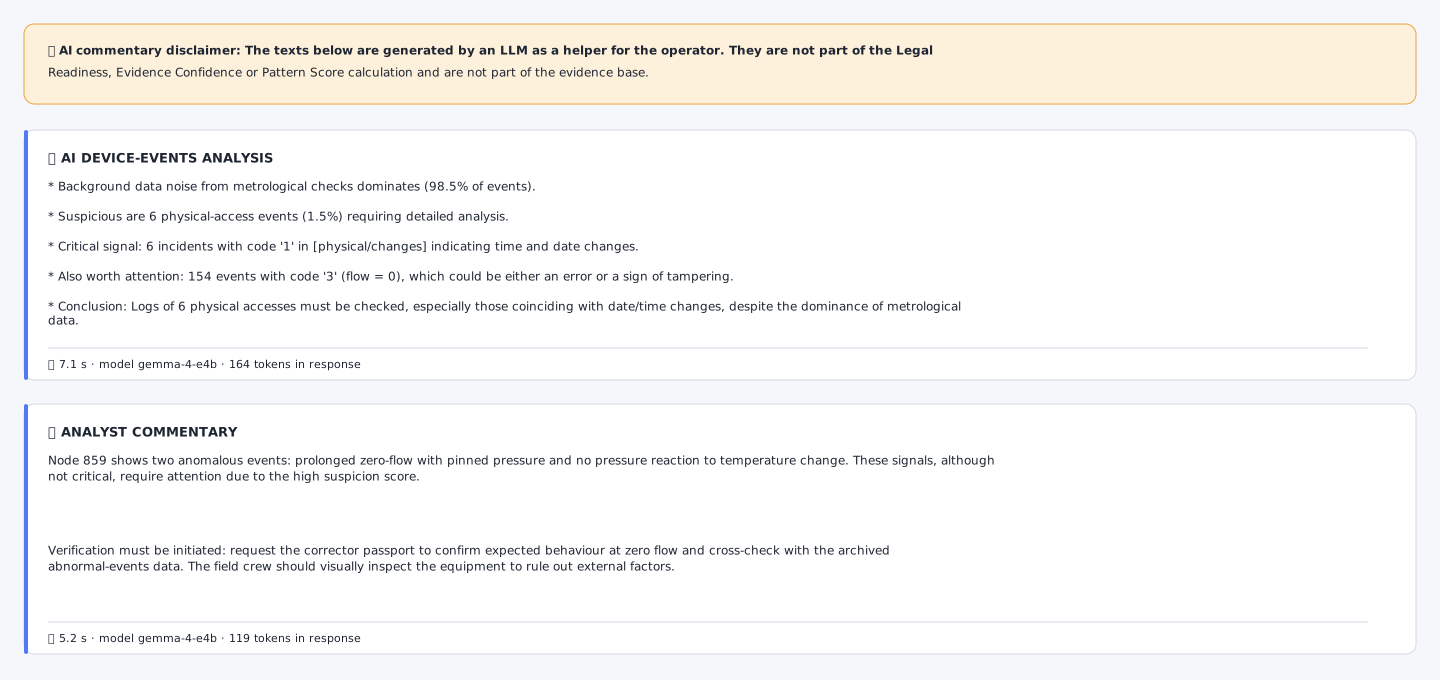
AI commentary. An auxiliary text for the operator: one block explains the device events, the other formulates a methodology summary. The disclaimer at the top stresses that AI does not participate in scoring and does not replace a field inspection.
AI commentary is an auxiliary text.
What AI can do
- briefly explain the issue;
- list the main risks;
- formulate hypotheses;
- suggest the order of checks;
- produce a clear conclusion for the operator.
What AI cannot do
AI cannot:
- change the score;
- change legal readiness;
- confirm tampering;
- replace the device log;
- replace the passport;
- replace a field visit;
- create evidence.
Required disclaimer
The AI commentary does not participate in the calculation of Legal Readiness, Evidence Confidence or Pattern Score and is not part of the evidence base.Field-crew inspection checklist
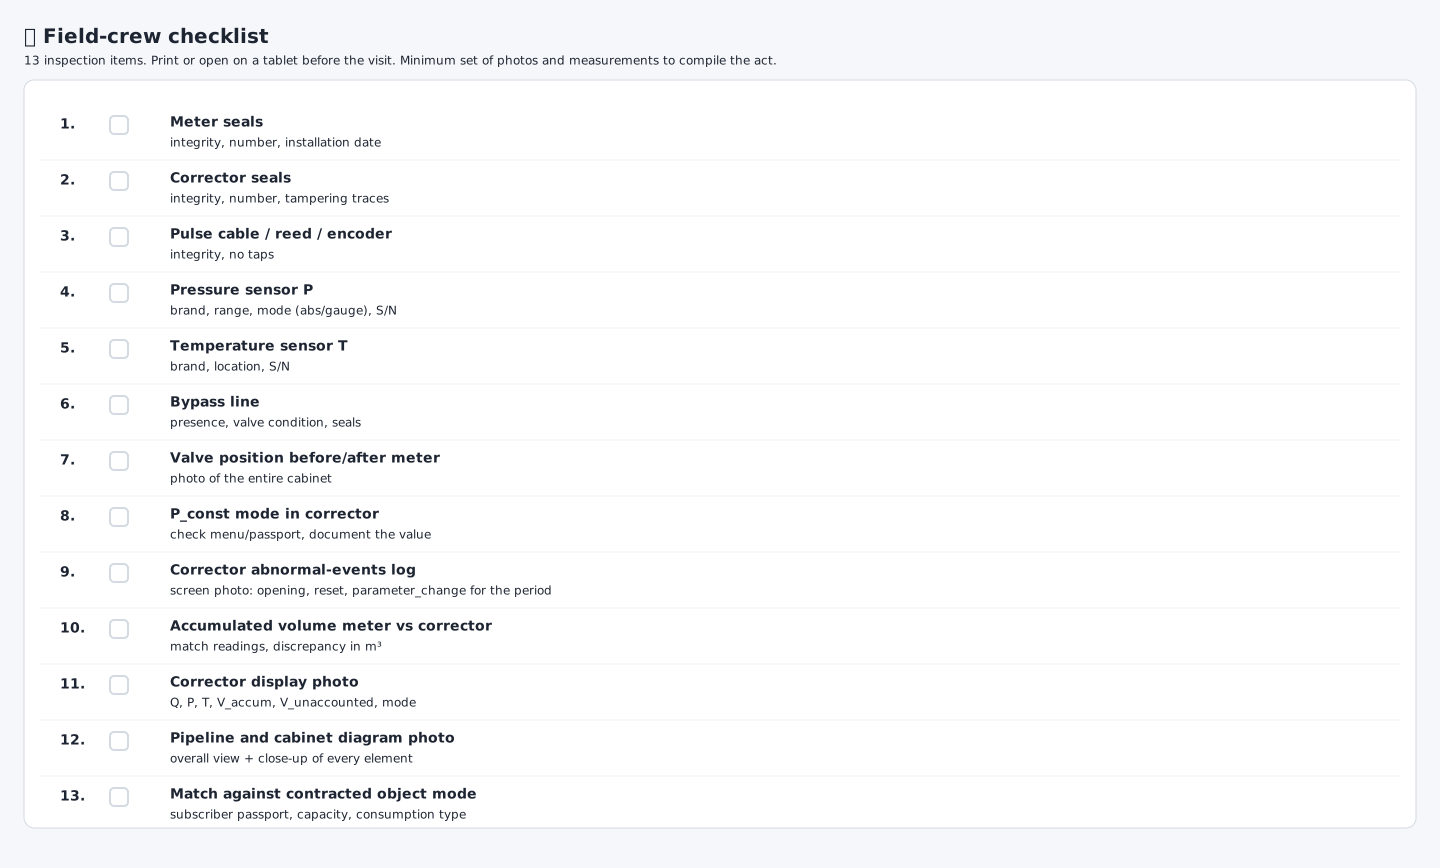
Field-visit checklist. The minimum set of photos and measurements needed to draft the act. Printed or opened on a tablet before the visit. Tied to the detected indicators: if the P_default pattern triggered — the P_const regime item is mandatory; if the archive-gap pattern triggered — the abnormal-events log item is mandatory.
The checklist must be tied to the detected indicators.
General items
- meter seals;
- corrector seals;
- pulse cable / reed / encoder;
- pressure sensor;
- temperature sensor;
- bypass line;
- valve positions upstream and downstream of the meter;
P_constregime;- abnormal-events log;
- cumulative volume on the meter and the corrector;
- corrector display photo;
- pipework layout;
- contractual regime of the site.
Required photos
- corrector display:
Q, P, T, V; - corrector date and time;
P_constregime;- meter serial number;
- corrector serial number;
- seals;
- P sensor;
- T sensor;
- pulse cable;
- bypass and valves;
- overall view of the node.
What to measure
- actual pressure with a reference manometer;
- actual temperature;
- cumulative volume;
- external-meter readings;
- presence of pulses;
- power-supply status;
- communication parameters;
Qmin/Qmaxper passport;- pulse weight.
Q/P chart and suspicious windows
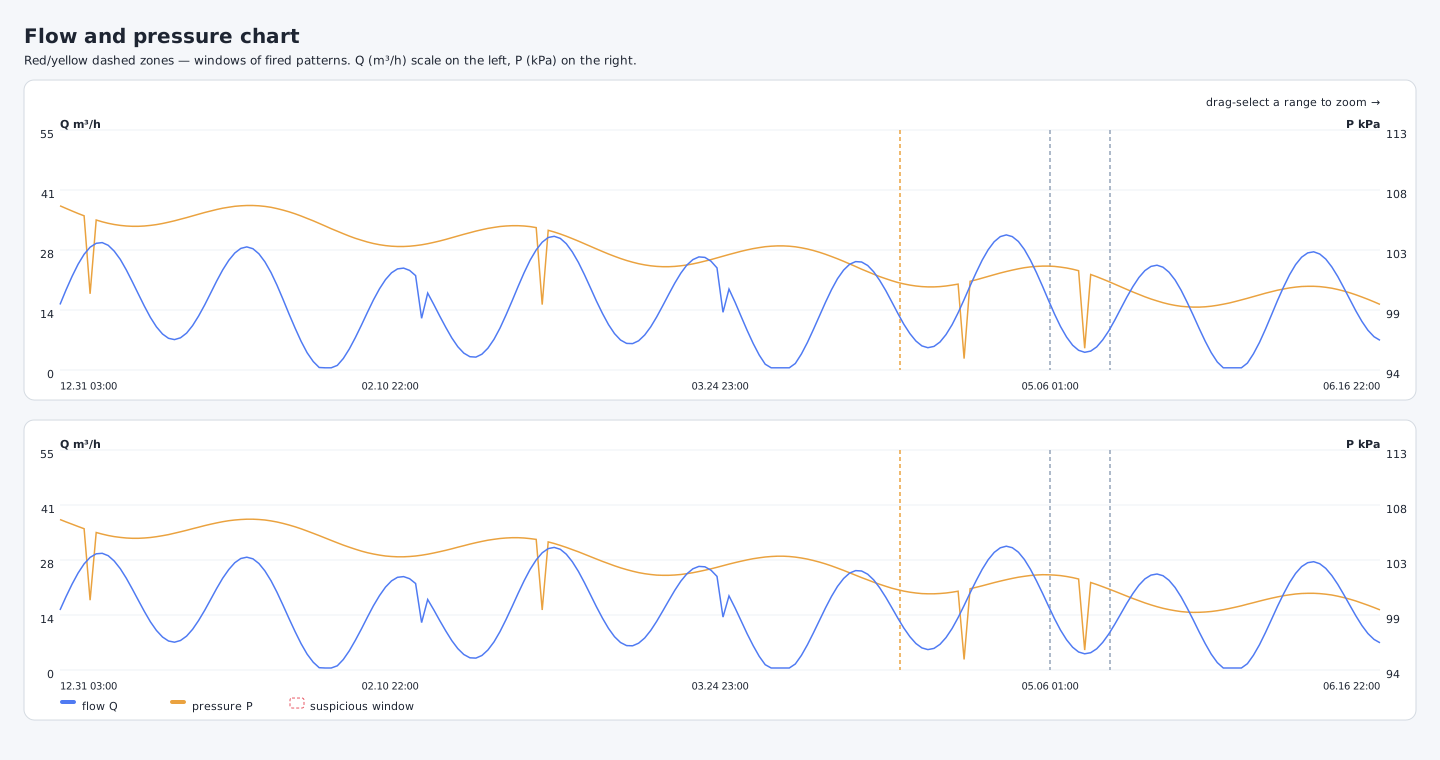
Q/P chart. The main visualisation. The blue line is the hourly flow, the orange one is the pressure. Red and yellow hatched zones mark windows of the triggered patterns: on hover, the exact hour values are shown. The double chart lets you see the whole period at once and not miss long-term trends.
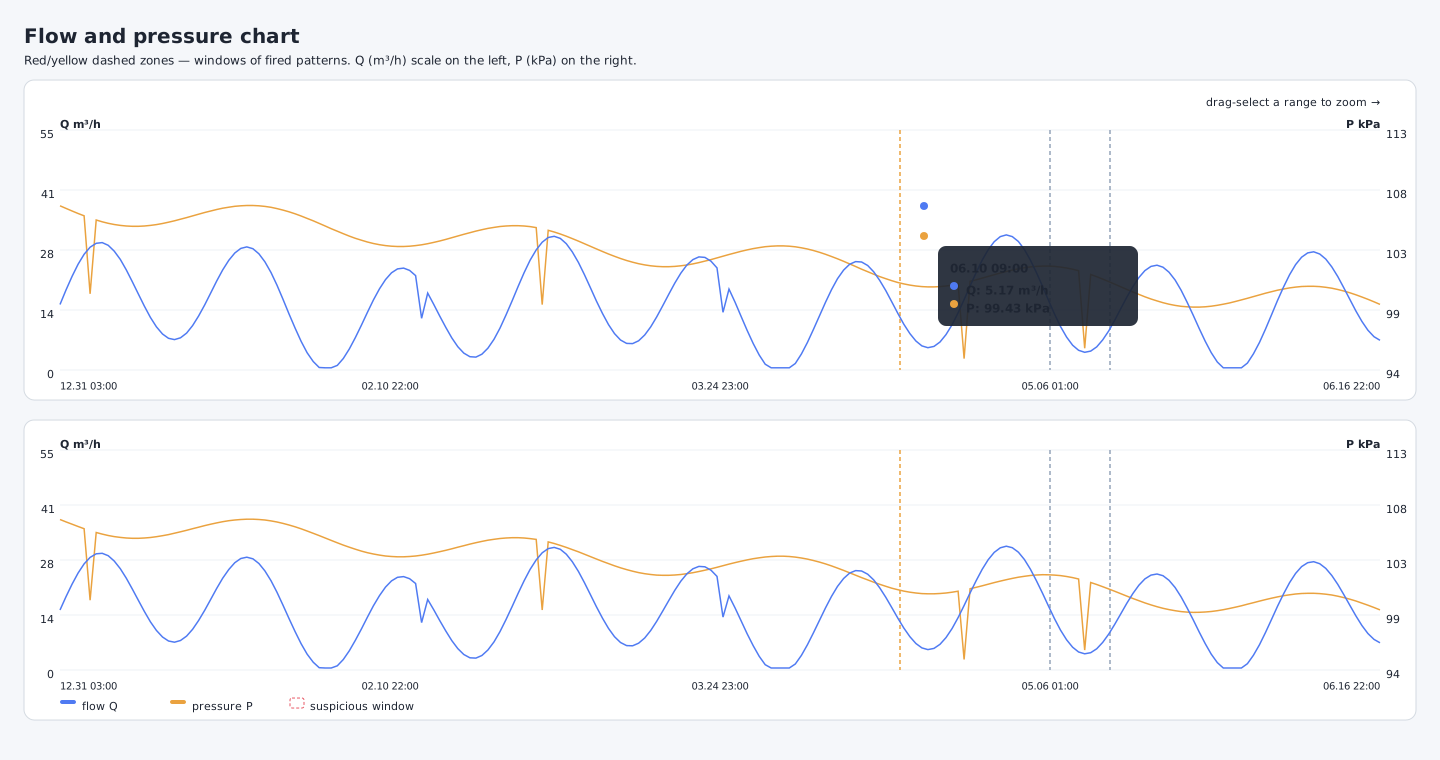
Chart tooltip. Hovering over any point shows the exact hourly values of Q and P. This is needed for hypothesis checks: e.g. to learn the pressure value inside a suspicious window or to compare flow against the baseline.
What to look for on the chart
- long horizontal segments of P (plateau →
P_stuck); - drops of Q to zero (zero-flow periods);
- simultaneous jumps of Q and P (recovery);
- pressure jumps without flow;
- a perfectly flat Q with a non-zero mean (synthetic profile);
- discontinuities in time (gap in the archive).
What cannot be interpreted alone
- a single zero hour;
- a one-off P spike;
- any anomaly without checking the abnormal-events log and the passport.
Node summary and hourly distribution

Node summary. A single glance at the “raw fabric”: how many events, how diverse the indicators, total duration, period coverage. The “when they started” histogram is useful for spotting regime patterns: events only at night or only during business hours are diagnostically important (see the “recoveries only during business hours” pattern).
Summary metrics
| Metric | What it shows |
|---|---|
| Total events | total number of detected patterns |
| Unique types | how many distinct detectors triggered |
| Duration | total duration of all windows (with deduplication) |
| Coverage | share of the period covered by suspicious windows |
| Levels | breakdown by low/medium/high/high_plus |
| Most severe | name and severity of the strongest indicator |
Hourly distribution
The “when they started” histogram uses colour coding:
- night (00–05) — blue;
- morning (06–08) — light blue;
- day (09–17) — orange;
- evening (18–23) — violet.
Concentration in one colour is a strong diagnostic signal (e.g. all events during business hours → manual maintenance).
Top-5 windows for field inspection

Top-5 windows for the crew. If the crew is time-limited — start with these 5 windows. The full list is below in the “all events by groups” section. The “what to check” column is assembled automatically from the triggered indicators: for zero_flow_p_default it is the P_const regime, for gap_with_clean_sessions it is the abnormal-events log and an archive-parser check.
Top-5 selection algorithm
1. filter events with severity >= medium
2. sort by weight (high_plus > high > medium > low)
3. within each weight — by time descending
4. keep the first 5
5. assemble the checklist union from the triggered indicators
“What to check” column
| Triggered indicator | Mandatory items |
|---|---|
zero_flow_p_default | seals, passport P_const, abnormal-events log |
zero_flow_p_stuck | P sensor, passport, display photo |
zero_flow_recovery | valve positions, abnormal events, recovery time |
gap_with_clean_sessions | sessions archive, parser, raw logs |
plateau_q_p | pulse cable, encoder, passport Qmin/Qmax |
How to read the upper block
Pattern suspicion
Answers the question:
How strong are the mathematical indicators of suspicion?
Does not answer the question:
Is tampering proven?
Evidence confidence
Answers the question:
How complete is the evidence base?
Is not equal to suspicion score.
Confirmed tampering
Must stay NOT CONFIRMED if there is no hard evidence or field act.
Legal readiness
Shows whether one can proceed to a legally meaningful action.
Field priority
Shows how urgently a field visit is needed.
Metrology reliability
Shows whether the physical and metrological assumptions can be trusted.
Data integrity risk
Shows how complete and consistent the data sources are.
Common interpretation mistakes
Mistake: score 100 = proof
Wrong. A score of 100 may be the result of a strong statistical pattern or event score. Proof requires sources.
Mistake: P=100 kPa = illegal substitution
Wrong. It may be a P_const or default value allowed by the passport.
Mistake: Gay-Lussac violated = tampering
Wrong. The model applies only to a closed volume.
Mistake: Q=0 with P>0 = bypass
Wrong. It may be downtime, a closed valve or a technological regime.
Mistake: exposure = loss
Wrong. Exposure is a scale estimate for the check.
Mistake: AI wrote “suspicion” = proven
Wrong. The AI commentary is only an explanation.
Mistake: “not triggered” = “no problem”
Wrong. An indicator may have been suppressed by a quality gate, disabled because of a stuck sensor or simply not applicable to the node type. Read the limitations section carefully.
Minimum criteria for a complete report
The report is considered methodologically complete if it contains:
- analysis period;
- node card;
- pattern suspicion score;
- evidence confidence;
- confirmed tampering status;
- legal readiness;
- field priority;
- data-source map;
- list of detected patterns;
- formal condition for each pattern;
- severity and cap logic;
- event score or an explanation of its absence;
- root cause matrix;
- exposure estimate;
- correlation with device events;
- AI disclaimer;
- field-visit checklist;
- methodology with formulas and thresholds;
- statement of limitations and alternative hypotheses.
Recommended final-verdict wording
A correct final verdict must be neutral:
The node shows indicators that require verification: long Q≈0 periods,
a stuck pressure channel and/or matches with device events.
This is not standalone proof of tampering.
For the final verdict, the P_const passport, the abnormal-events log,
seals, the pulse cable, the corrector readings and the actual node layout must be checked.
If evidence confidence is high:
The presence of direct device events raises the evidence weight, but the final qualification
must take into account the decoding of the codes, passport parameters and the results of the field inspection.
If evidence confidence is low:
The detected indicators are heuristic in nature and are used only for planning the check.Related reports
- Metering Bypass (fleet) — the same assessment across the whole fleet at once, without the proceedings blocks.
- Suspicious Nodes — the main fleet-level tool for detecting bypass.
- Consumption Analytics — a general node breakdown with the event log; recommended to run before or together with this report.
- Passport Audit — a check of passport completeness, without which legal readiness cannot be
ready.
Related topics
Was this page helpful?
Thanks for your feedback!