Операційні KPI та ефективність команд
Операційні KPI — від MTTD до Verification Success Rate — та окрема група Team KPI для завантаження, capacity й ефективності.
Операційні ключові показники ефективності
Operational Health Matrix використовує систему експлуатаційних показників, призначену для об’єктивного оцінювання ефективності процесів виявлення, аналізу, усунення та підтвердження експлуатаційних проблем.
На відміну від традиційної звітності, KPI слугують не лише для оцінки підрозділів, а й для безперервного вдосконалення самої платформи.
Усі показники система розраховує автоматично — на підставі фактичної історії життєвого циклу Operational Issues.
Архітектура KPI
Усі показники поділяються на чотири незалежні групи.
flowchart TD
  ALL["Усі показники"] --> OPS["Операційні KPI"]
  ALL --> ASSET["KPI активів"]
  ALL --> TEAM["KPI команд"]
  ALL --> PLAT["KPI платформи"]
Такий поділ виключає змішування стану обладнання, ефективності співробітників і якості аналітичних алгоритмів.
Середній час виявлення (MTTD)
MTTD характеризує ефективність аналітичної підсистеми.
Визначення:
Середній час між фактичним виникненням проблеми та її автоматичним виявленням платформою.
Використовується для оцінювання:
- якості детекторів;
- повноти телеметрії;
- затримок обробки;
- ефективності аналітики.
Що менше значення, то швидше система виявляє проблему.
Середній час реакції (MTTA)
Показує швидкість реакції експлуатаційної служби.
Визначення:
Середній час між створенням Operational Issue та підтвердженням його прийняття відповідальним підрозділом.
Дає змогу оцінювати:
- швидкість реагування;
- організаційну дисципліну;
- ефективність диспетчерської служби.
Середній час усунення (MTTR)
Основний експлуатаційний показник.
Визначення:
Середній час між створенням Operational Issue та підтвердженим усуненням його причини.
У розрахунку враховуються лише завершені Issues.
Для різних класів проблем допускаються окремі нормативи.
Середній час верифікації (MTTV)
MTTV оцінює ефективність процесу перевірки.
Показник характеризує:
час між завершенням робіт і підтвердженням відновлення нормального стану обладнання.
Високий MTTV зазвичай свідчить про:
- недостатню телеметрію;
- складну процедуру перевірки;
- брак ресурсів;
- проблеми в організації експлуатації.
Дотримання SLA (SLA Compliance)
Показує частку Operational Issues, завершених без порушення вимог SLA.
Розраховується окремо для:
- реакції (Response);
- підтвердження (Acknowledgement);
- усунення (Resolution);
- верифікації (Verification);
- закриття (Closure).
Окрема статистика ведеться:
- за регіонами;
- за підрозділами;
- за канонами (Canon);
- за типами обладнання.
Середній вік Issues (Mean Issue Age)
Показує середній вік активних Operational Issues.
Використовується для оцінювання накопиченого експлуатаційного боргу.
Додатково розраховується розподіл:
- 0–1 день;
- 1–3 дні;
- 3–7 днів;
- 7–30 днів;
- понад 30 днів.
Частка повторних відкриттів (Reopen Rate)
Характеризує якість усунення проблем.
Визначення:
Частка Operational Issues, повторно відкритих після закриття.
Високе значення вказує на:
- неповне усунення причини;
- помилкову діагностику;
- недостатню верифікацію;
- хронічні дефекти обладнання.
Повторюваність проблем (Repeat Issue Rate)
Показує повторюваність однакових канонів для одного активу.
Використовується під час аналізу:
- хронічних відмов;
- потреби в модернізації обладнання;
- якості обслуговування.
Частка пропущених проблем (Issue Escape Rate)
Показує частку проблем, які не було виявлено автоматично і які зареєстрували користувачі.
Зростання показника потребує аналізу:
- покриття детекторами;
- якості телеметрії;
- повноти аналітики.
Успішність верифікації (Verification Success Rate)
Визначає частку робіт, успішно підтверджених системою після виконання.
Високе значення свідчить про:
- правильну діагностику;
- коректне виконання робіт;
- високу надійність Operational Workflow.
Операційний backlog
Backlog показує обсяг незавершеної роботи.
Додатково система аналізує:
- загальний обсяг;
- критичний backlog;
- прострочений backlog;
- backlog за підрозділами;
- backlog за регіонами.
Дашборд KPI
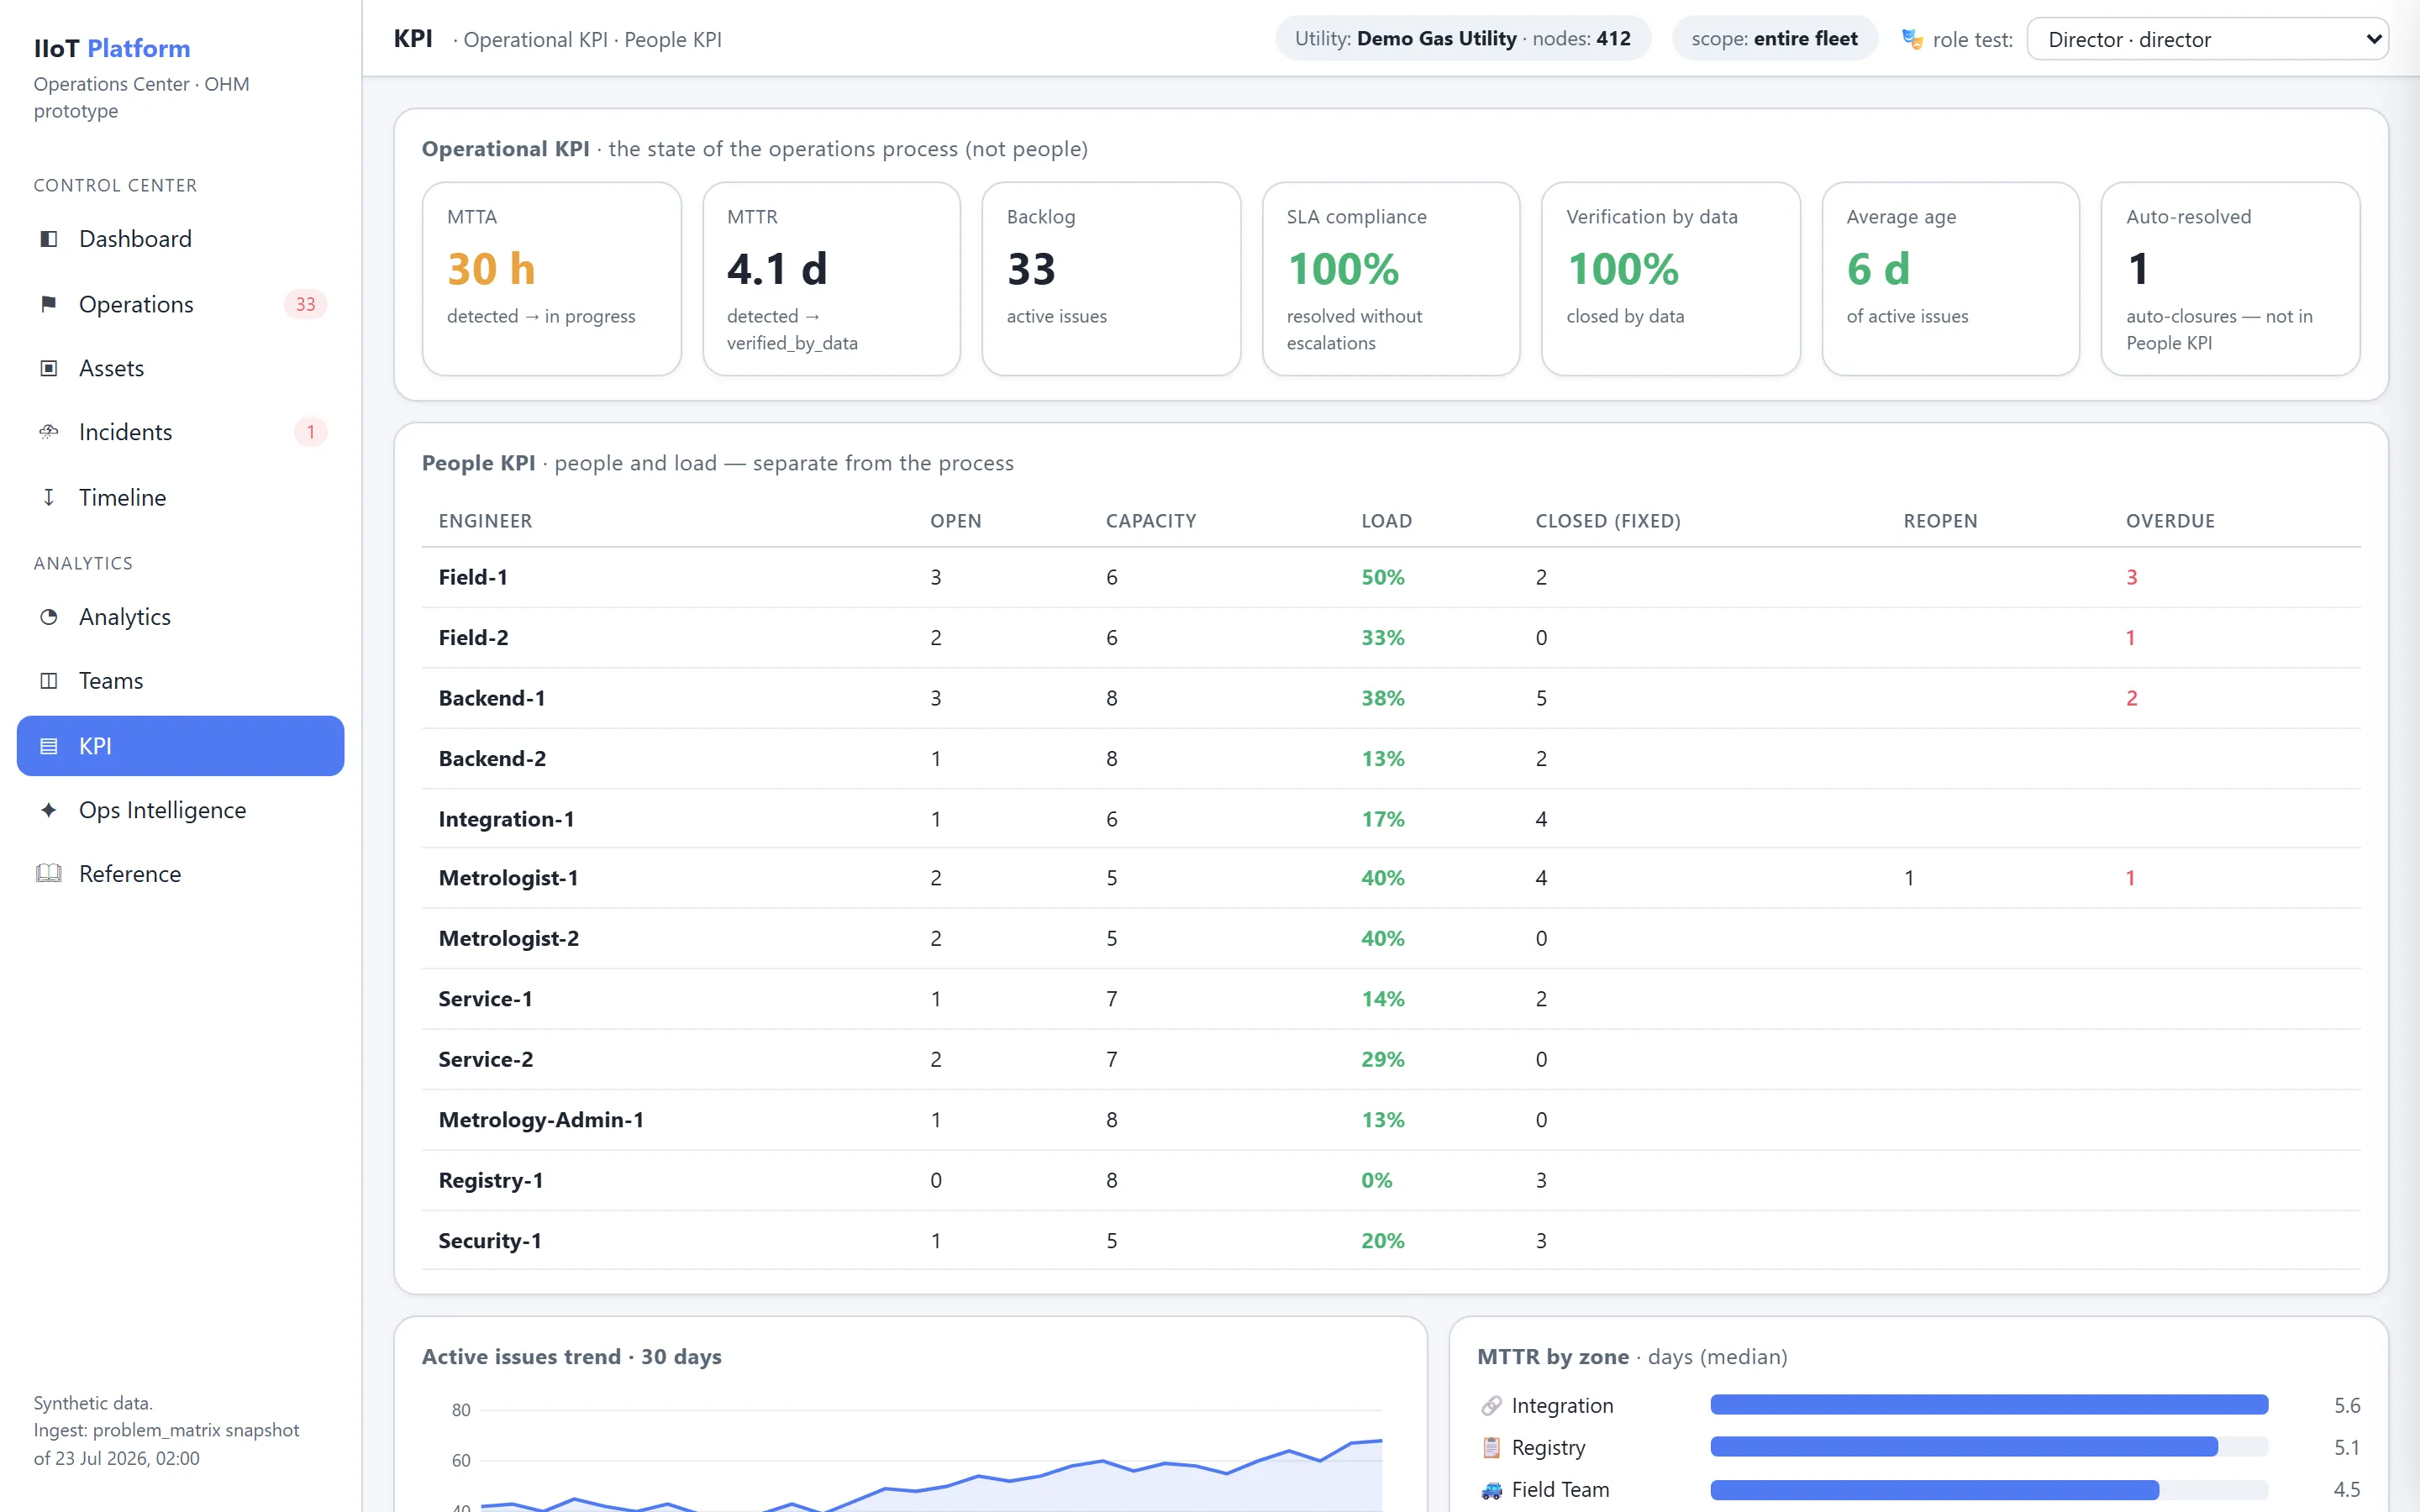
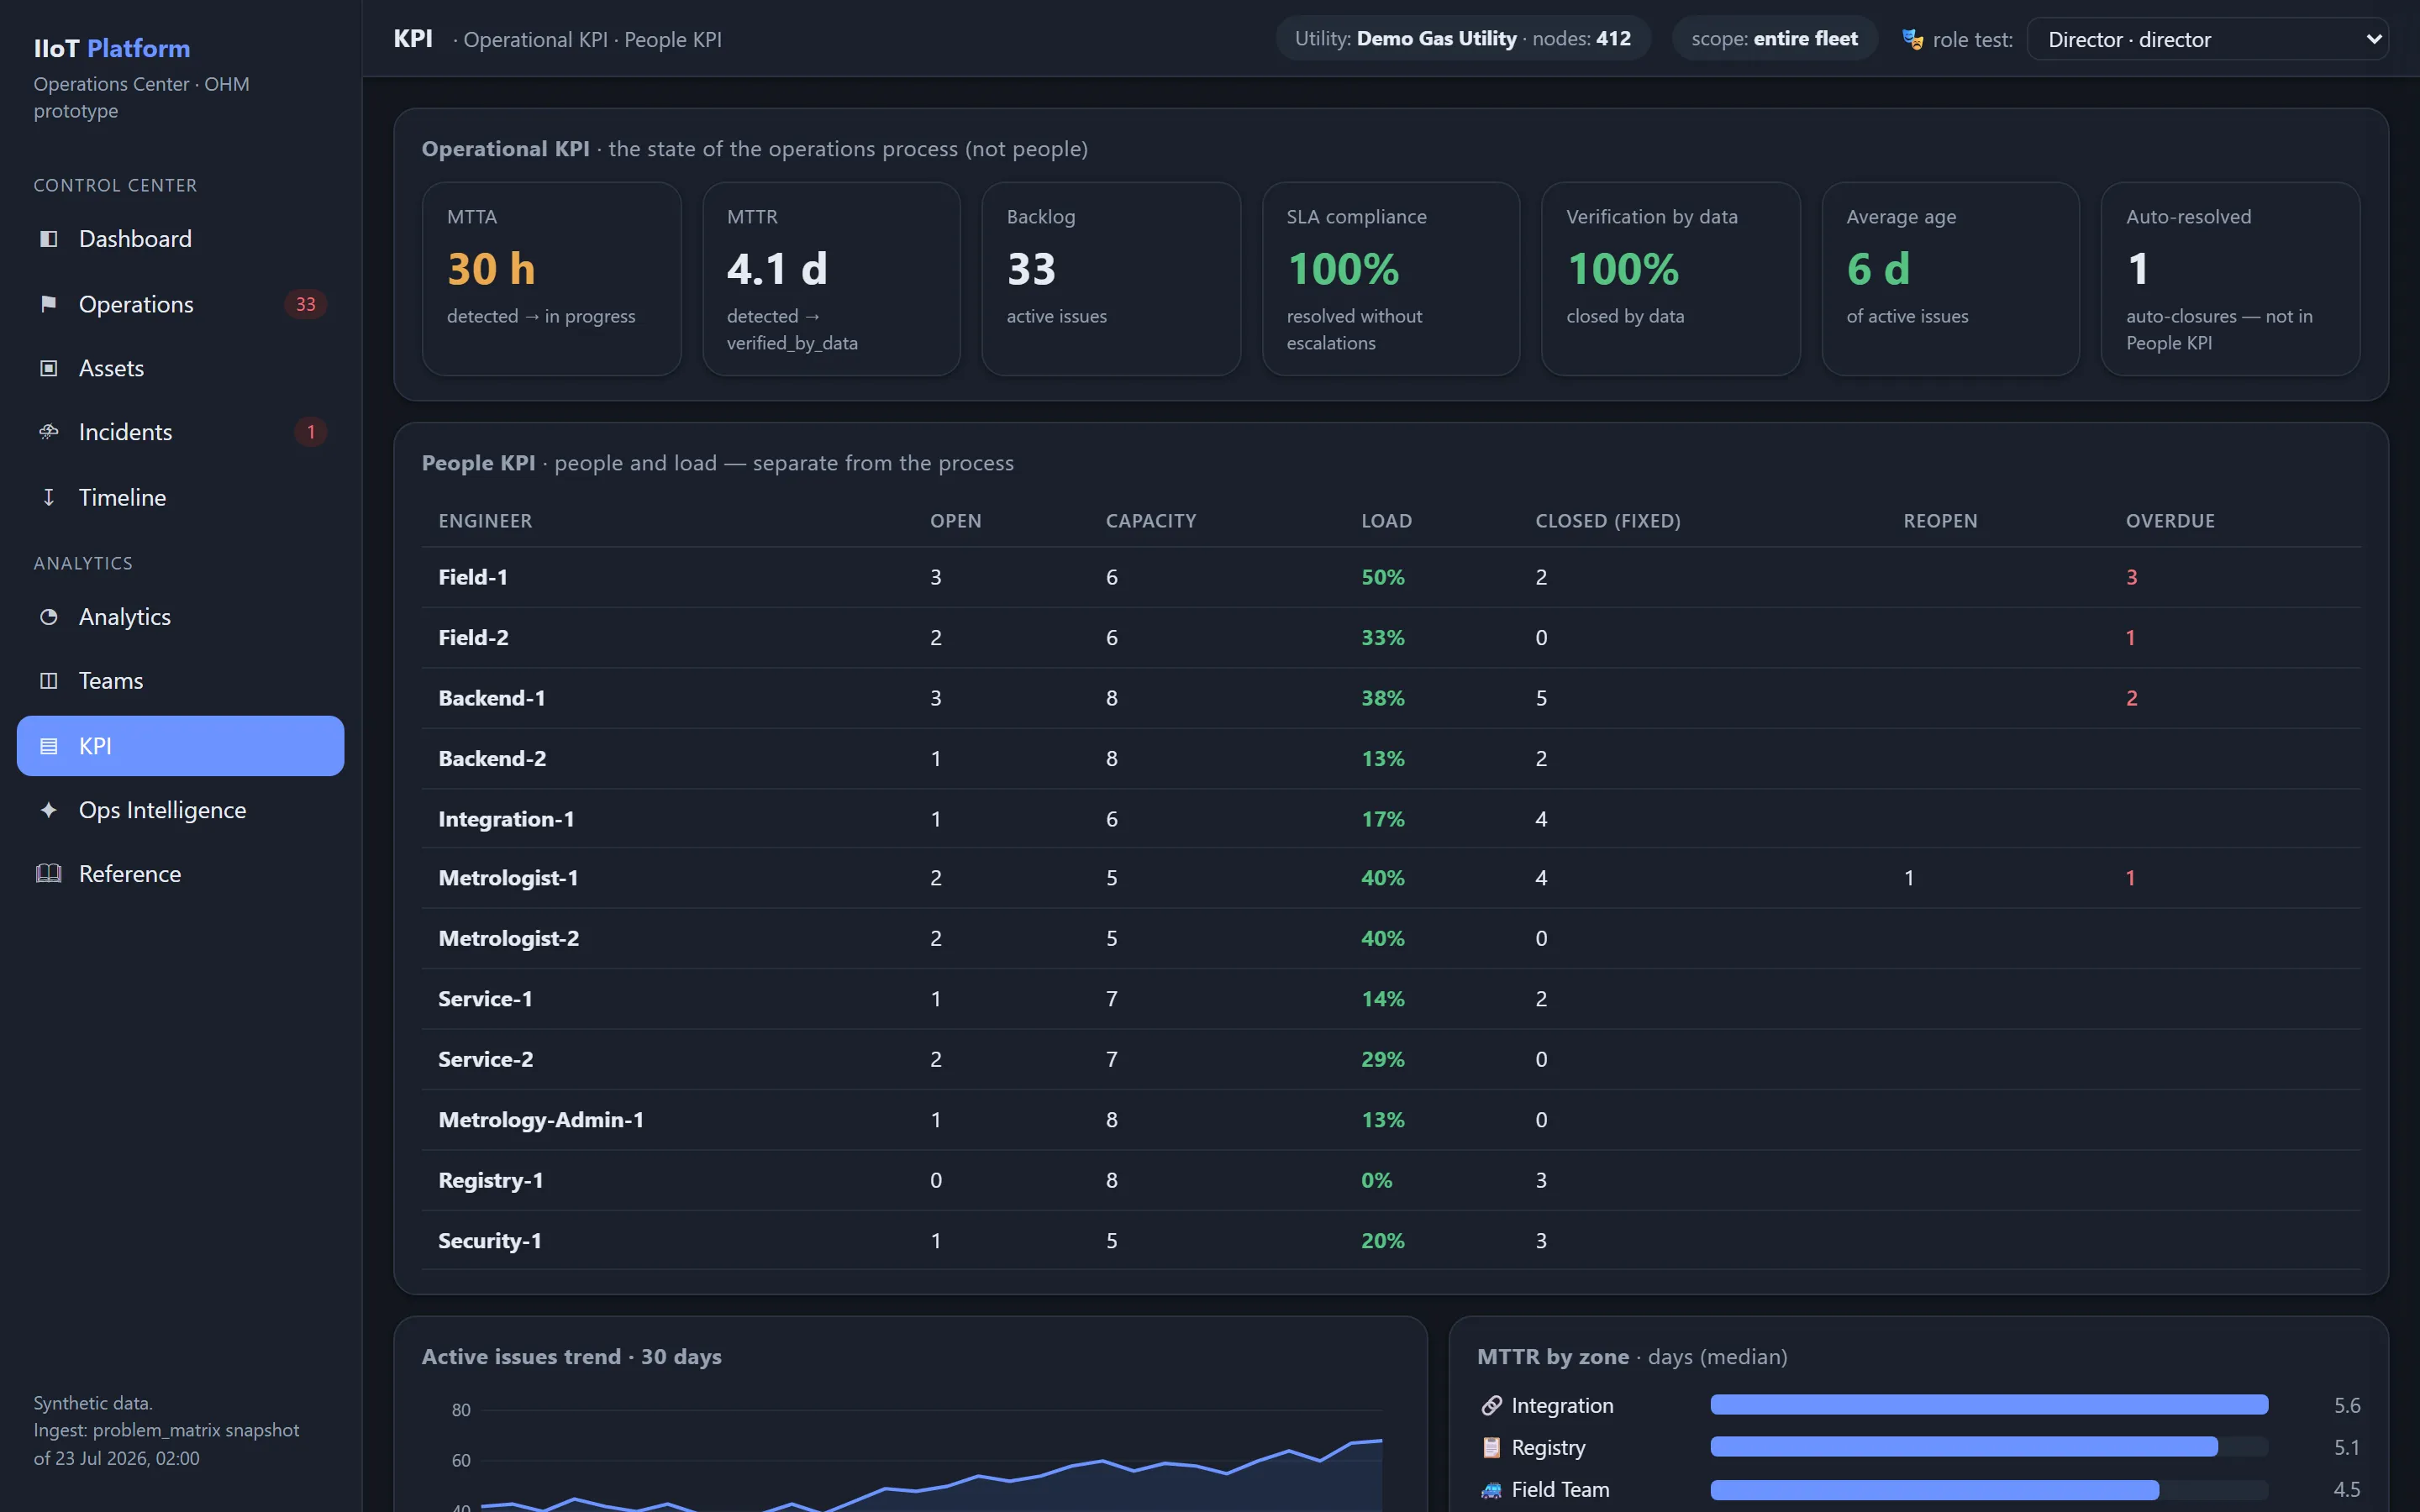
Головна аналітична панель містить:
- MTTD;
- MTTA;
- MTTR;
- MTTV;
- SLA Compliance;
- Reopen Rate;
- Repeat Rate;
- Detector Accuracy;
- False Positive Rate;
- Operational Backlog;
- Mean Issue Age;
- Health Trend.
Усі показники доступні в динаміці та на будь-якому рівні організаційної структури.
Показники ефективності команд
Експлуатаційні показники обладнання не використовуються для оцінювання співробітників.
Для оцінювання ефективності підрозділів застосовується окрема група Team KPI.
Це виключає ситуацію, коли погіршення стану обладнання автоматично погіршує оцінку роботи персоналу.
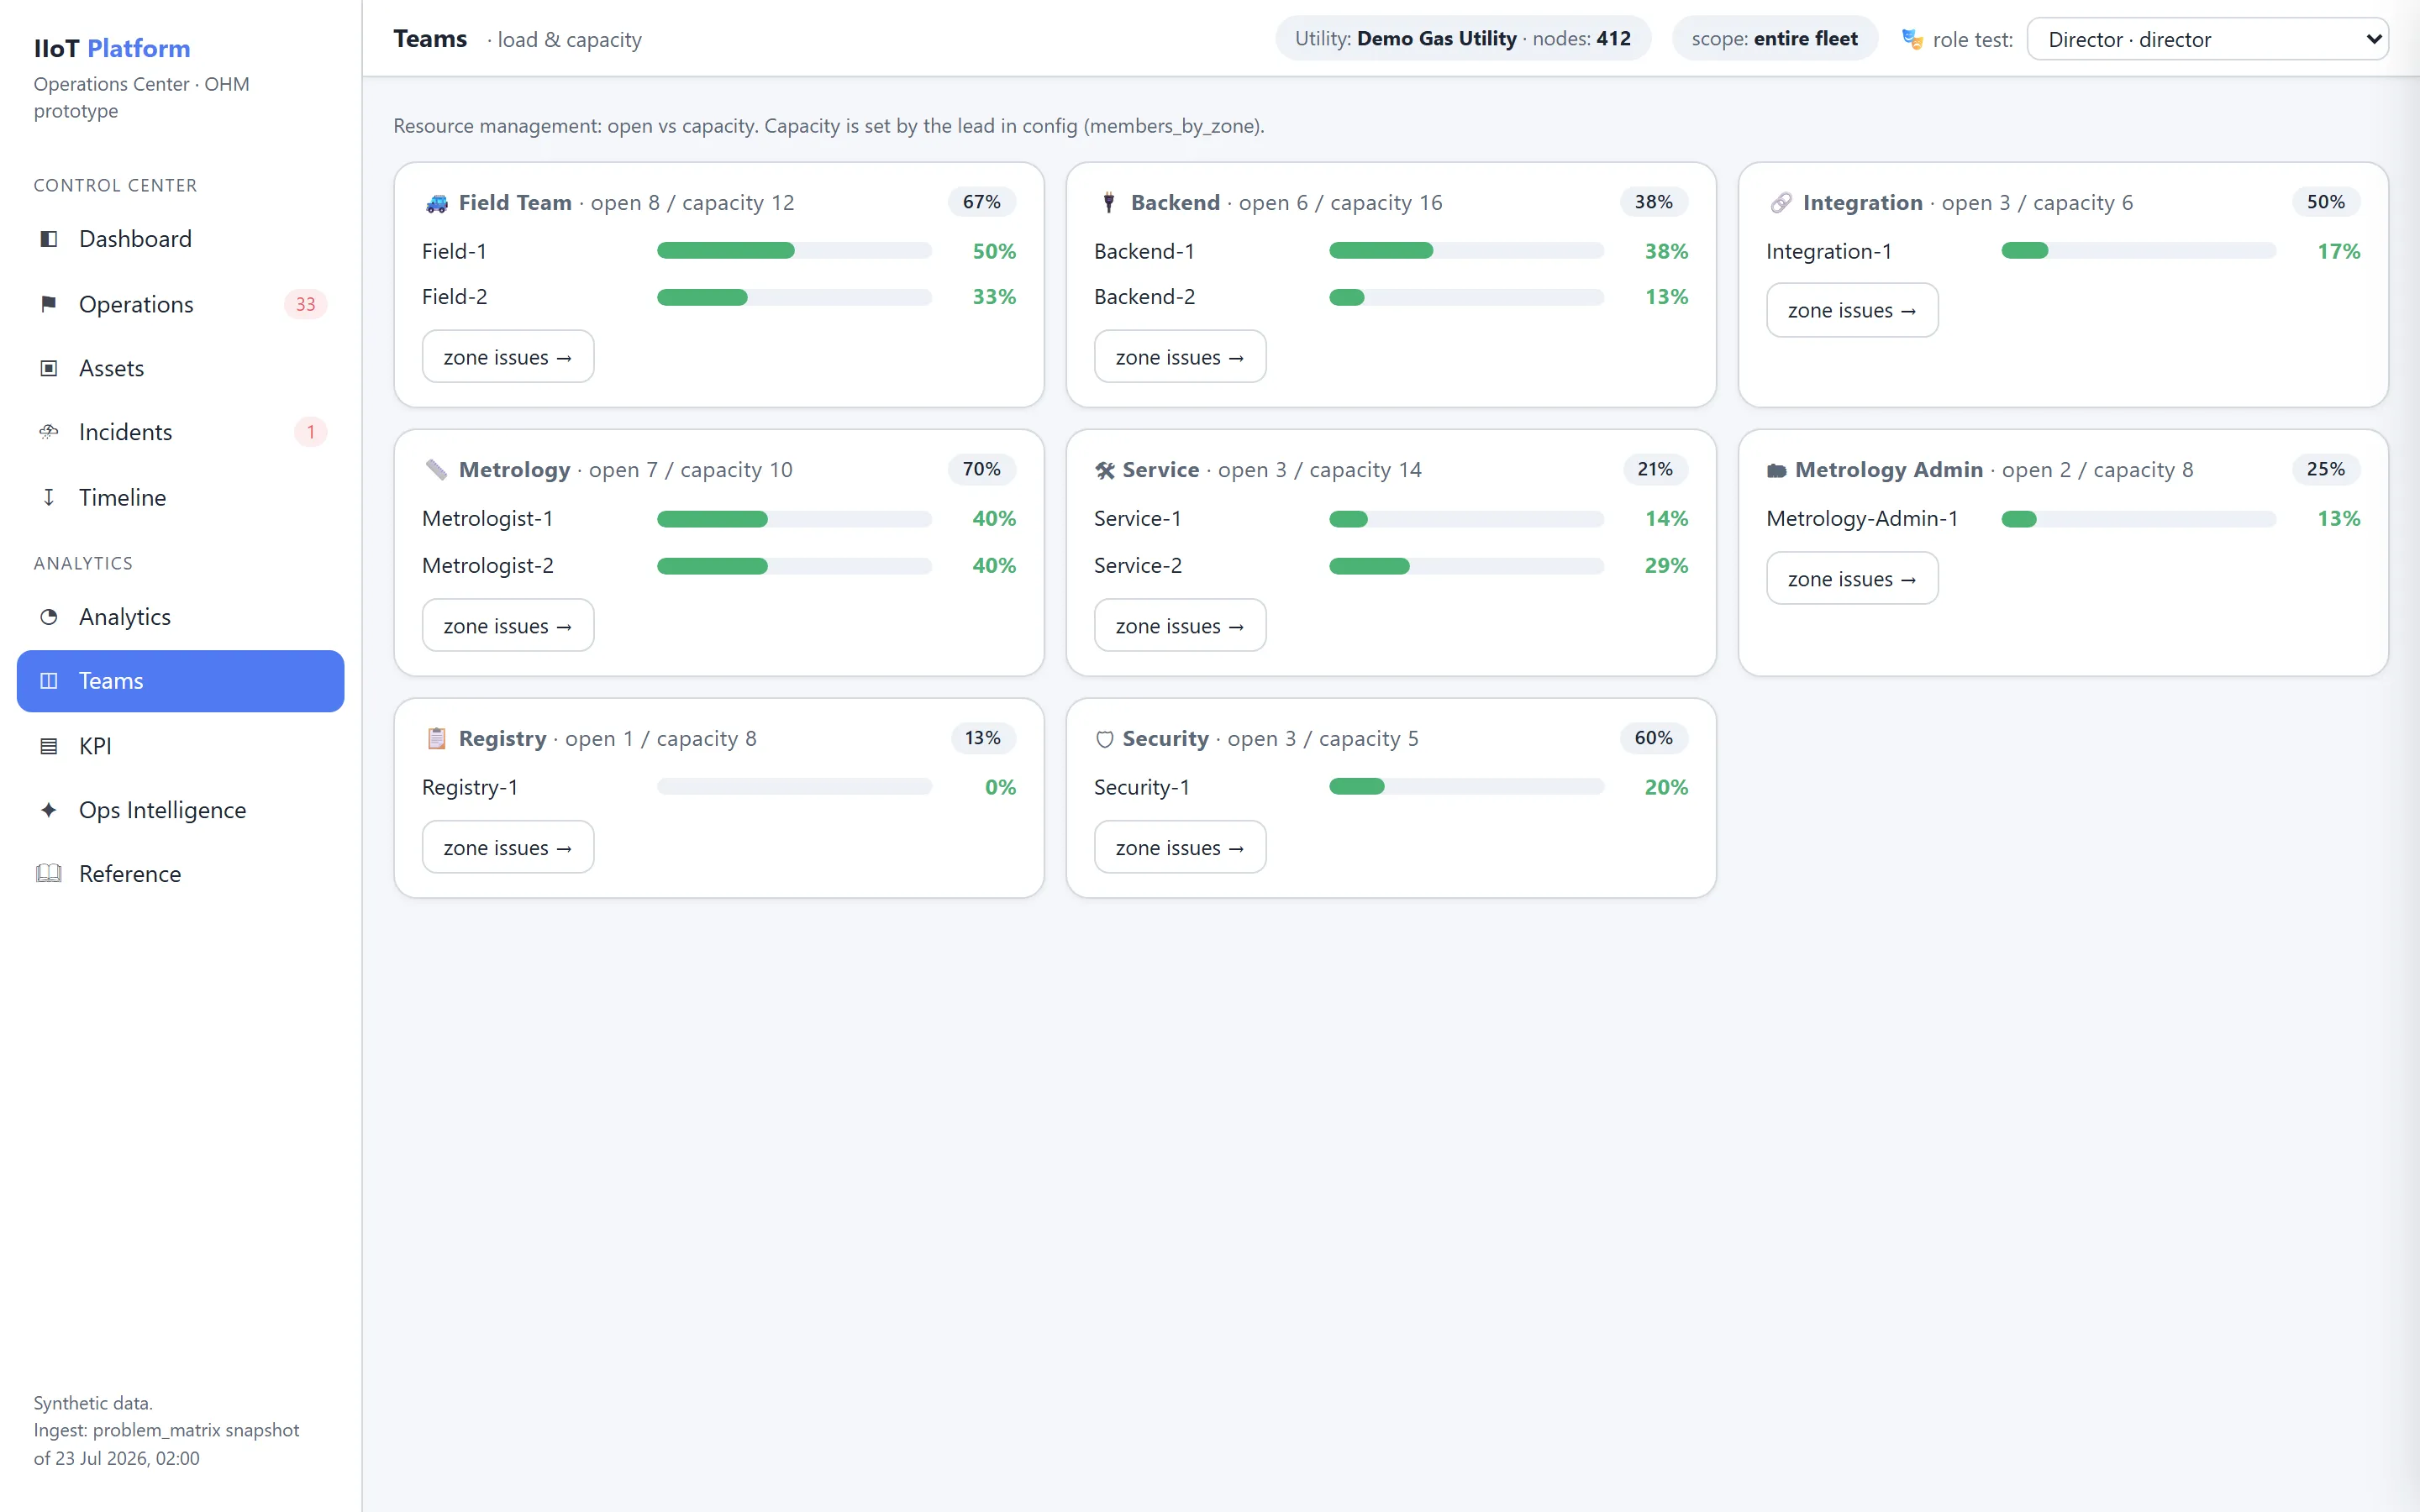
Завантаження (Workload)
Показує фактичне завантаження інженерів.
Враховуються:
- кількість активних Issues;
- їхня критичність;
- складність;
- кількість активів;
- обсяг Verification Queue.
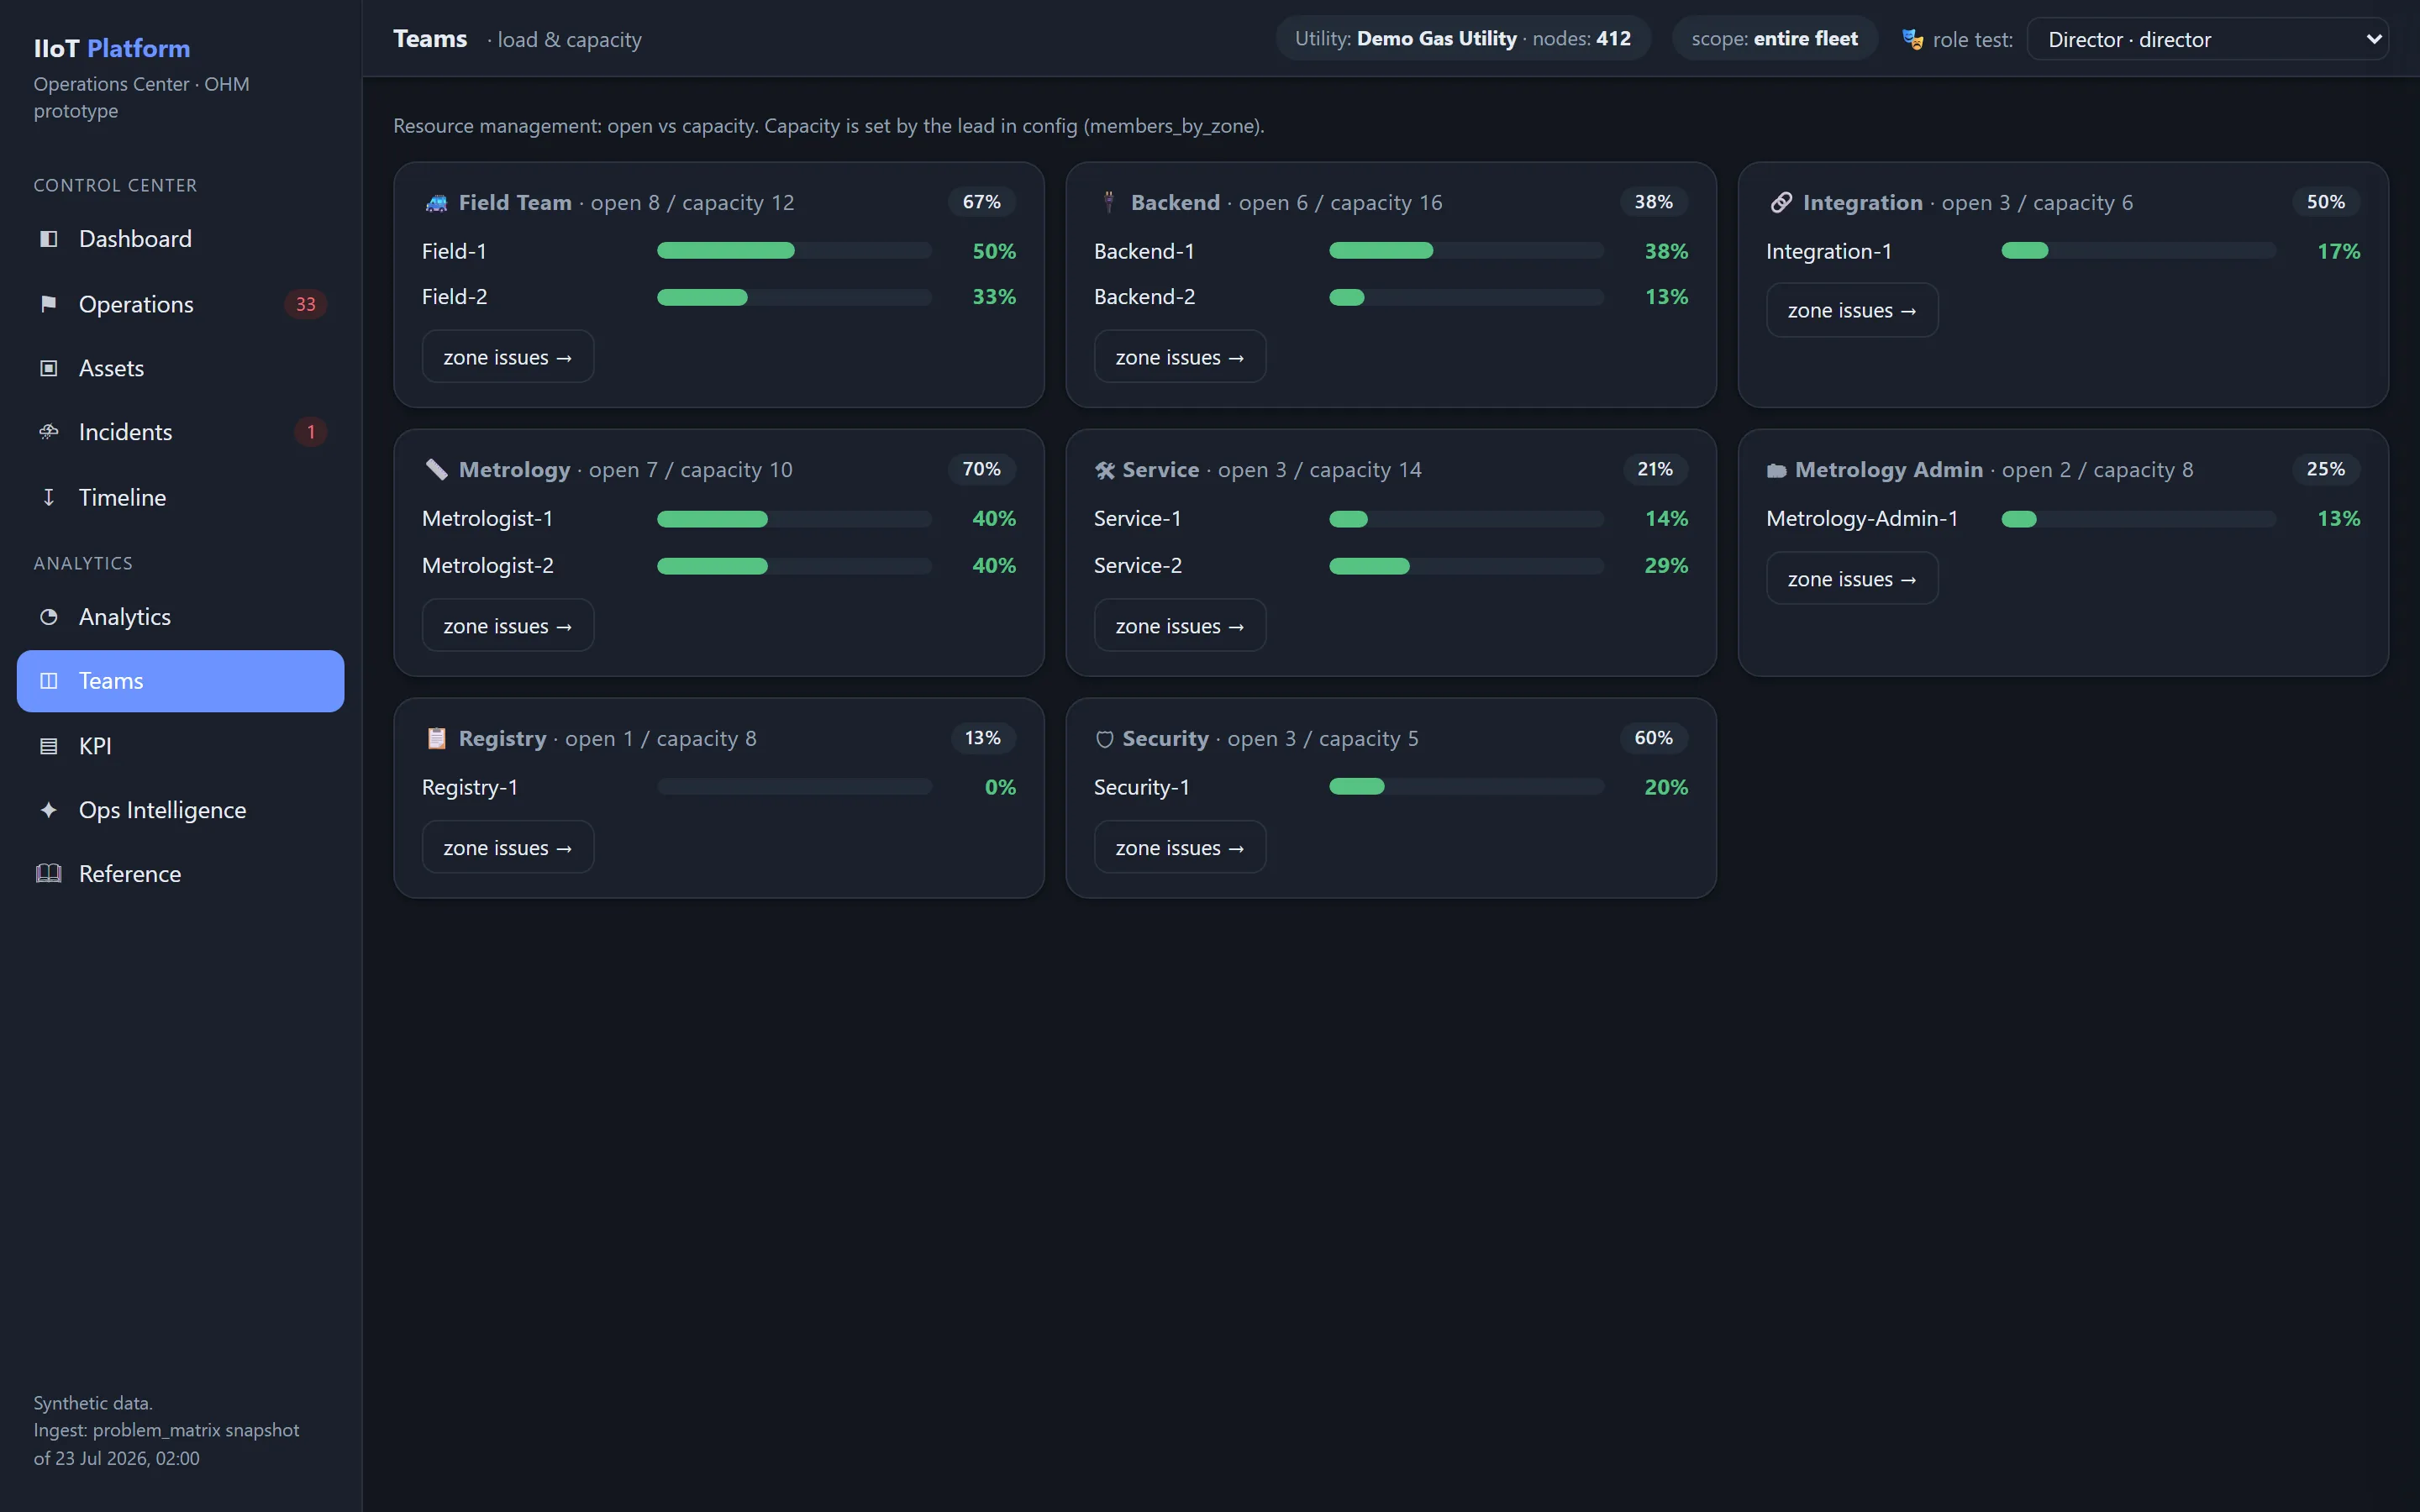
Використання ресурсів (Capacity Utilization)
Характеризує ступінь використання доступних ресурсів підрозділу.
Використовується для:
- балансування навантаження;
- планування штату;
- оцінювання потреби в перерозподілі робіт.
Усунення з першого разу (First Time Resolution)
Показує частку проблем, усунених без повторного відкриття.
Високе значення свідчить про високу якість діагностики та ремонту.
Баланс призначень (Assignment Balance)
Оцінює рівномірність розподілу Operational Issues між інженерами.
Використовується під час автоматичного призначення.
Середній час підтвердження
Показує середній час підтвердження результатів виконаних робіт.
Дає змогу виявляти вузькі місця процесу експлуатації.
Дашборд команди
Керівник підрозділу отримує:
- поточне завантаження;
- прогноз завантаження;
- SLA;
- backlog;
- ефективність;
- повторні відкриття;
- продуктивність команди;
- розподіл компетенцій.
Пов'язані теми
Чи була ця сторінка корисною?
Дякуємо за відгук!