Betriebliche KPI und Leistung der Teams
Betriebliche KPI von MTTD bis Verification Success Rate sowie die separate Gruppe der Team-KPI für Auslastung, Kapazität und Leistung der Teams.
Betriebliche Leistungskennzahlen (KPI)
Die Operational Health Matrix verwendet ein System betrieblicher Kennzahlen, das der objektiven Bewertung der Effektivität der Prozesse zur Erkennung, Analyse, Behebung und Verifizierung betrieblicher Probleme dient.
Im Unterschied zur herkömmlichen Berichterstattung dienen die KPI nicht nur der Bewertung von Abteilungen, sondern auch der kontinuierlichen Verbesserung der Plattform selbst.
Alle Kennzahlen berechnet das System automatisch anhand der tatsächlichen Lebenszyklushistorie der Operational Issues.
Architektur der KPI
Alle Kennzahlen werden in vier voneinander unabhängige Gruppen unterteilt.
flowchart TD
  ALL["Alle Kennzahlen"] --> OPS["Betriebliche KPI"]
  ALL --> ASSET["Asset-KPI"]
  ALL --> TEAM["Team-KPI"]
  ALL --> PLAT["Plattform-KPI"]
Diese Trennung verhindert, dass Gerätezustand, Mitarbeiterleistung und die Qualität der analytischen Algorithmen vermischt werden.
Mittlere Erkennungszeit (MTTD)
MTTD beschreibt die Effektivität des Analysesubsystems.
Definition:
Die durchschnittliche Zeit zwischen dem tatsächlichen Auftreten eines Problems und seiner automatischen Erkennung durch die Plattform.
Damit werden bewertet:
- die Qualität der Detektoren;
- die Vollständigkeit der Telemetrie;
- Verzögerungen bei der Verarbeitung;
- die Effektivität der Analytik.
Je niedriger der Wert, desto schneller erkennt das System das Problem.
Mittlere Bestätigungszeit (MTTA)
Zeigt die Reaktionsgeschwindigkeit des Betriebsdienstes.
Definition:
Die durchschnittliche Zeit zwischen dem Anlegen eines Operational Issue und der Bestätigung seiner Übernahme durch die zuständige Abteilung.
Damit lassen sich bewerten:
- die Reaktionsgeschwindigkeit;
- die organisatorische Disziplin;
- die Effektivität der Leitstelle.
Mittlere Behebungszeit (MTTR)
Die zentrale betriebliche Kennzahl.
Definition:
Die durchschnittliche Zeit zwischen dem Anlegen eines Operational Issue und der bestätigten Beseitigung seiner Ursache.
In die Berechnung gehen ausschließlich abgeschlossene Issues ein.
Für unterschiedliche Problemklassen sind eigene Zielwerte zulässig.
Mittlere Verifizierungszeit (MTTV)
MTTV bewertet die Effektivität des Verifizierungsprozesses.
Die Kennzahl beschreibt:
die Zeit zwischen dem Abschluss der Arbeiten und der Bestätigung, dass der Normalzustand der Geräte wiederhergestellt ist.
Ein hoher MTTV deutet in der Regel auf Folgendes hin:
- unzureichende Telemetrie;
- ein aufwendiges Verifizierungsverfahren;
- einen Mangel an Ressourcen;
- Probleme in der Organisation des Betriebs.
SLA-Einhaltung (SLA Compliance)
Zeigt den Anteil der Operational Issues, die ohne Verletzung der SLA-Vorgaben abgeschlossen wurden.
Die Berechnung erfolgt getrennt für:
- Reaktion (Response);
- Bestätigung (Acknowledgement);
- Behebung (Resolution);
- Verifizierung (Verification);
- Abschluss (Closure).
Eine gesonderte Statistik wird geführt:
- nach Regionen;
- nach Abteilungen;
- nach Canons;
- nach Gerätetypen.
Durchschnittliches Alter der Issues (Mean Issue Age)
Zeigt das durchschnittliche Alter der aktiven Operational Issues.
Dient der Bewertung des aufgelaufenen betrieblichen Rückstands.
Zusätzlich wird die Verteilung berechnet:
- 0–1 Tag;
- 1–3 Tage;
- 3–7 Tage;
- 7–30 Tage;
- mehr als 30 Tage.
Wiedereröffnungsquote (Reopen Rate)
Beschreibt die Qualität der Problembehebung.
Definition:
Der Anteil der Operational Issues, die nach dem Abschluss erneut geöffnet wurden.
Ein hoher Wert ist ein Hinweis auf:
- eine unvollständige Beseitigung der Ursache;
- eine fehlerhafte Diagnose;
- eine unzureichende Verifizierung;
- chronische Gerätedefekte.
Wiederholungsquote von Problemen (Repeat Issue Rate)
Zeigt, wie häufig sich identische Canons bei ein und demselben Asset wiederholen.
Dient der Analyse:
- chronischer Ausfälle;
- des Modernisierungsbedarfs der Geräte;
- der Instandhaltungsqualität.
Anteil übersehener Probleme (Issue Escape Rate)
Zeigt den Anteil der Probleme, die nicht automatisch erkannt, sondern von Benutzern erfasst wurden.
Steigt diese Kennzahl, sind zu analysieren:
- die Abdeckung durch Detektoren;
- die Qualität der Telemetrie;
- die Vollständigkeit der Analytik.
Erfolgsquote der Verifizierung (Verification Success Rate)
Bestimmt den Anteil der Arbeiten, die nach ihrer Ausführung vom System erfolgreich bestätigt wurden.
Ein hoher Wert spricht für:
- eine korrekte Diagnose;
- eine ordnungsgemäße Ausführung der Arbeiten;
- eine hohe Zuverlässigkeit des Operational Workflow.
Betrieblicher Backlog
Der Backlog zeigt den Umfang der noch nicht abgeschlossenen Arbeiten.
Zusätzlich analysiert das System:
- den Gesamtumfang;
- den kritischen Backlog;
- den überfälligen Backlog;
- den Backlog nach Abteilungen;
- den Backlog nach Regionen.
KPI-Dashboard
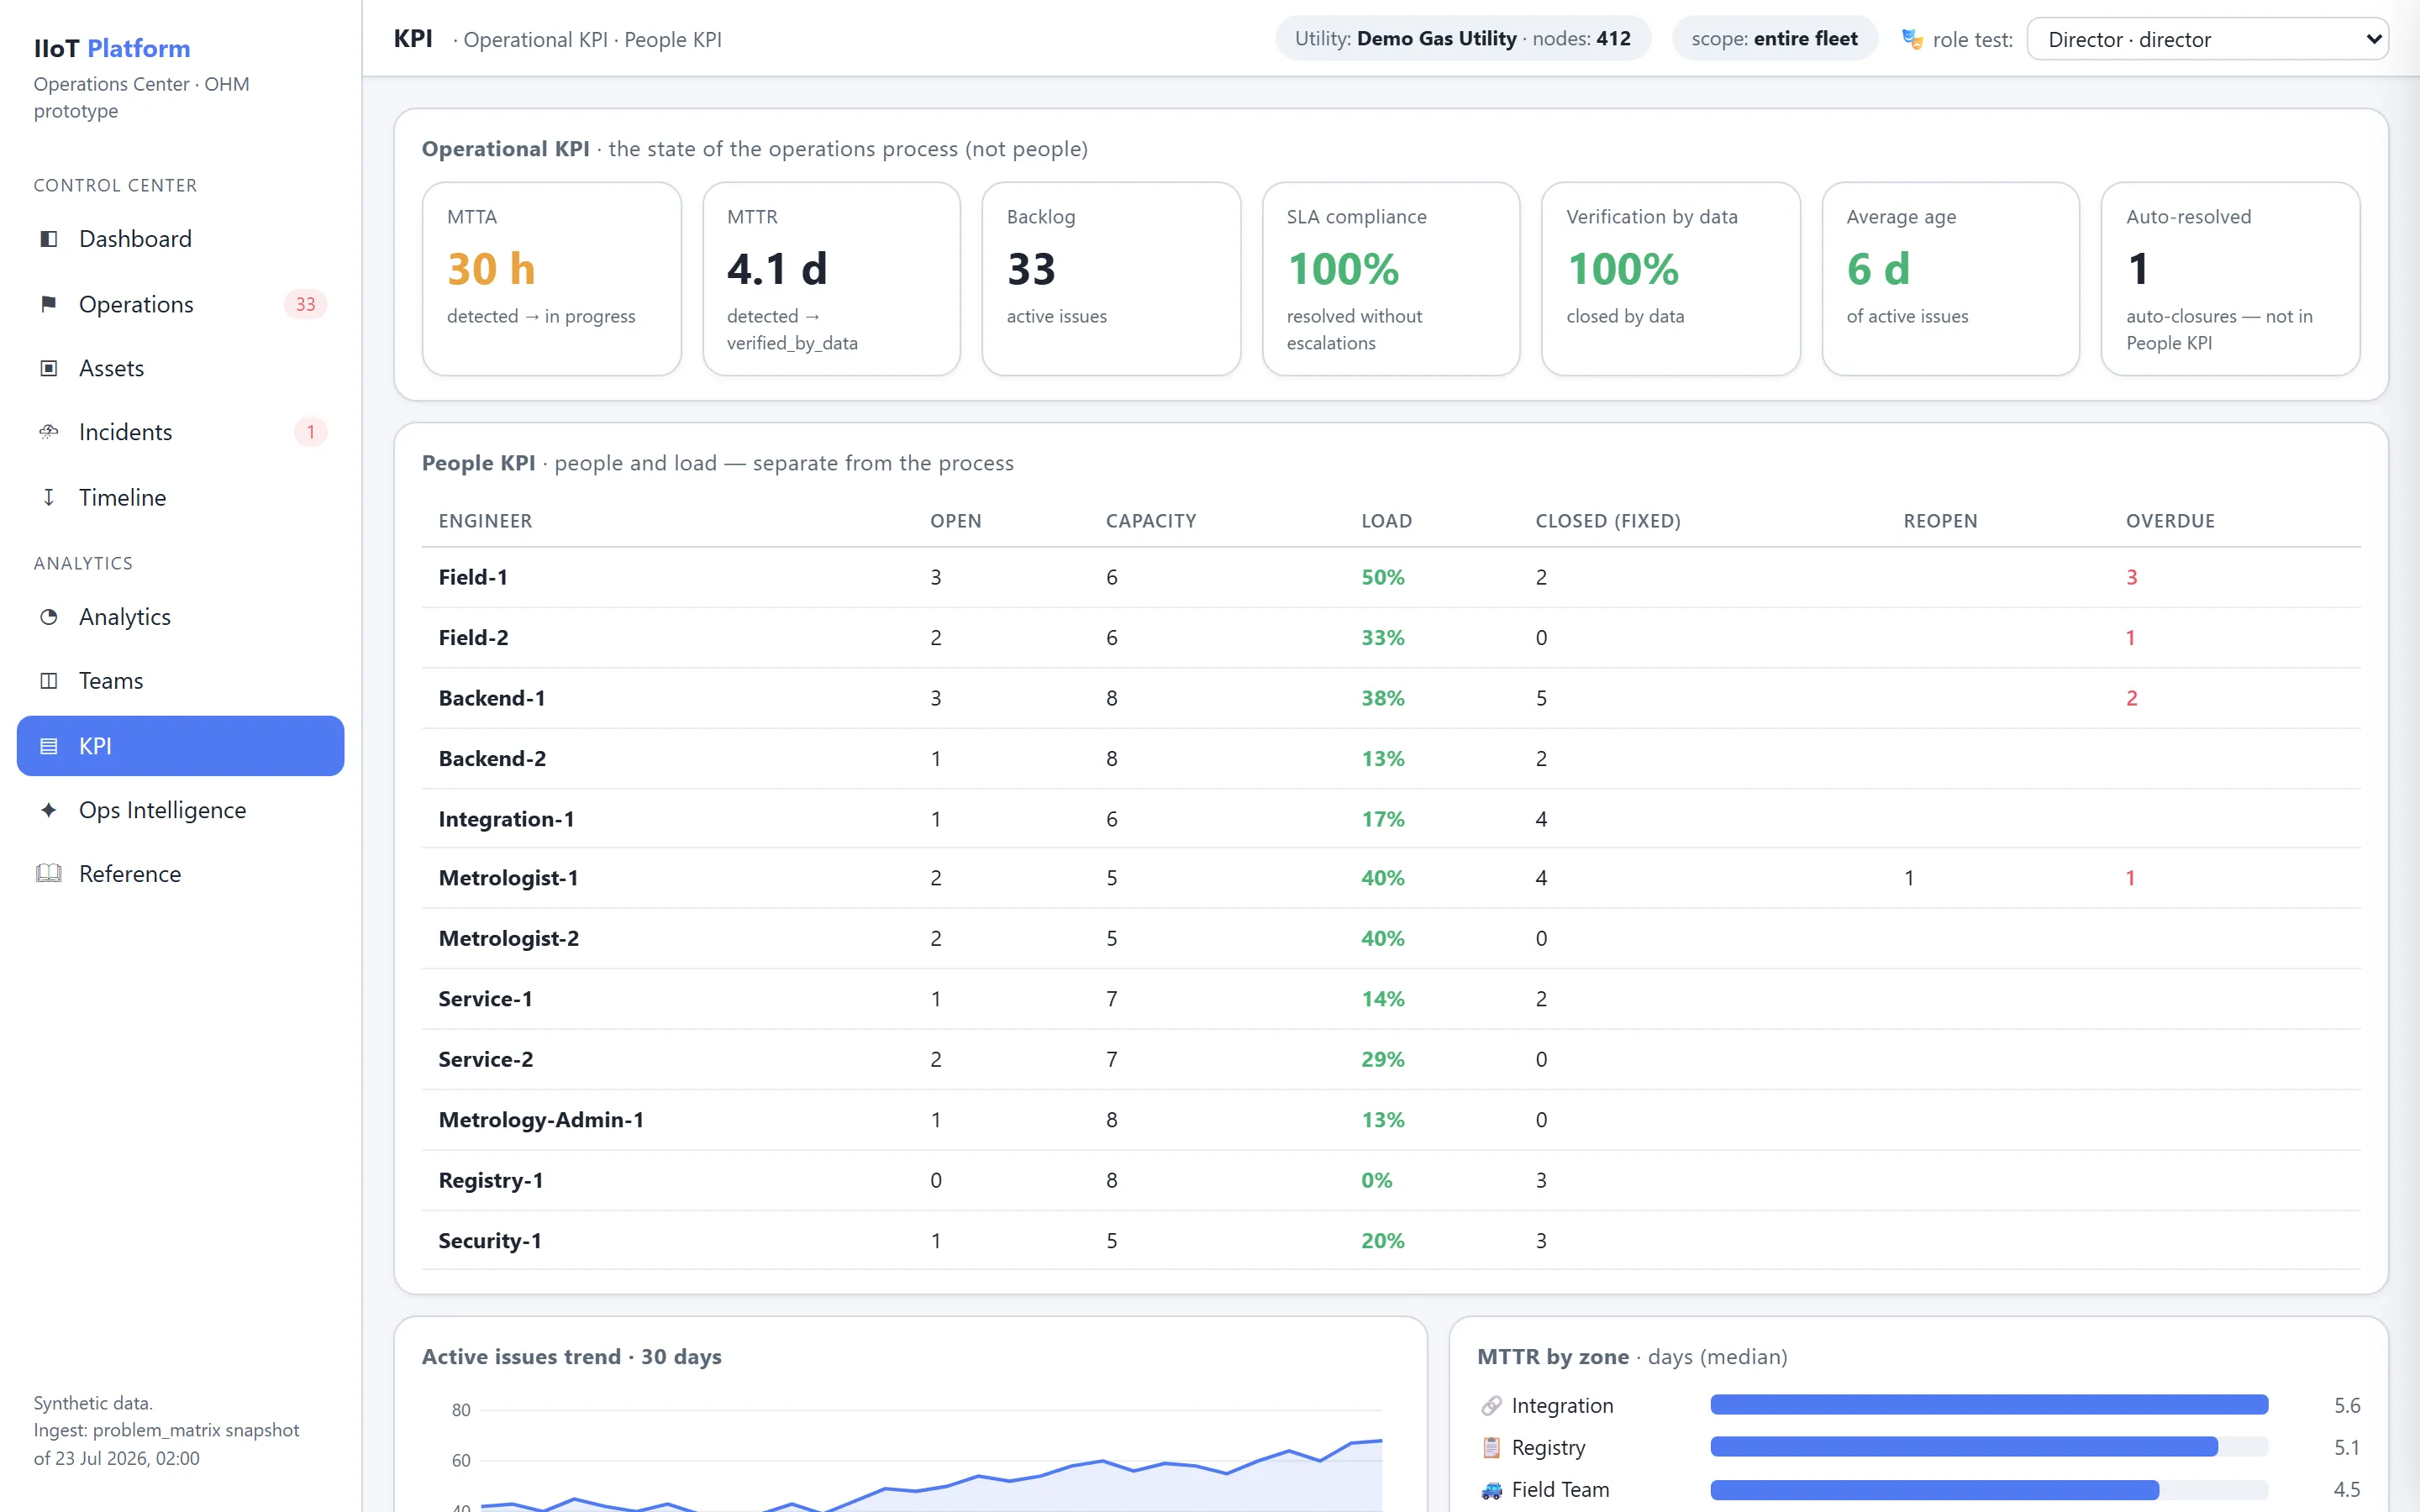
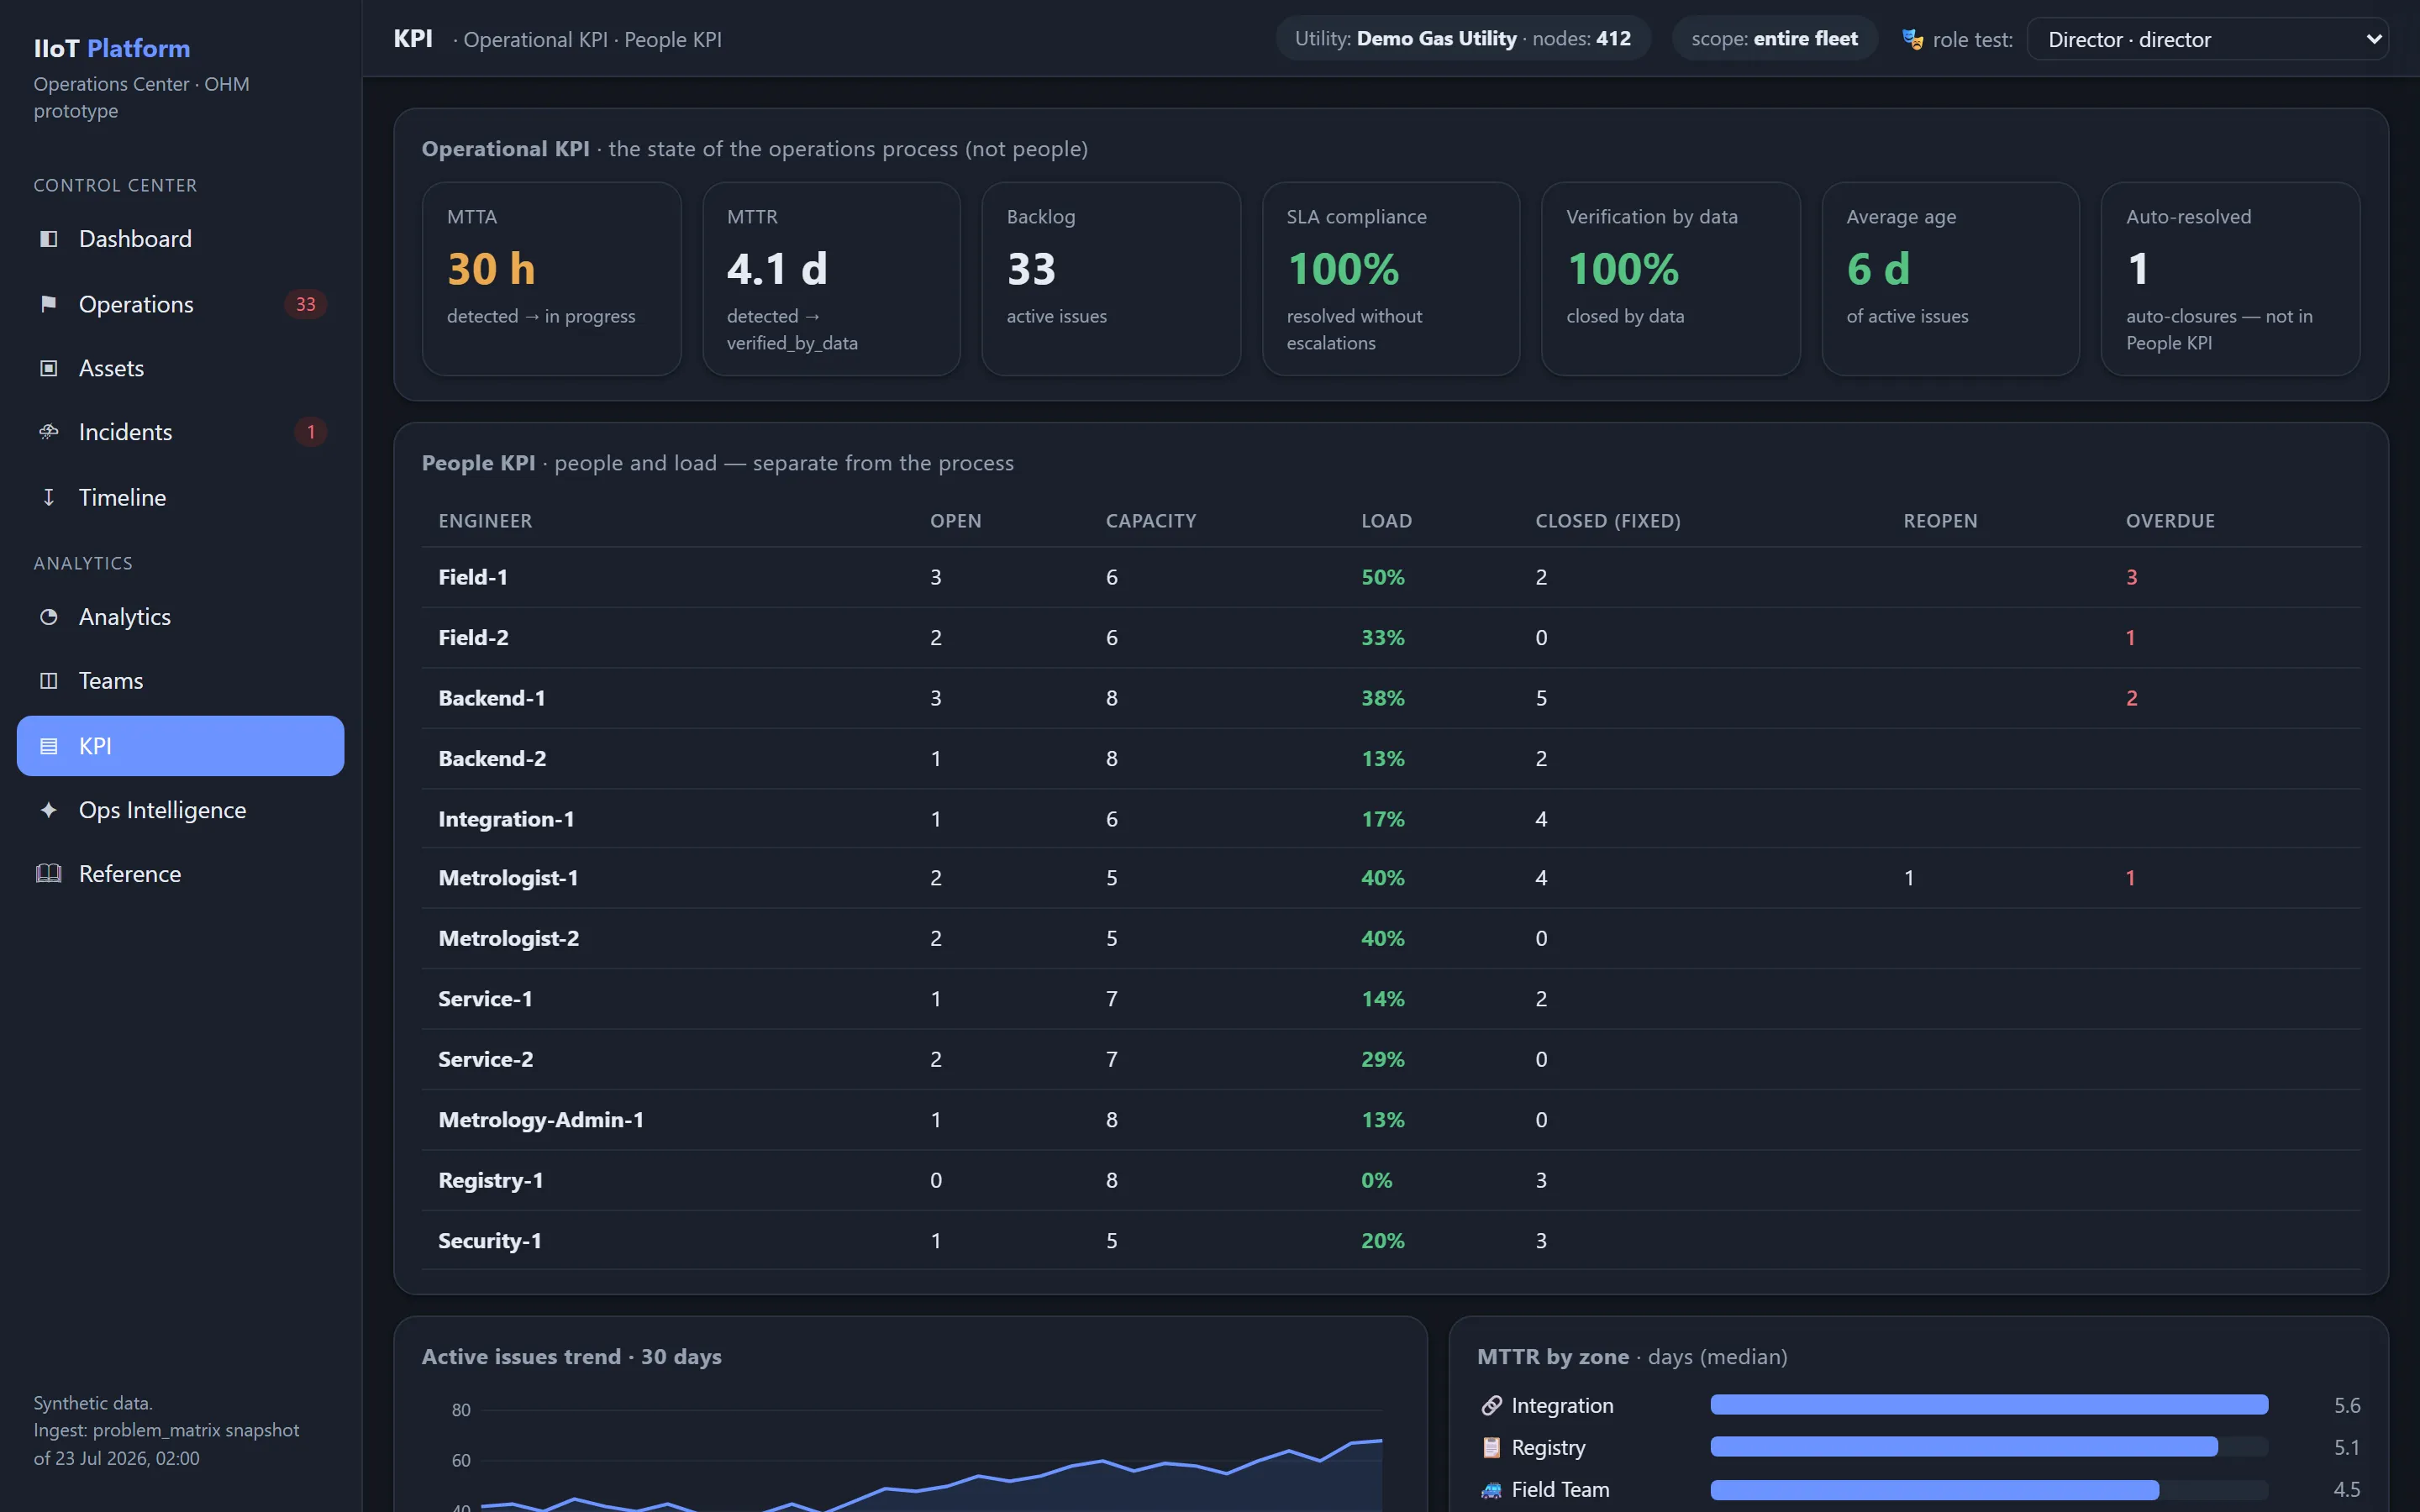
Das zentrale Analyse-Dashboard enthält:
- MTTD;
- MTTA;
- MTTR;
- MTTV;
- SLA Compliance;
- Reopen Rate;
- Repeat Rate;
- Detector Accuracy;
- False Positive Rate;
- Operational Backlog;
- Mean Issue Age;
- Health Trend.
Alle Kennzahlen stehen im Zeitverlauf und auf jeder Ebene der Organisationsstruktur zur Verfügung.
Leistungskennzahlen der Teams
Betriebliche Kennzahlen der Geräte werden nicht zur Bewertung von Mitarbeitern herangezogen.
Für die Bewertung der Effektivität von Abteilungen dient eine separate Gruppe von Team-KPI.
So wird ausgeschlossen, dass eine Verschlechterung des Gerätezustands automatisch die Bewertung der Arbeit des Personals herabsetzt.
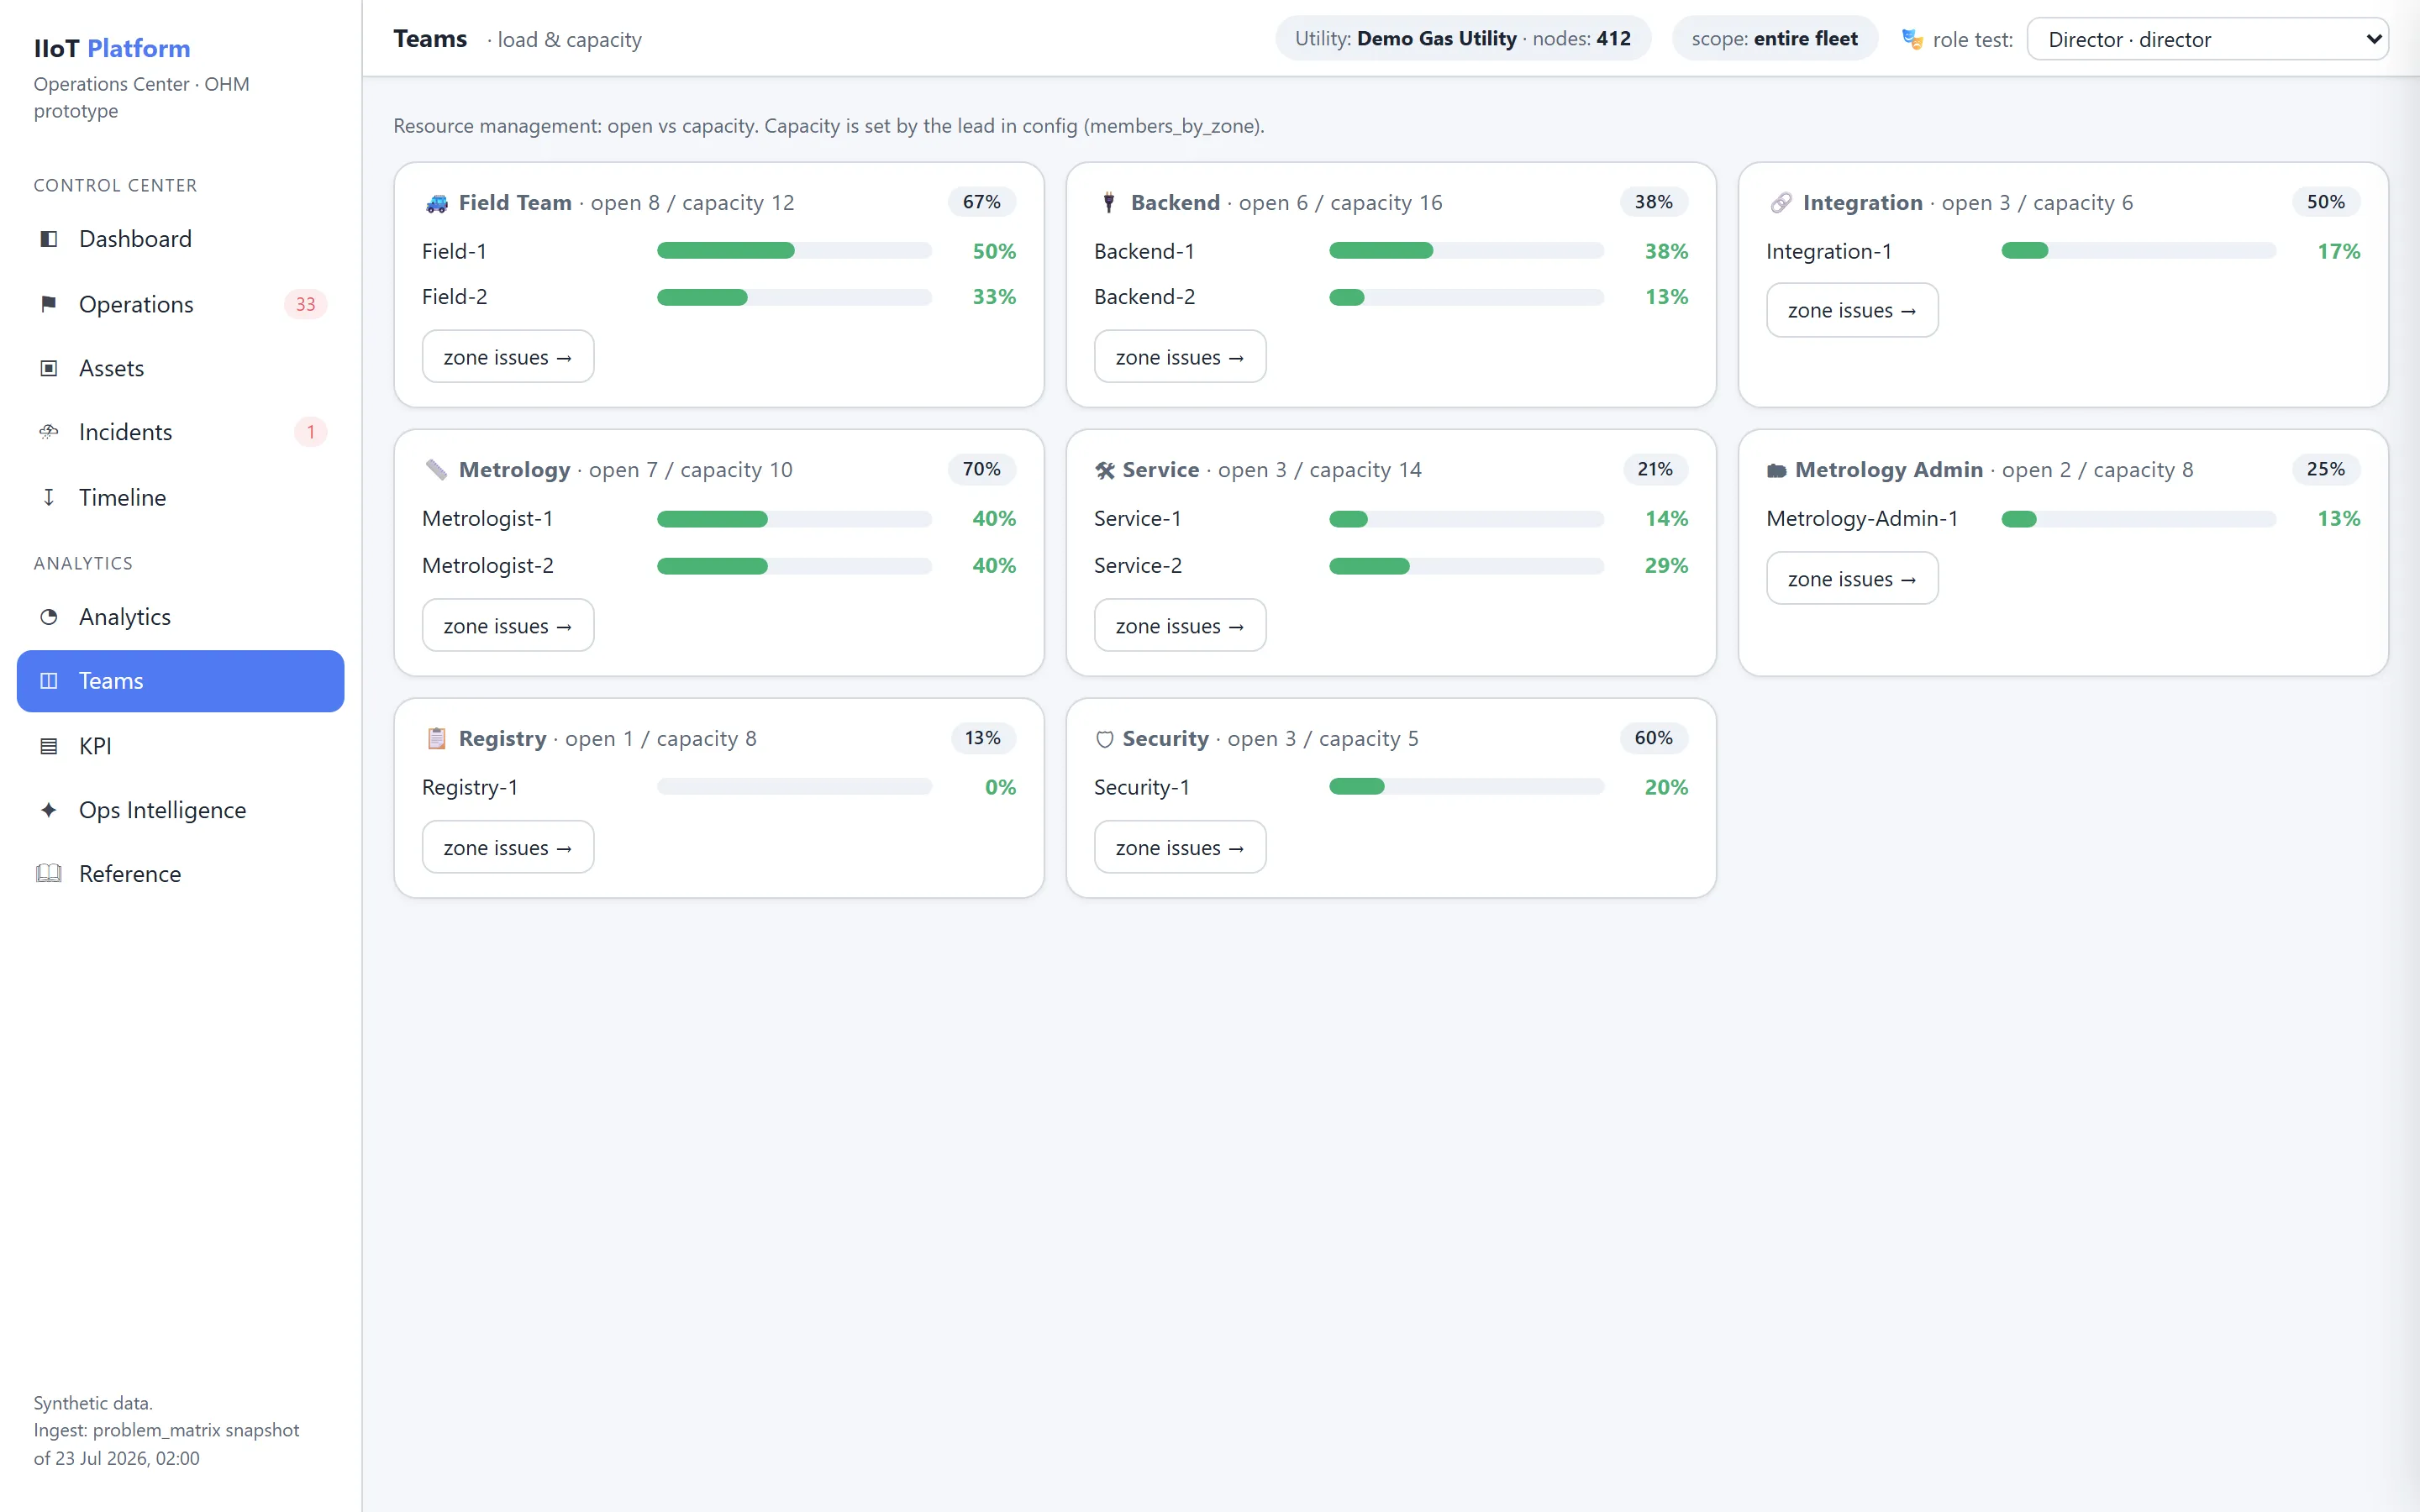
Arbeitslast (Workload)
Zeigt die tatsächliche Arbeitslast der Ingenieure.
Berücksichtigt werden:
- die Anzahl der aktiven Issues;
- deren Kritikalität;
- die Komplexität;
- die Anzahl der Assets;
- der Umfang der Verification Queue.
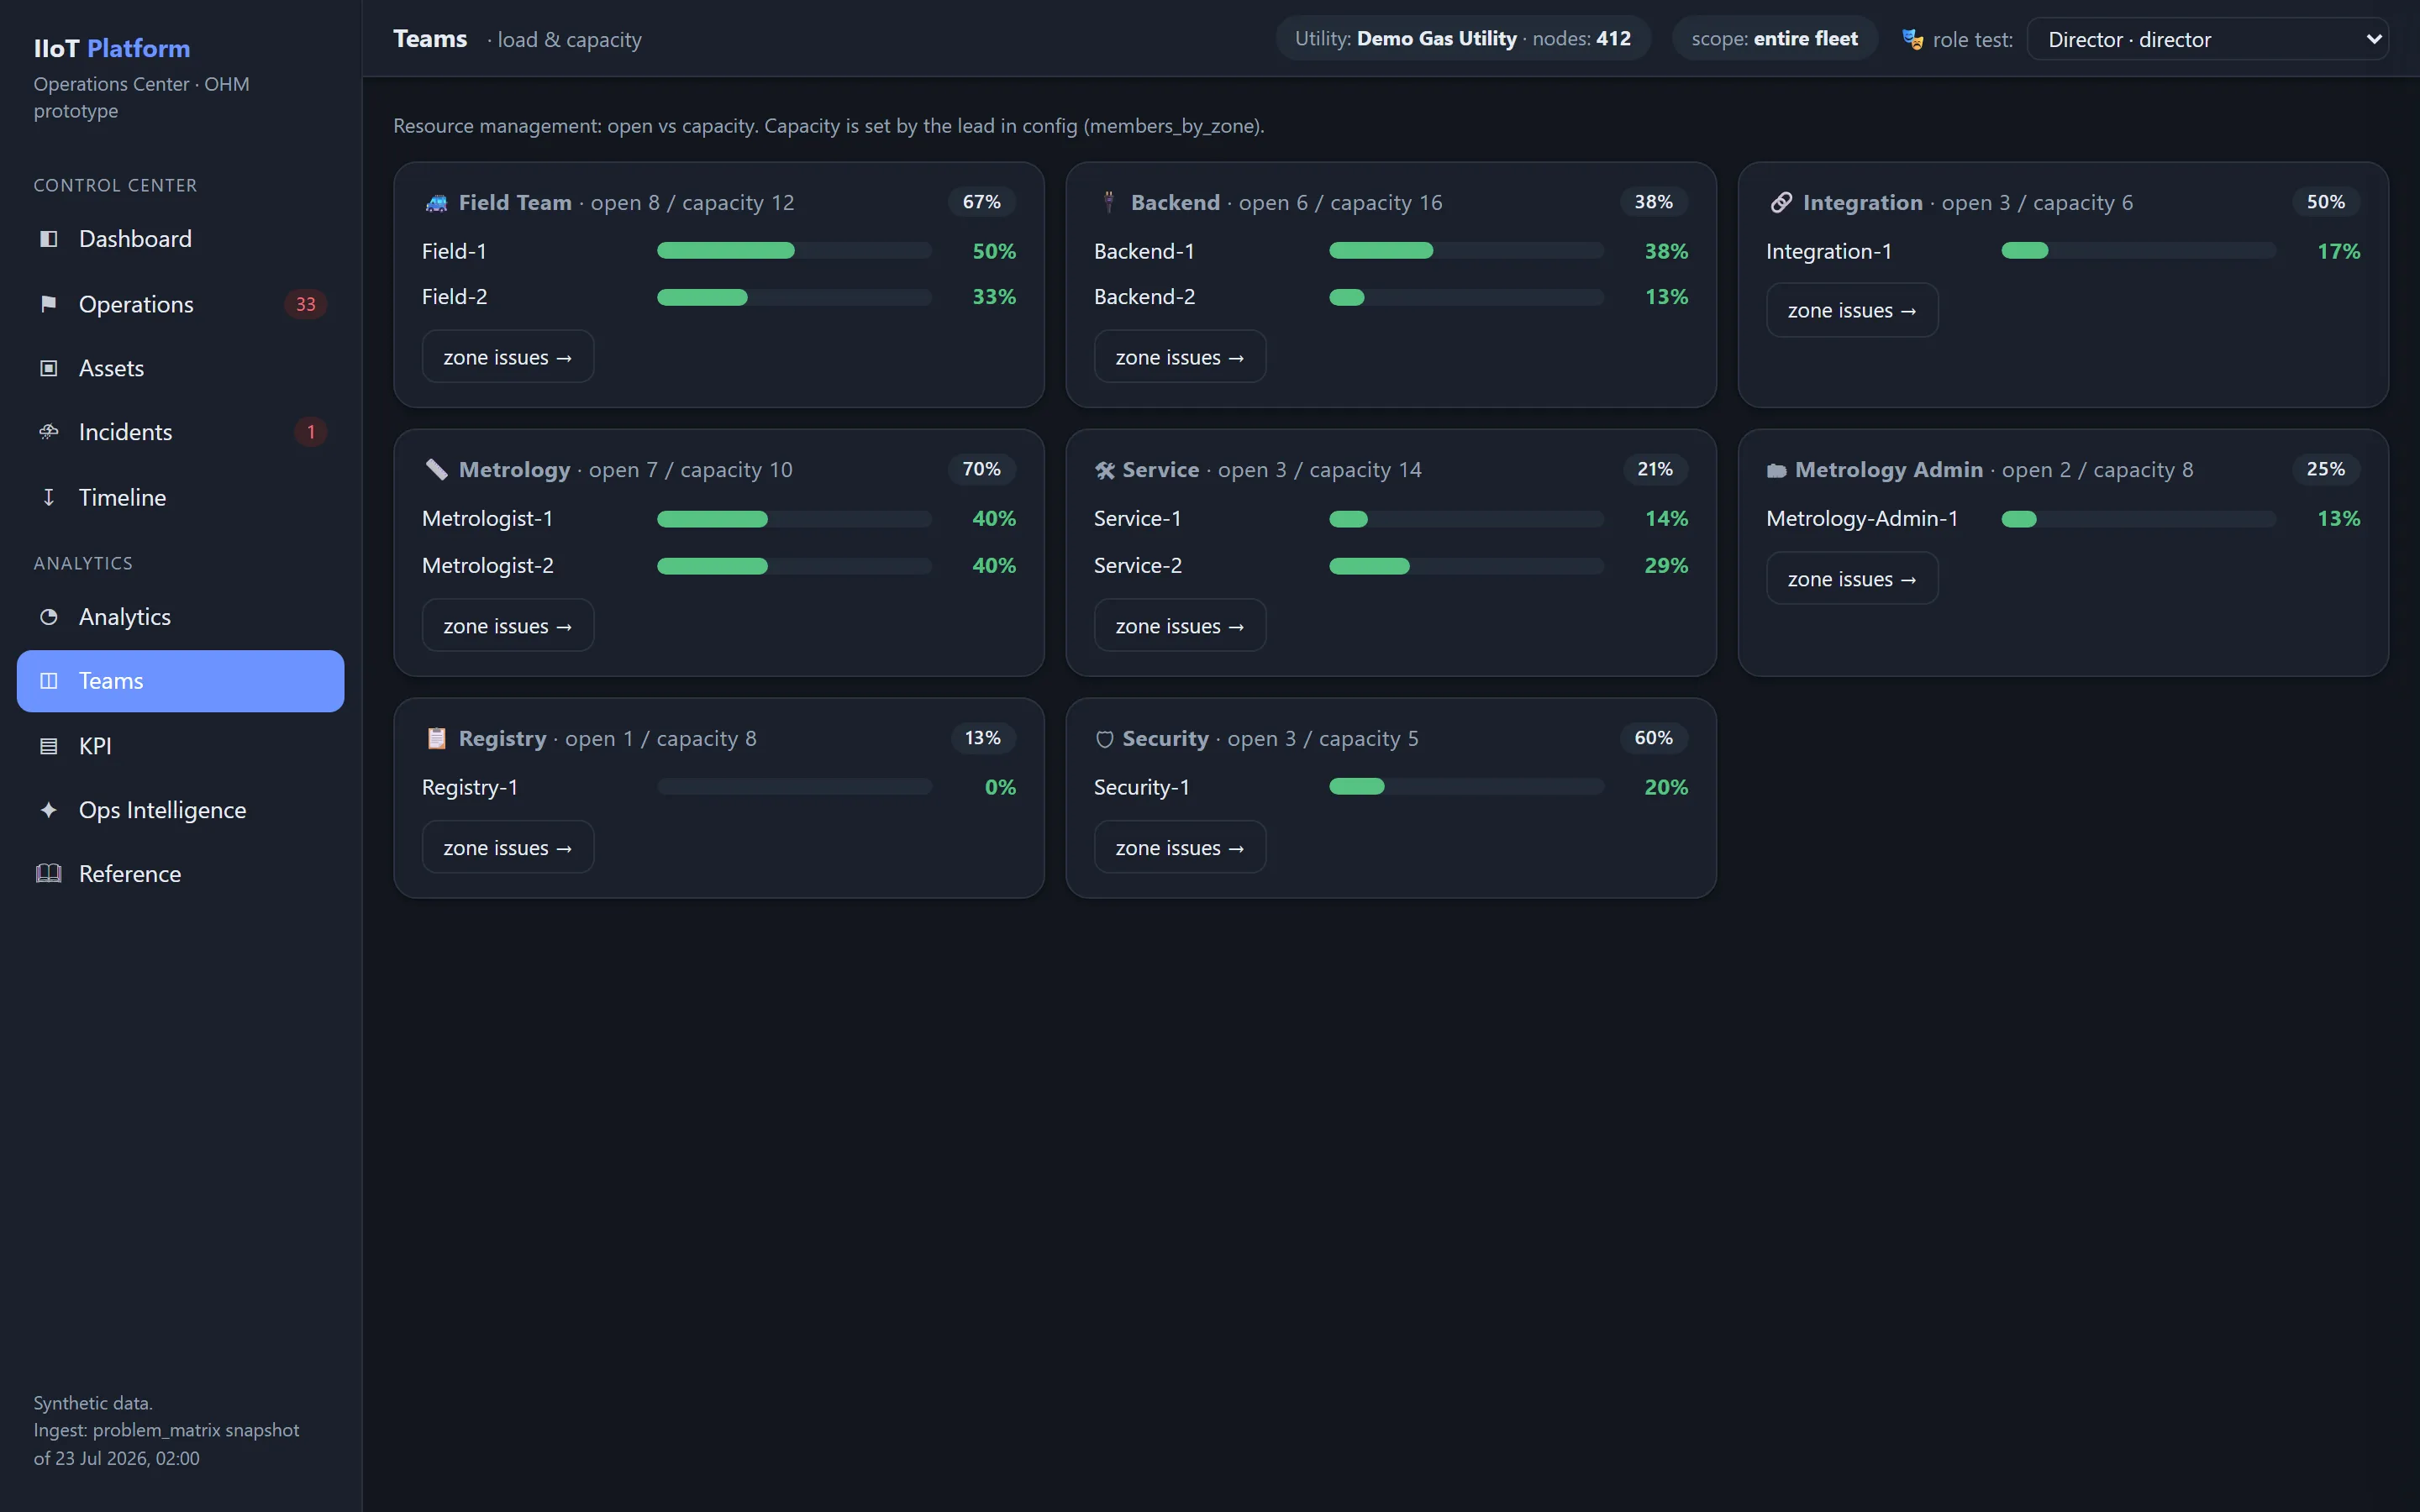
Kapazitätsauslastung (Capacity Utilization)
Beschreibt, in welchem Maß die verfügbaren Ressourcen der Abteilung genutzt werden.
Dient:
- der Lastverteilung;
- der Personalplanung;
- der Bewertung, ob Arbeiten umverteilt werden müssen.
Behebung im ersten Anlauf (First Time Resolution)
Zeigt den Anteil der Probleme, die ohne Wiedereröffnung behoben wurden.
Ein hoher Wert steht für eine hohe Qualität von Diagnose und Instandsetzung.
Ausgewogenheit der Zuweisungen (Assignment Balance)
Bewertet, wie gleichmäßig die Operational Issues auf die Ingenieure verteilt sind.
Wird bei der automatischen Zuweisung verwendet.
Durchschnittliche Verifizierungszeit
Zeigt die durchschnittliche Zeit bis zur Bestätigung der Ergebnisse ausgeführter Arbeiten.
Damit lassen sich Engpässe im Betriebsprozess erkennen.
Team-Dashboard
Die Führungskraft der Abteilung erhält:
- die aktuelle Arbeitslast;
- eine Prognose der Arbeitslast;
- SLA;
- Backlog;
- Effizienz;
- Wiedereröffnungen;
- die Produktivität des Teams;
- die Verteilung der Kompetenzen.
Verwandte Themen
War diese Seite hilfreich?
Danke für dein Feedback!